
Automated Parameter Optimization for Trading Strategies Using Python and MQL5
Why Auto-Optimization is Essential
Imagine you have a trading bot developed with much effort. You're excited to see it in action but start without proper optimization. Initial positive results may mislead you into thinking everything is fine, but soon inconsistencies and losses appear.
An unoptimized bot lacks consistency and may respond to irrelevant data, leading to unpredictable profits and losses. It might make decisions based on false signals, not adapting to market changes, and assume unanticipated risks, causing significant losses. Optimization ensures better performance and reliability.
Readers will understand the importance of auto-optimization, different algorithms used, and see practical examples in Python and Expert Advisor (EA) scripts. They'll learn how to set up auto-optimization, compare results, and properly configure parameter optimization, enhancing their trading strategy efficiency.
Self-optimization algorithms for trading strategies include parameter optimization, evolutionary algorithms, heuristic methods, gradient-based techniques, machine learning, and simulation-based optimization. Each has unique pros and cons, tailored for different trading needs and market conditions.
Parameter Optimization Techniques
- Brute Force Optimization: Tests all parameter combinations for precise results but is resource-intensive.
- Grid Search: Evaluates combinations in a grid for balanced thoroughness and efficiency.
- Random Search: Randomly tests combinations for quicker results, sacrificing some precision.
Each technique has its strengths, making the choice dependent on available resources, time, and desired precision.
Why and when should we use python?
Python programs are an excellent tool to try ideas, create graphics quickly and confirm theoretical statements with historical trading data. Python allows users to develop and adjust models agilely, which facilitates experimentation with different strategies and parameters. Its ability to generate detailed graphs and visualizations helps interpret the results more intuitively. In addition, the possibility of integrating historical data allows verifying how strategies would have worked in past scenarios, providing practical validation to the theories raised. This combination of speed, flexibility and analytical capacity makes Python an invaluable tool for any trader that seeks to optimize their strategies and better understand financial markets.
What Strategy will we use for this article and its indicator
The Mobile Sox Crossing Strategy (MAs Crossing) is a trading technique that is based on the intersection of two moving averages to generate Buy and Sell signals. It uses two moving averages of different periods, one short and one long, to identify changes in the price trend. When the short MA crosses above the long MA, a Buy signal is generated, indicating a possible bullish trend. On the contrary, when the short MA crosses below the long one, a Sell signal is generated, which suggests a possible bearish trend. This strategy is popular due to its simplicity and effectiveness in markets with clear trends.
The SMA indicator (Simple Moving Average) is a tool that calculates the average price of an asset for a specific period. To calculate an SMA, the closing prices of an asset are added during the selected period and then divided by the number of periods. The SMA smooths price fluctuations and helps identify the general direction of the trend. This indicator is useful to eliminate market noise and provide a clearer vision of the underlying trend. In Python, SMA can be easily calculated using libraries such as pandas, which offer functions to calculate moving averages efficiently and precisely.
Parameter Optimizations with Python. Case study
We have one script for each technique in Python. We have already seen the differences of each approach.
The strategy is the same through the three scripts. If you want to use another strategy, this is what you should change:
    data = data.copy()  # Create a copy of the original DataFrame
    data['Short_MA'] = data['Close'].rolling(window=short_window).mean()
    data['Long_MA'] = data['Close'].rolling(window=long_window).mean()
    data['Signal'] = 0
    data.loc[data.index[short_window:], 'Signal'] = np.where(
        data['Short_MA'][short_window:] > data['Long_MA'][short_window:], 1, 0)
    data['Position'] = data['Signal'].diff()
Python is very straightforward, so I won't explain the code.
The three scripts are attached to the article (b forec.py, grid search v2.py and random search v2.py).
Before using these scripts, you must install the libraries. You can use pip for this:
pip install numpy pandas matplotlib itertools MetaTrader5 random
results for each script, will show similar to this, with this inputs:
symbol = "EURUSD"
timeframe = mt5.TIMEFRAME_D1
start = pd.Timestamp("2020-01-01")
end = pd.Timestamp("2021-01-01")
Brute Force
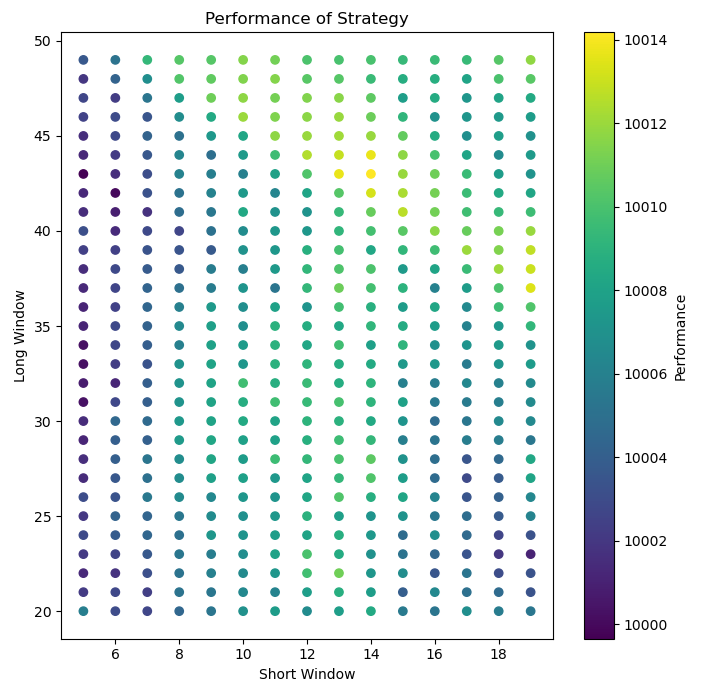
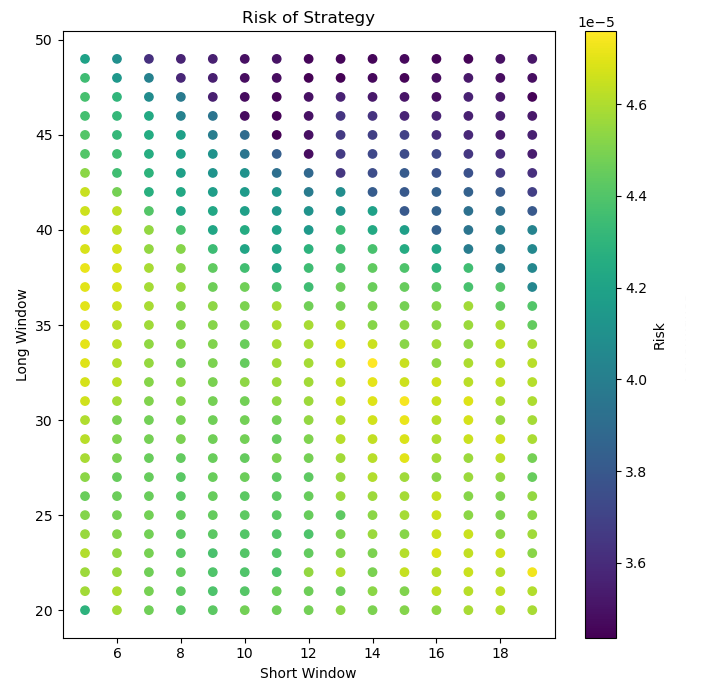
Best parameters: Short = 14.0, Long = 43.0
Best performance: 10014.176, Risk: 3.7431030827241524e-05
Grid Search
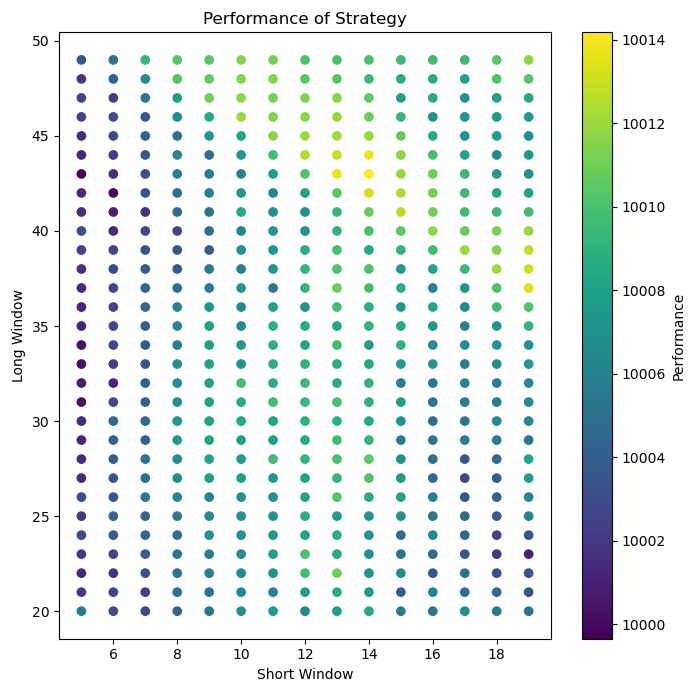
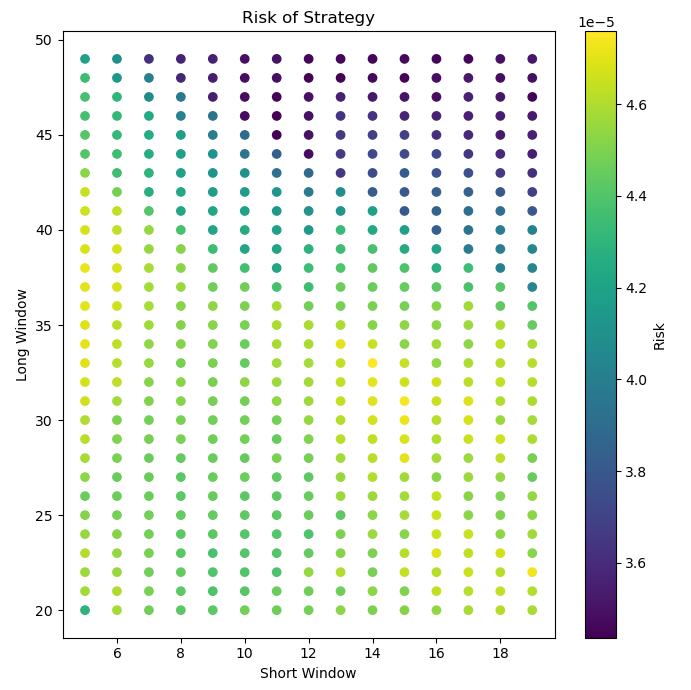
Best parameters: Short = 14.0, Long = 43.0
Best performance: 10014.176, Risk: 3.7431030827241524e-05
Random Search
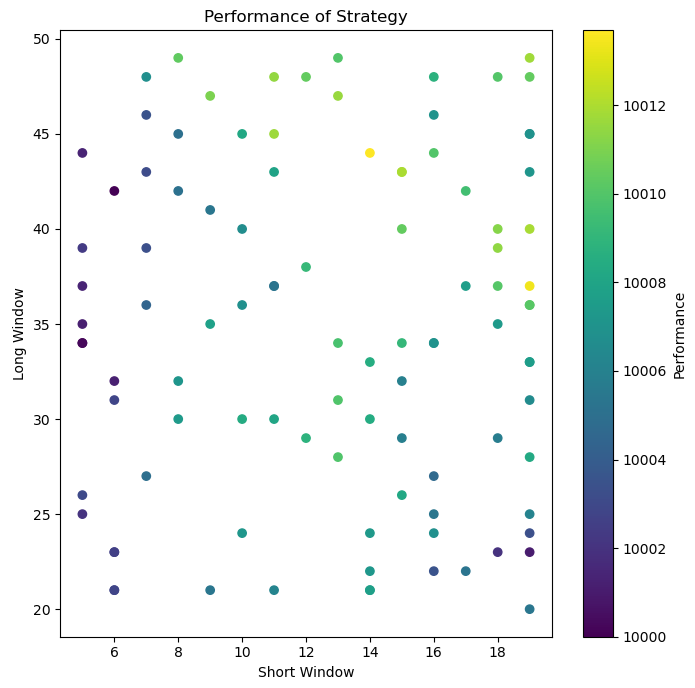
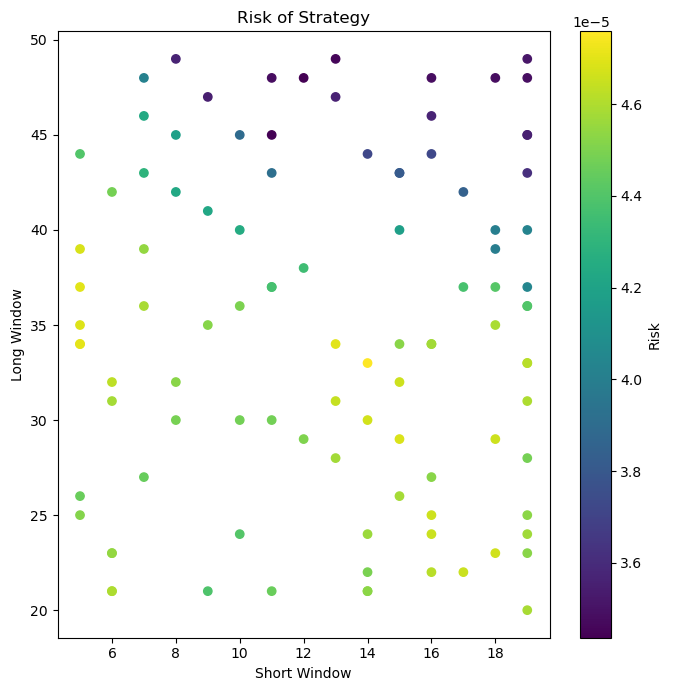
Best parameters: Short = 14.0, Long = 44.0
Best performance: 10013.697, Risk: 3.725494046576829e-05
These scripts do not auto-optimize, so you must select each period to study.
Results are good in all of them and equal, but we have to take into account that the strategy was simple, while other strategies can have more parameters and bigger ranges.
How often should I optimize a strategy?
Optimizing a trading strategy is crucial for maintaining its effectiveness over time. Frequency and lookback for optimization depend on several factors, especially market volatility.
Imagine that you are developing a trading strategy that operates with a 1-day time period, that is, each signal is based on daily market data. Volatility plays an important role here: when the market is more volatile, price movements are larger and faster, which can affect the effectiveness of your strategy if it does not fit properly.
To determine when to optimize and what lookback to use, you need to monitor market volatility. A good way to do it is to observe the daily price range (HIGH - LOW) or the true average range of the assets in which you operate. Below is an approximate guide based on volatility.
Low volatility: When the market is calm and daily ranges are small, strategies tend to need less frequent adjustments. You can think of optimizing every 1-3 months with a longer lookback to capture more stable trends. A 50-100-day lookback could be adequate.
Moderate volatility: In normal market conditions, with more regular but not extremely large price movements, consider optimizing every 1-2 months. A 20-50-day lookback could be enough to capture significant changes in the trend.
High volatility: During periods of high volatility, as in times of crisis or during important economic events, price movements are large and fast. Here it is crucial to optimize more frequently, possibly every 2-4 weeks, and use a shorter lookback, such as 10-20 days, to quickly adapt to changes in market conditions.
MQL5 Example of Self-Optimization
This code in MQL5 is a trading robot that implements a strategy for crossing moving averages (MA). It works on the MetaTrader 5 platform and is designed to operate in the financial market automatically. The bot uses two simple MAs (SMA) with adjustable periods to generate Buy and Sell signals when they cross.
The main objective of the bot is to optimize the MA periods automatically to maximize the net benefit, minimize the drawdown or maximize Sharpe, according to the configuration chosen by the user. This is achieved through an optimization process that tests different combinations of MA periods in a specific period of historical data.
The bot is structured with several key sections:
1. Initialization and configuration: Define the initial parameters such as MA periods, lot size, magic number for orders identification, etc.
2. Optimization: Use an exhaustive search algorithm to test all possible combinations of MA periods within specified ranges. Optimization is carried out based on the selected criteria: Net benefit or minimum drawdown.
3. Execution of operations: Continuously monitor the market and open purchase or sale positions when MA crosses occur according to the defined strategy. It also manages open positions, applying losses and levels of gains based on the ATR (Average True Range).
4. Automatic reoptimization: At certain time periods (configurable), the bot re-optimizes the parameters of the MAs to adapt to the changing conditions of the market.
5. Trailing Stop: Implement different types of Trailing Stops (Simple and Moral Expectation) to ensure profits and protect against losses.
6. Training schedules: It can be configured so as not to operate on certain days of the week or at specific hours.
7. Completion and clearing: The robot performs proper cleaning and closing operations of all operations open when stopping.
In summary, this trading robot is a complex implementation that combines technical analysis (crossing of MAs) with risk management strategies (Stops and Trailing Stops) and automated parameter optimization. It is designed to operate autonomously and is optimized to maximize the performance adjusted to risk in an automated trading environment.
The trailing stops used in the article and code are obtained from the article: Trailing stop in trading by Aleksej Poljakov.
Code
To use another Optimization Technique, you should change this part of the code:
   for(int fastPeriod = FastMAPeriodStart; fastPeriod <= FastMAPeriodStop; fastPeriod += FastMAPeriodStep)
     {
      for(int slowPeriod = SlowMAPeriodStart; slowPeriod <= SlowMAPeriodStop; slowPeriod += SlowMAPeriodStep)
        {
         double criterionValue = PerformBacktest(fastPeriod, slowPeriod, startBar);

         if(IsNewOptimal(criterionValue, bestCriterionValue, OptimizationCriterion))
           {
            bestCriterionValue = criterionValue;
            bestFastPeriod = fastPeriod;
            bestSlowPeriod = slowPeriod;
           }
        }
     }
To use another Strategy, you should change this part of the code (and its inputs):
double fastMA_curr[];
   double slowMA_curr[];
   double fastMA_prev[];
   double slowMA_prev[];

   ArraySetAsSeries(fastMA_curr, true);
   ArraySetAsSeries(slowMA_curr, true);
   ArraySetAsSeries(fastMA_prev, true);
   ArraySetAsSeries(slowMA_prev, true);

   int fastMA_current = iMA(_Symbol, 0, FastMAPeriod, 0, MODE_SMA, PRICE_CLOSE);
   int fastMA_previous = iMA(_Symbol, 0, FastMAPeriod, 1, MODE_SMA, PRICE_CLOSE);

   int slowMA_current = iMA(_Symbol, 0, SlowMAPeriod, 0, MODE_SMA, PRICE_CLOSE);
   int slowMA_previous = iMA(_Symbol, 0, SlowMAPeriod, 1, MODE_SMA, PRICE_CLOSE);


   CopyBuffer(fastMA_current, 0, 0, 2, fastMA_curr);
   CopyBuffer(slowMA_current, 0, 0, 2, slowMA_curr);
   CopyBuffer(fastMA_previous, 0, 0, 2, fastMA_prev);
   CopyBuffer(slowMA_previous, 0, 0, 2, slowMA_prev);

   double fastMA_previousFF = fastMA_prev[0];
   double slowMA_previousSS = slowMA_prev[0];
   double fastMA_currentFF = fastMA_curr[0];
   double slowMA_currentSS = slowMA_curr[0];

// Check for buy signal (fast MA crosses above slow MA)
   if(fastMA_previousFF < slowMA_previousSS && fastMA_currentFF > slowMA_currentSS)
     {
      // Close any existing sell positions
      if(PositionsTotal() > 0)
        {
         for(int i = PositionsTotal() - 1; i >= 0; i--)
           {
            if(PositionSelectByTicket(i))
              {
               if(PositionGetInteger(POSITION_TYPE) == POSITION_TYPE_SELL)
                 {
                  Print("Closing sell position: Ticket ", PositionGetInteger(POSITION_TICKET));
                  ClosePosition(PositionGetInteger(POSITION_TICKET));
                 }
              }
           }
        }

      // Open a buy position
      double openPrice = SymbolInfoDouble(_Symbol, SYMBOL_ASK);
      double atrMultiplier = ATRmultiplier;
      OpenPosition(ORDER_TYPE_BUY, openPrice, atrMultiplier);
     }

// Check for sell signal (fast MA crosses below slow MA)
   else
      if(fastMA_previousFF > slowMA_previousSS && fastMA_currentFF < slowMA_currentSS)
        {
         // Close any existing buy positions
         if(PositionsTotal() > 0)
           {
            for(int i = PositionsTotal() - 1; i >= 0; i--)
              {
               if(PositionSelectByTicket(i))
                 {
                  if(PositionGetInteger(POSITION_TYPE) == POSITION_TYPE_BUY)
                    {
                     Print("Closing buy position: Ticket ", PositionGetInteger(POSITION_TICKET));
                     ClosePosition(PositionGetInteger(POSITION_TICKET));
                    }
                 }
              }
           }

         // Open a sell position
         double openPrice = SymbolInfoDouble(_Symbol, SYMBOL_BID);
         double atrMultiplier = ATRmultiplier;
         OpenPosition(ORDER_TYPE_SELL, openPrice, atrMultiplier);

        }
   IndicatorRelease(fastMA_current);
   IndicatorRelease(slowMA_current);
   IndicatorRelease(fastMA_previous);
   IndicatorRelease(slowMA_previous);
  }
It's important to note that if you don't release indicators, the graph window will be filled up with them.
Difference with and without auto-optimization
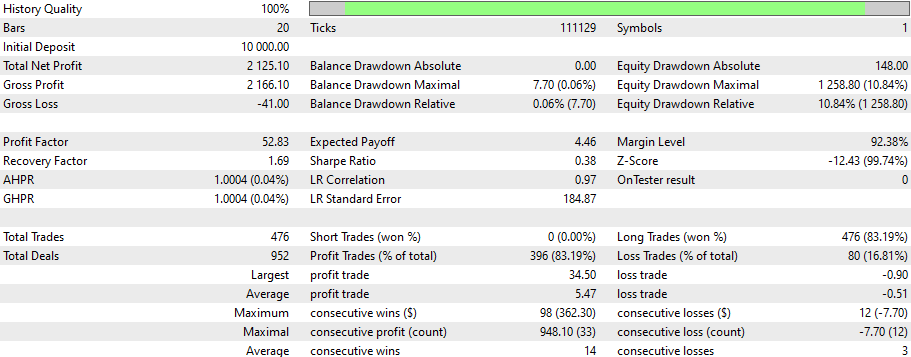
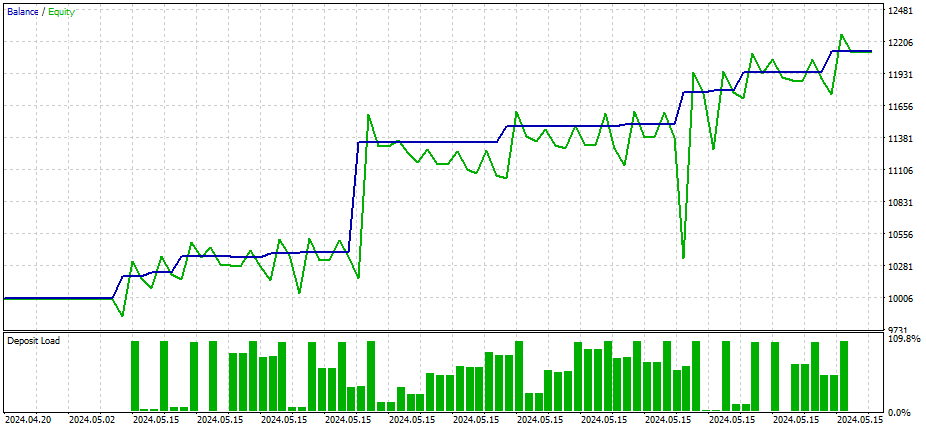
We will use the same period (from 20-4-2024 till 20-5-2024) for EURUSD and a time period of 1 day bars.

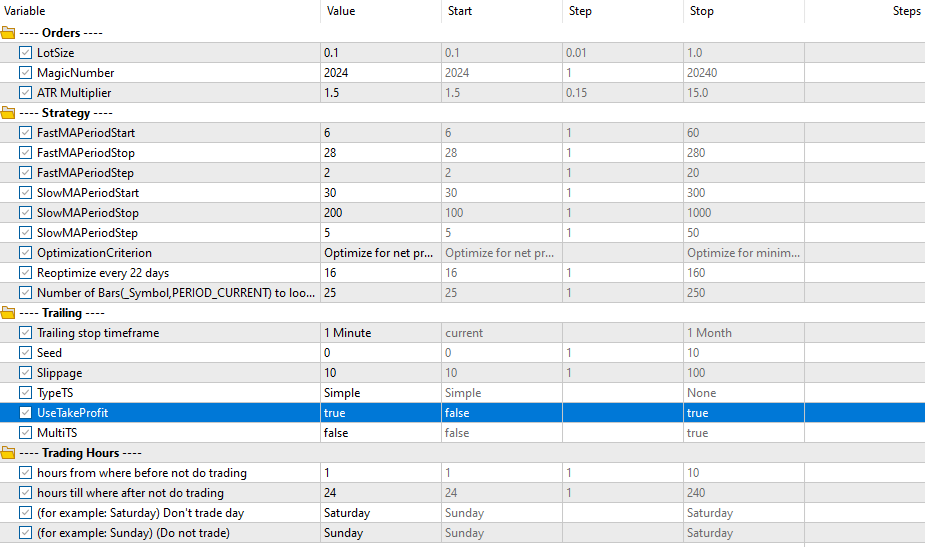
With optimization
Without auto-optimization
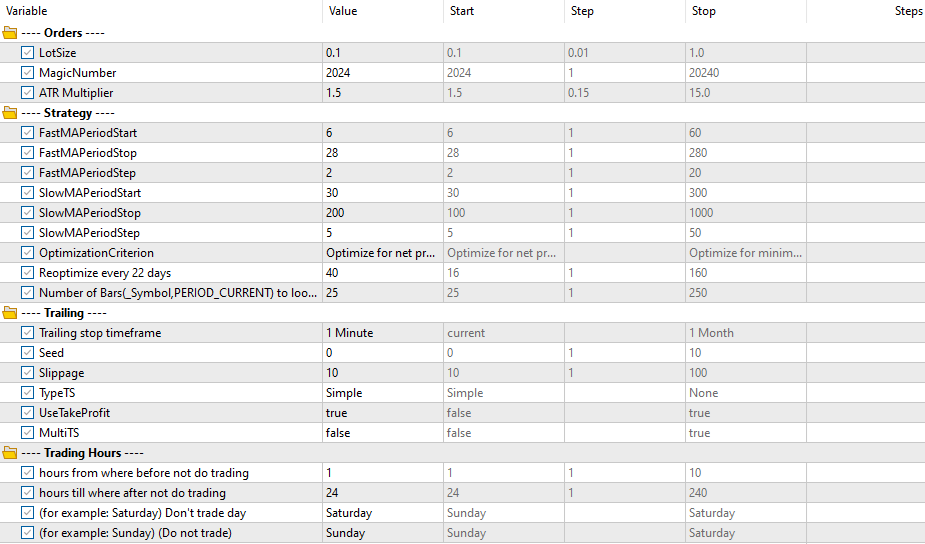
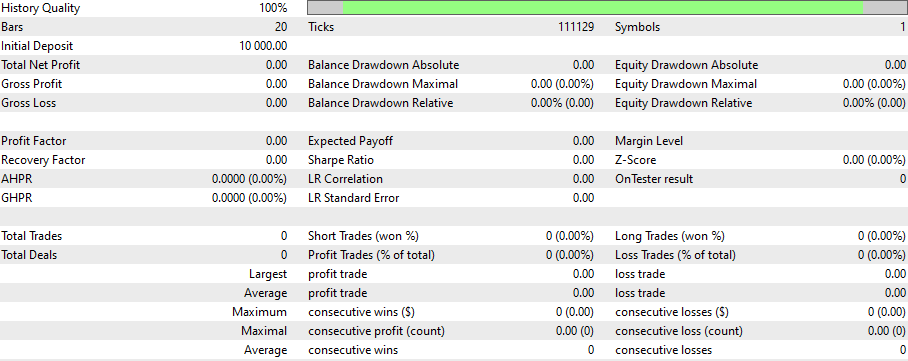
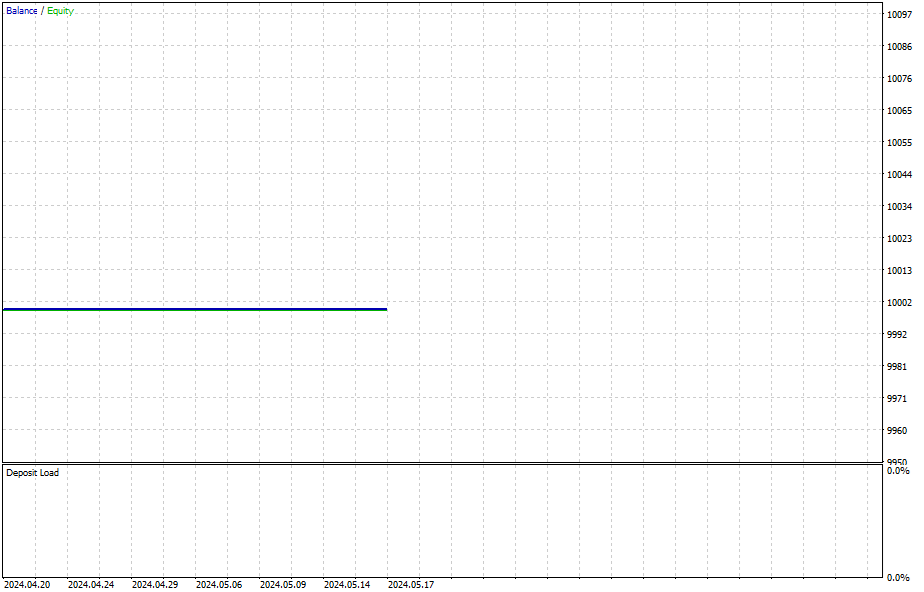
Clearly, it's a better solution to auto-optimize. No deals were done without auto-optimization. The first one was auto-optimized at the beginning, and then it had 40 days to reoptimize (out of the period).
Conclusion
Auto-optimization is crucial in ensuring the consistent and reliable performance of trading bots in the ever-changing financial markets. Through this article, readers have gained a comprehensive understanding of why self-optimization is essential, the various types of algorithms available for optimizing trading strategies and parameters, and the benefits and drawbacks of different parameter optimization techniques. The importance of Python as a tool for back-testing strategies quickly and efficiently was highlighted, along with a case study demonstrating parameter optimization using a Moving Average crossover strategy.
The article further explored the necessity of regular optimization based on market volatility, emphasizing the need for frequent adjustments to maintain effectiveness. An example of self-optimization using MQL5 illustrated the practical application of these concepts, showing the significant performance improvements achievable through auto-optimization. The comparison between auto-optimized and non-optimized bots underscored the clear advantages of the former, with optimized bots displaying superior adaptability and efficiency.
In conclusion, auto-optimization not only enhances the trading bot's performance but also provides traders with greater confidence and peace of mind, knowing their bot can navigate the complexities of the financial markets effectively. This strategic approach to trading bot development and maintenance is indispensable for anyone serious about achieving consistent and sustainable success in trading.
Books and educational resources
- "Advances in Financial Machine Learning" by Marcos López de Prado.
- "Algorithmic Trading and DMA" by Barry Johnson.
- "Python for Data Analysis" by Wes McKinney.
- "Machine Learning for Asset Managers" by Marcos López de Prado.
- "Quantitative Trading: How To Build Your Own Algorithmic Trading Business" by Ernest P.
 Propensity score in causal inference
 Developing Zone Recovery Martingale strategy in MQL5
 Developing a Replay System (Part 40): Starting the second phase (I)
 Mastering Market Dynamics: Creating a Support and Resistance Strategy Expert Advisor (EA)
- Free trading apps
- Over 8,000 signals for copying
- Economic news for exploring financial markets
You agree to website policy and terms of use
beautiful article, it is exactly what I was looking for to optimise parameters automatically while ea does its work.
Hi, thanks! Have you checked the number of days to reoptimize? (Settings->Reoptimize every 22 days-> use 16 (days) for the same example, sorry I have not explained well that setting option)
Hi, thanks! Have you checked the number of days to reoptimize? (Settings->Reoptimize every 22 days-> use 16 (days) for the same example, sorry I have not explained well that setting option)
Hi, yes I've tried that, but I will try again.
Thanks again!