
Mastering Market Dynamics: Creating a Support and Resistance Strategy Expert Advisor (EA)
Introduction
In this article, we will discuss the Support and Resistance forex trading strategy, in the context of pure price action trading, and the creation of an Expert Advisor (EA) based on it. We are going to explore the strategy's definition, types, description, and development in MetaQuotes Language 5 (MQL5) for MetaTrader 5 (MT5). We will not only discuss the theory behind the strategy, but also its respective concepts, analysis and identification, and visualization on the chart which will make it a useful tool for traders to learn to increase their ability to predict market moves, make better decisions, and eventually become proficient in risk management. Using the following subjects, we shall accomplish the above:
- Support and Resistance definition
- Support and Resistance description
- Types of Supports and Resistances
- Trading strategy description
- Trading strategy blueprint
- Implementation in MetaQuotes Language 5 (MQL5)
- Strategy tester results
- Conclusion
On this journey, we will extensively use MetaQuotes Language 5 (MQL5) as our base Integrated Development Environment (IDE) coding environment, and execute the files on the MetaTrader 5 (MT5) trading terminal. Thus, having the aforementioned versions will be of prime importance. Let's get started then.
Support and Resistance definition
The support and resistance forex trading strategy is a fundamental analysis tool that is used by many forex traders to analyze and identify price levels that the market is more likely to either pause or reverse. Technically, these levels have a tendency to be rejected by historical prices, which makes the levels significant over time as price pauses and reverses once on them, hence their name support and resistance. Where these levels are constructed, typically price bouncing off the key levels multiple times, indicates a strong buying or selling interest.
Support and Resistance description
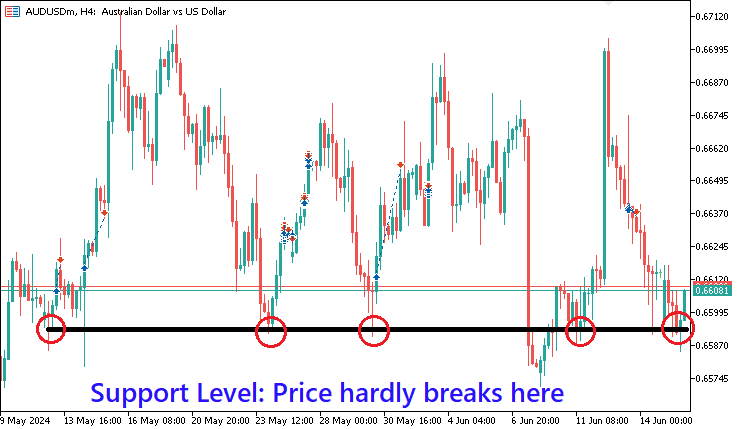
The description of the Support and Resistance strategy revolves around its application in trading scenarios. Support levels typically indicate a lower boundary that the price struggles to break through, suggesting a concentration of demand, while resistance levels represent an upper boundary indicative of a concentration of supply. Buyers typically enter the market at support levels, and prices are likely to rise, therefore it is a good time for traders to think about buying or going long. On the other hand, sellers enter the mix at resistance levels, and prices may drop, allowing traders to sell or go short. Here is a visualization of what we mean.
Market entry is always dynamic and depends on one's taste and preference, though there are two basic ways of trading the levels. Some traders prefer to trade the bounce by buying when the price falls towards support levels and selling when the price rises towards resistance levels. Conversely, other traders prefer to trade the break by buying when the price breaks up through resistance levels and selling when the price breaks down through support levels. Hence, one can either Fade the Break or Trade the Break.
Types of Supports and Resistances
There are four types of support and resistance levels.
- Round numbers support and resistance levels: These levels are formed by price bouncing off a level of the same price, leading to a horizontal price channel. For example, the swing lows of a market could have the same level of 0.65432, 0.65435, and 0.65437. Typically, these are the same levels, with a negligible declination angle, an indication of price demand concentration.
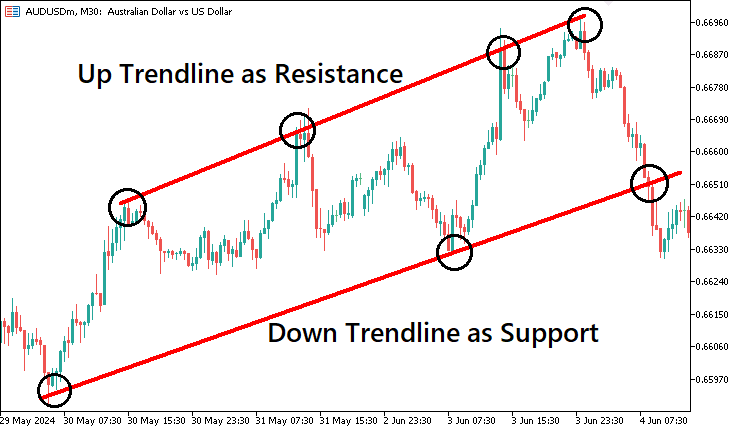
- Trendline channel support and demand levels: Swing points formed by upward trendlines or downward trendlines create supply and demand zones that prices tend to react to.
- Fibonacci support and resistance levels: Fibonacci is used by traders to identify price reversal zones, and these zones tend to act as supply and demand zones for the support and resistance levels.
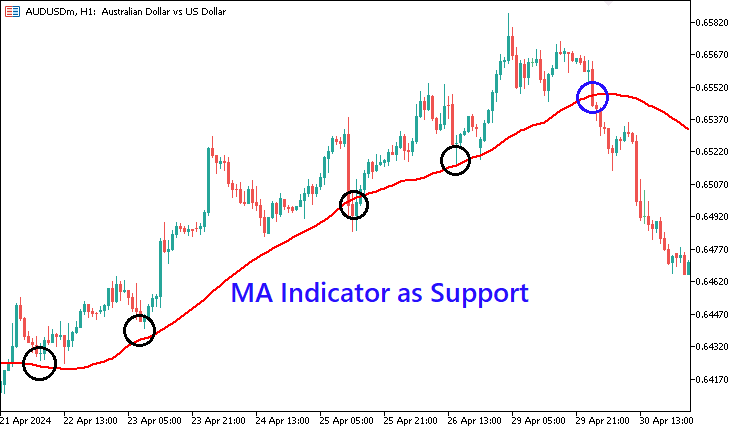
- Indicator support and resistance levels: Technical indicators such as moving averages provide zones where prices tend to react to creating pivots for support and resistance levels.
Trading strategy description
As we have seen, there are different types of support and resistance strategies in the forex realm. For the article, we are going to choose and work with the horizontal round numbers type, and then the same concept can be employed and adapted for the other types.
First, we will analyze the chart and get the support and resistance coordinates. Once the respective coordinates are pinpointed, we will then draw the levels on the chart. Again, we did see that every trader has two options to trade the levels, that is, fade or trade the break. In our case, we will fade the break. We will open buy positions when we break the supports and open sell positions when we break the resistance levels. As simple as that.
Trading strategy blueprint
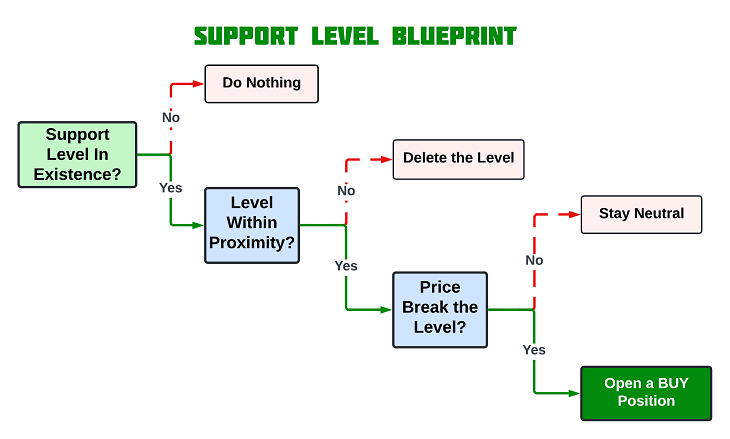
To easily understand the concept that we have relayed, let us visualize it in a blueprint.
- Resistance Level:
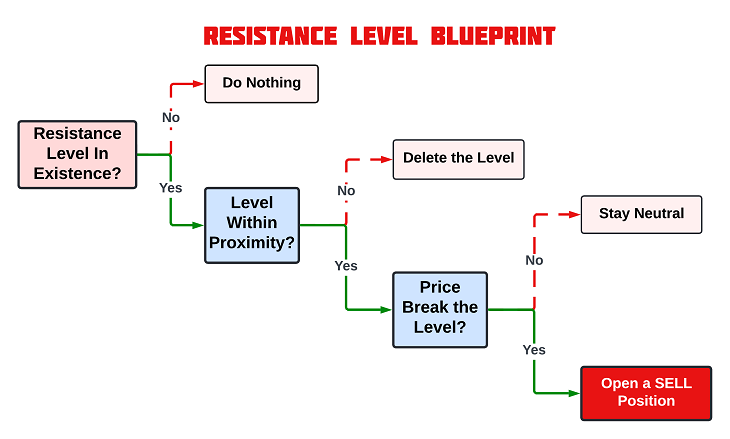
- Support Level:
Implementation in MetaQuotes Language 5 (MQL5)
After learning all the theories about the Support and Resistance trading strategy, let us then automate the theory and craft an Expert Advisor (EA) in MetaQuotes Language 5 (MQL5) for MetaTrader 5 (MT5).
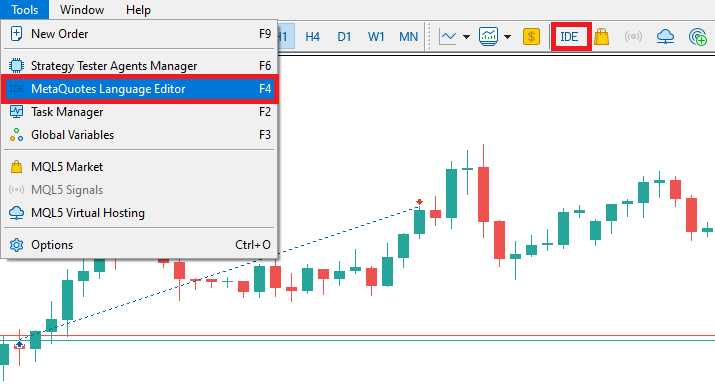
To create an expert advisor (EA), on your MetaTrader 5 terminal, click the Tools tab and check MetaQuotes Language Editor, or simply press F4 on your keyboard. Alternatively, you can click the IDE (Integrated Development Environment) icon on the tools bar. This will open the MetaQuotes Language Editor environment, which allows the writing of trading robots, technical indicators, scripts, and libraries of functions.
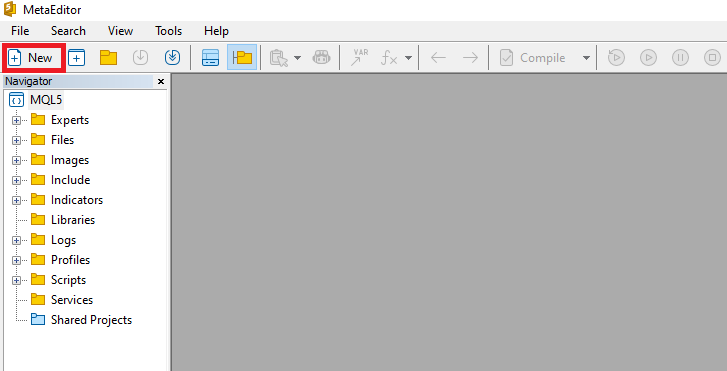
Once the MetaEditor is opened, on the tools bar, navigate to the File tab and check New File, or simply press CTRL + N, to create a new document. Alternatively, you can click on the New icon on the tools tab. This will result in a MQL Wizard pop-up.
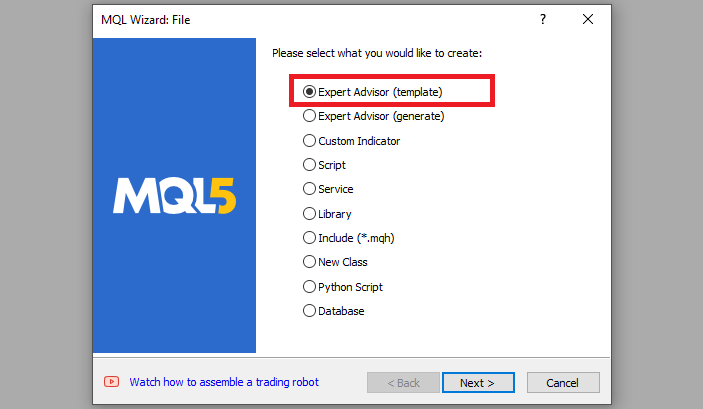
On the Wizard that pops, check Expert Advisor (template) and click Next.
On the general properties of the Expert Advisor, under the name section, provide your expert's file name. Note that to specify or create a folder if it doesn't exist, you use the backslash before the name of the EA. For example, here we have "Experts\" by default. That means that our EA will be created in the Experts folder and we can find it there. The other sections are pretty much straightforward, but you can follow the link at the bottom of the Wizard to know how to precisely undertake the process.
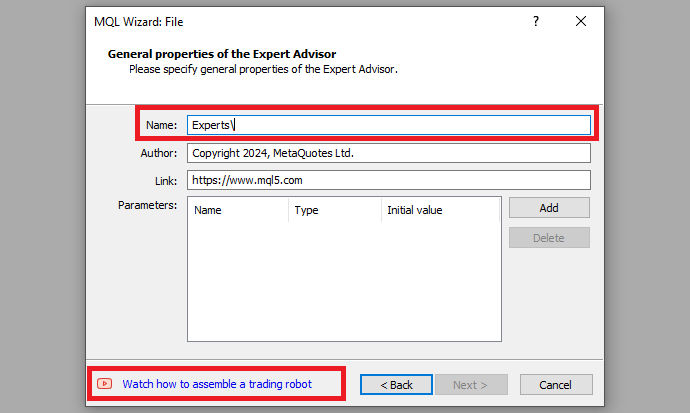
After providing your desired Expert Advisor file name, click on Next, click Next, and then click Finish. After doing all that, we are now ready to code and program our strategy.
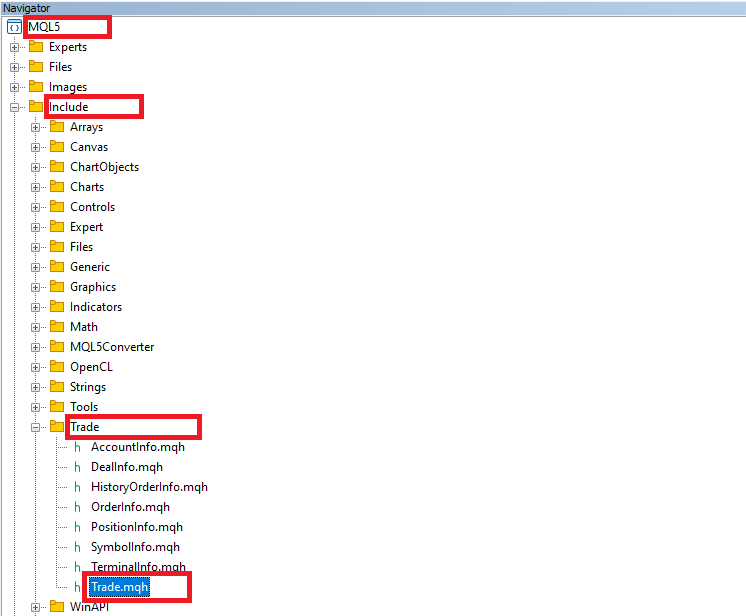
First, we include a trade instance by using #include at the beginning of the source code. This gives us access to the CTrade class, which we will use to create a trade object. This is crucial as we need it to open trades.
#include <Trade/Trade.mqh>
CTrade obj_Trade;
The preprocessor will replace the line #include <Trade/Trade.mqh> with the content of the file Trade.mqh. Angle brackets indicate that the Trade.mqh file will be taken from the standard directory (usually it is terminal_installation_directory\MQL5\Include). The current directory is not included in the search. The line can be placed anywhere in the program, but usually, all inclusions are placed at the beginning of the source code, for a better code structure and easier reference. Declaration of the obj_Trade object of the CTrade class will give us access to the methods contained in that class easily, thanks to the MQL5 developers.
On the global scope, we need to define arrays that will hold our highest and lowest prices data, which we will later manipulate and analyze to find the support and resistance levels. After the levels are found, we need to also store them in an array, since they will, of course, be more than one.
double pricesHighest[], pricesLowest[];

double resistanceLevels[2], supportLevels[2];
Here, we declare two double arrays that will hold the highest and lowest prices for a stipulated amount of data, and some extra two that will hold the identified and sorted support and resistance levels data. That is typically the two coordinates of each level. Note that, the price variables are empty, which makes them dynamic arrays without a predefined size, which means they can hold an arbitrary number of elements based on the data provided. On the contrary, the level variables have a fixed size of two, which makes them static arrays, meaning they can hold exactly two elements each. If you intend to use more coordinates, you can increase their size to the specific number of points you deem fit.
Finally, once we identify the levels, we will need to plot them on the chart for visualization purposes. Thus, we have to define the line names, their respective assigned colors, and their respective prefixes for easier identification and uniqueness, in case there are several experts on the same trading account. This enables the EA to be compatible with other EAs, as it will identify its levels and work with them effectively and independently.
#define resLine "RESISTANCE LEVEL"
#define colorRes clrRed
#define resline_prefix "R"

#define supLine "SUPPORT LEVEL"
#define colorSup clrBlue
#define supline_prefix "S"
We use the #define keyword to define a macro named "resLine" with the value "RESISTANCE LEVEL" to easily store our resistance level name, instead of having to repeatedly retype the name on every instance we create the level, significantly saving us time and reducing the chances of wrongly providing the name. So basically, macros are used for text substitution during compilation.
Similarly, we define the color of the resistance level as red and finally define the prefix "R" for resistance levels, which we will use to label and identify resistance lines on the chart. Similar to resistance levels, we define the support levels, following the same criteria.
Once we initialize the EA, we need to set our data in a time series, so we will work with the latest data first, and prepare our storage arrays to hold our data. This is done on the OnInit event handler.
//+------------------------------------------------------------------+
//| Expert initialization function                                   |
//+------------------------------------------------------------------+
int OnInit(){
//---

   ArraySetAsSeries(pricesHighest,true);
   ArraySetAsSeries(pricesLowest,true);
   // define the size of the arrays
   ArrayResize(pricesHighest,50);
   ArrayResize(pricesLowest,50);
//---
   return(INIT_SUCCEEDED);
}
Two distinct things occur. First, we set our price storage arrays as time series using the ArraySetAsSeries MQL5 built-in function, which takes two arguments, the target array and the boolean flag, true in this case to accept the conversion. This means that the arrays will be indexed with the oldest data at the highest index and the most recent data at index 0. Here is an example. Say we retrieve data from 2020 to 2024. Here is the format we receive the data in.
| Year | Data |
|---|---|
| 2020 | 0 |
| 2021 | 1 |
| 2022 | 2 |
| 2023 | 3 |
| 2024 | 4 |
Data in the above format is not convenient to use since it is arranged in chronological order where the oldest data is indexed at the first index, meaning it is used being the first. It is more convenient to use the latest data for analysis first, and thus, we need to arrange the data in reverse chronological order to achieve results as below.
| Year | Data |
|---|---|
| 2024 | 4 |
| 2023 | 3 |
| 2022 | 2 |
| 2021 | 1 |
| 2020 | 0 |
To achieve the above format programmatically, we make use of the ArraySetAsSeries function, as earlier explained. Second, we define the size of the arrays by using the ArrayResize function, and specifying they hold fifty elements each. This could be anything, just an arbitrary value that we did take, and you can choose to ignore it. However, for formality, we don't need too much data in our arrays since we plan to sort the received price data to have only the first ten most significant data, and the extra size will be reserved. So you can see why it doesn't make sense to have a larger size in our arrays.
On the OnDeinit event handler, we need to get rid of the storage data that had been in use from the computer memory. This will help save the resources.
//+------------------------------------------------------------------+
//| Expert deinitialization function                                 |
//+------------------------------------------------------------------+
void OnDeinit(const int reason){
//---
   ArrayFree(pricesHighest);
   ArrayFree(pricesLowest);

   //ArrayFree(resistanceLevels); // cannot be used for static allocated array
   //ArrayFree(supportLevels); // cannot be used for static allocated array

   ArrayRemove(resistanceLevels,0,WHOLE_ARRAY);
   ArrayRemove(supportLevels,0,WHOLE_ARRAY);
}
We use the ArrayFree function to get rid of the data that occupies some computer memory since the EA will no longer be in use, and the data will be useless. The function is a void data type that takes just a single parameter or argument, the dynamic array, and frees up its buffer, and sets the size of the zero dimension to 0. However, for the static arrays, where we store support and resistance prices, the function cannot be used. This does not mean we cannot get rid of the data. We call another function ArrayRemove, to remove the data we want to discard. The function is a boolean data type that takes three arguments to remove a specified number of elements from an array. We specify the target array variable and provide the index from which the removal operation commences, in our case, it is zero since we want to remove everything, and finally the number of elements to remove, in this case, the whole array to get rid of everything.
Most of our activities will be executed on the OnTick event handler. This will be pure price action and we will heavily rely on this event handler. Thus, let us have a look at the parameters the function takes beside it since it is the heart of this code.
void OnTick(){
//---

}
As it is already seen, this is a simple yet crucial function that does not take any arguments or return anything. It is just a void function, meaning it does not have to return anything. This function is used in Expert Advisors and is executed when there is a new tick, that is, a change in price quotes for the particular commodity.
Now that we have seen that the OnTick function is generated on every change in price quotes, we need to define some control logic that will enable us to run the code to be executed once per bar and not on every tick, at least to avoid unnecessary code runs, hence saving the device memory. That will be necessary when looking for support and resistance levels. We don't need to search for the levels on each tick, yet we will always get the same results, provided we are still on the same candlestick. Here is the logic:
   int currBars = iBars(_Symbol,_Period);
   static int prevBars = currBars;
   if (prevBars == currBars) return;
   prevBars = currBars;
First, we declare an integer variable "currBars" which stores the calculated number of current bars on the chart for the specified trading symbol and period or rather timeframe as you might have heard it. This is achieved by the use of the iBars function, which takes just two arguments, that is, symbol and period.
Then, we declare another static integer variable "prevBars" to store the total number of previous bars on the chart when a new bar is generated and initialize it with the value of current bars on the chart for the first run of the function. We will use it to compare the current number of bars with the previous number of bars, to determine the instance of a new bar generation on the chart.
Finally, we use a conditional statement to check whether the current number of bars is equal to the previous number of bars. If they are equal, it means that no new bar has formed, so we terminate further execution and return. Otherwise, if the current and previous bar counts are not equal, it indicates that a new bar has formed. In this case, we proceed to update the previous bars variable to the current bars, so that on the next tick, it will be equal to the number of the bars on the chart not unless we graduate to a new one.
The bars to be considered for analysis are only the visible bars on the chart. This is because we do not need to consider the oldest data for like ten million bars, since it would be useless. Just imagine the instance where you have a support level that dates way back to the previous year. Doesn't make sense right? So now, we just consider the bars that are visible on the chart only, since it is the most recent viable data to the current market conditions. To do this, we use the logic below.
int visible_bars = (int)ChartGetInteger(0,CHART_VISIBLE_BARS);
We declare an integer variable visible_bars and use the ChartGetInteger function to get the total visible bars on the chart. It is a long data type function and thus we typecast it into an integer by adding (int) before the function. We could of course define our target variable as long, but we don't need to allocate such high memory bytes.
To search for the levels, we'll have to loop via each bar. A for loop is essential to achieve this.
   for (int i=1; i<=visible_bars-1; i++){
   ...

   }
The loop is done by first initializing the loop counter integer variable i to one, to designate the starting point of the loop. One signifies that we start at the bar before the current bar since the current bar is in the formation stage and thus is still undecided. It can result in anything. Following is the condition that must be true for the loop to continue running. As long as i is less than or equal to the total bars being considered minus one, the loop will keep executing. Lastly, we increment the loop counter "i" by one each time the loop runs. Simply, the i++ is the same as i=i+1. We could also use a decrementing loop that would have the loop counter operator --, leading to an analysis that starts with the oldest last bar to the current bar, but we choose to have an incrementing loop so that bar analysis starts from the most recent bar to the oldest bar.
On each loop, we select a bar or candlestick, and thus we need to get the bar properties. In this case, only the bar's open, high, low, close, and time properties are important to us.
      double open = iOpen(_Symbol,_Period,i);
      double high = iHigh(_Symbol,_Period,i);
      double low = iLow(_Symbol,_Period,i);
      double close = iClose(_Symbol,_Period,i);
      datetime time = iTime(_Symbol,_Period,i);
Here, we declare the respective data type variables and initialize them to the corresponding data. For example, use the iOpen function to get the open price of the bar, by providing the symbol name of the financial instrument, its period, and index of the target bar.
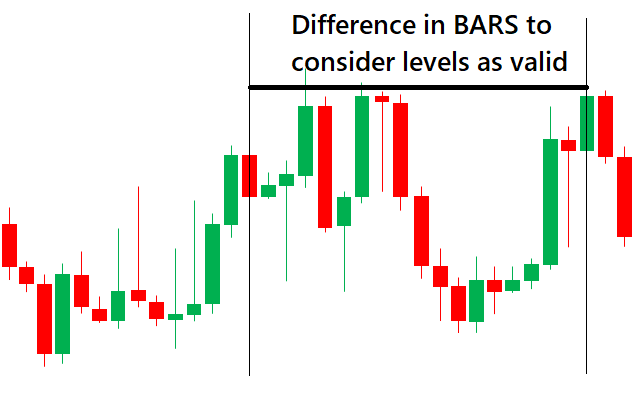
After getting the bar's data, we then will need to check the data against the rest of the preceding bars to find a bar that has the same data as the selected one, which will signify a level that price has reacted to severally in the past. However, it doesn't make any sense to have a support or resistance level that comprises two consecutive levels. The levels should at least be far apart. Let us first define this.
int diff_i_j = 10;
We define an integer variable that will hold the difference in bars between the current bar and the bar that should be considered for the checking of a match of the same level. In our case, it is 10. Visually represented, here is what we mean.
Now we can initiate a loop that incorporates the logic.
      for (int j=i+diff_i_j; j<=visible_bars-1; j++){
      ...

      }
For the inner for loop, we use counter integer variable j which starts at ten bars from the current bar and goes up to the second-to-last bar. To easily understand this and be comfortable with the results before we proceed, let us visualize it by printing the output.
//Print in the outer loop
      Print(":: BAR NO: ",i);

      //Print in the inner loop
         Print("BAR CHECK NO: ",j);
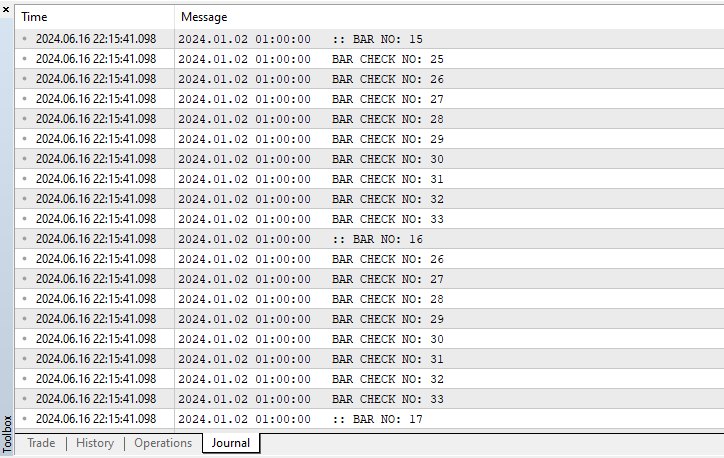
You can see that for example, for a selected bar at index 15, we initialize the loop 10 bars from the currently selected bar. Mathematically, that is 15+10=25. Then from the 25th bar, the loop executes up to the second-to-last bar, which is 33 in our case.
Now that we can correctly select the interval of the bars as needed, we can get the properties of the selected bars too.
         double open_j = iOpen(_Symbol,_Period,j);
         double high_j = iHigh(_Symbol,_Period,j);
         double low_j = iLow(_Symbol,_Period,j);
         double close_j = iClose(_Symbol,_Period,j);
         datetime time_j = iTime(_Symbol,_Period,j);
The same logic as of the outer loop property retrieval is considered. The only difference is that we define our variables with an extra underscore j to signify that the properties are for the inner for loop and the target index of the bar changes to j.
Since we now have all the needed price data, we can proceed to check for the support and resistance levels.
         // CHECK FOR RESISTANCE
         double high_diff = NormalizeDouble((MathAbs(high-high_j)/_Point),0);
         bool is_resistance = high_diff <= 10;

         // CHECK FOR SUPPORT
         double low_diff = NormalizeDouble((MathAbs(low-low_j)/_Point),0);
         bool is_support = low_diff <= 10;
To check for resistance levels, we define a double variable high_diff that will store our data for the difference between the high of the currently selected bar in the outer loop and the bar that is currently selected in the inner loop. MathAbs function is used to ensure that the result is a positive number regardless of which price is higher, by returning the absolute or modulus value of the input. For example, we could have 0.65432 - 0.05456 = -0.00024. Our answer contains a negative, but the function will ignore the negative sign and output 0.00024. Again, divide the result by the point, the smallest possible price change of an instrument, to get the point form of the difference. Using our example again, this would be 0.00024/0.00001 = 24.0. Finally, just to be precise, we format the floating point number to a specified number of digits by use of the NormalizeDouble function. In this case, we have zero, which means that our output will be a whole number. Using our example again, we would have 24 without the decimal point.
We then check if the difference is less than or equal to ten, a predefined range in which the difference is allowable, and store the result in a boolean variable is_resistance. The same logic applies to the support level checkup.
If our levels' conditions are met, our support and resistance levels will be true, otherwise they will be false. To see if we can identify the levels, let us print them to the journal. To counter-check everything, we print the prices of the resistance level coordinates, alongside their price differences to ascertain that they fulfill our conditions.
         if (is_resistance){
            Print("RESISTANCE AT BAR ",i," (",high,") & ",j," (",high_j,"), Pts = ",high_diff);
          ...
         }
Here is the result that we get.
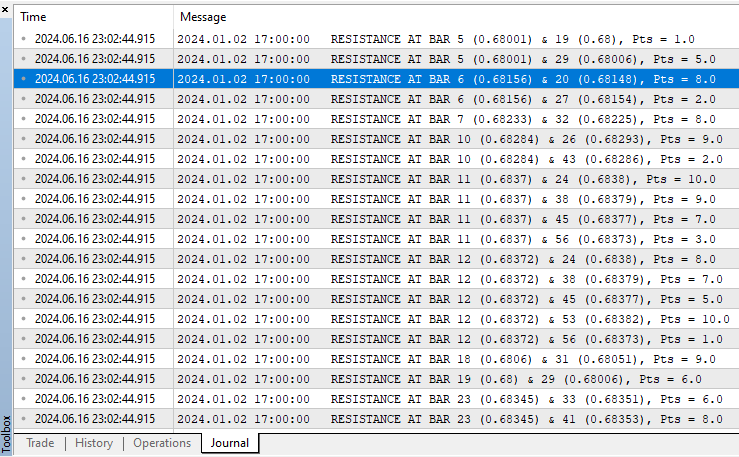
We can identify the levels, but they are just any levels. Since we want levels that are at the highest or lowest points, we will need some extra control logic to ensure that we only consider the most significant levels. To achieve this, we will need to copy the high and the low prices of the bars under consideration, sort them in ascending and descending order respectively, and then take the first and the last amount of needed bars respectively. We do this before the for loops.
   ArrayFree(pricesHighest);
   ArrayFree(pricesLowest);

   int copiedBarsHighs = CopyHigh(_Symbol,_Period,1,visible_bars,pricesHighest);
   int copiedBarsLows = CopyLow(_Symbol,_Period,1,visible_bars,pricesLowest);
Before the storage, we free our arrays of any data. We then copy the highs of the bars to the target array. This is achieved via the use of the CopyHigh integer data type function, by providing the symbol, period, starting index of the bar to be copied, the number of bars, and the target storage array. The result, which is the amount of bars copied, is assigned to the integer variable copiedBarsHighs. The same is done for the low prices. To make sure we get the data, we print the arrays to the journal, by use of the ArrayPrint function.
   ArrayPrint(pricesHighest);
   ArrayPrint(pricesLowest);
These are the results that we get.
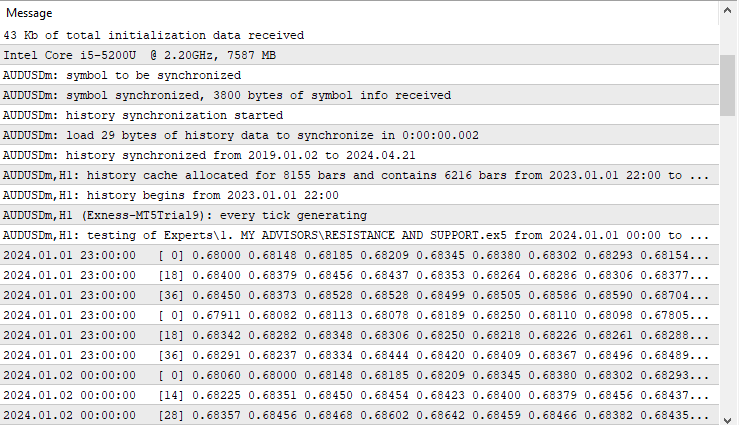
We then sort the data in ascending order by use of the ArraySort function and print the results again.
         // sort the array in ascending order
   ArraySort(pricesHighest);
   ArraySort(pricesLowest);

   ArrayPrint(pricesHighest);
   ArrayPrint(pricesLowest);
Here is what we get.
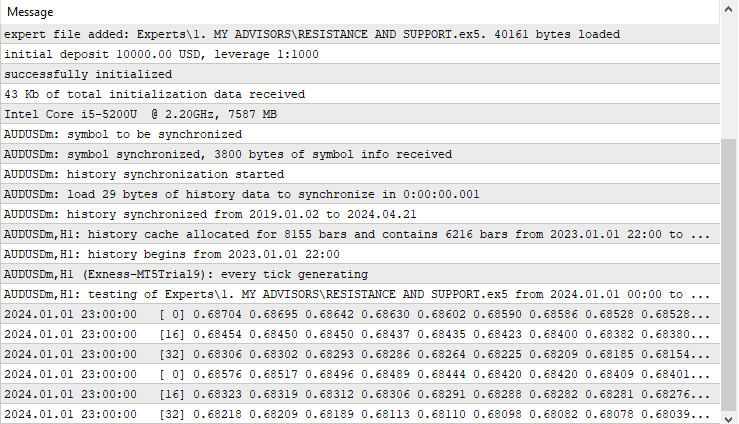
Finally, we need to get the first ten prices: the high prices, and the last ten prices of the low prices, data which will form our extreme points.
ArrayRemove(pricesHighest,10,WHOLE_ARRAY);
To get the first ten high prices of the highest bars, we use the ArrayRemove function, and provide the target array, index where the removal starts from, in our case ten, and finally the number of elements to be removed, in our case the rest of the data.
To get the last ten low prices of the lowest bars, a similar operation is undertaken, but with a more complex and less straightforward method.
ArrayRemove(pricesLowest,0,visible_bars-10);
We use the same function, but our start index is zero since we are not interested in the first values, and the count is the total number of bars under consideration minus ten. When we print the data, we get the following output.
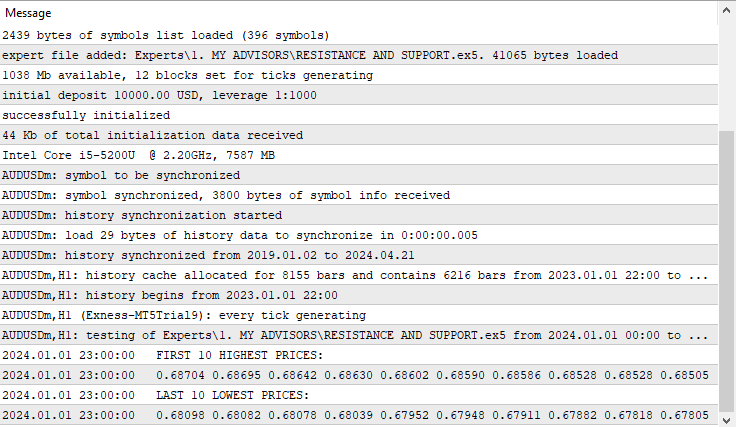
Since we now have the data for the highest bars, we can continue to check the levels against and determine the valid setups. We initiate another for loop to do the operation.
            for (int k=0; k<ArraySize(pricesHighest); k++){
            ...
            }
This time, our counter variable k starts from zero since we want to consider all the prices in the array.
Since we want to find the price matches, we declare boolean storage variables that will store the flags of the match results, outside the for loops, and initialize them to false.
   bool matchFound_high1 = false, matchFound_low1 = false;
   bool matchFound_high2 = false, matchFound_low2 = false;
If the selected stored price is equal to the high of the bar in the first loop, we set the flag for the first high found to true and inform of the instance. Similarly, if the elected stored price is equal to the high of the bar in the second loop, we set the flag for the second high found to true and inform of the instance.
               if (pricesHighest[k]==high){
                  matchFound_high1 = true;
                  Print("> RES H1(",high,") FOUND @ ",k," (",pricesHighest[k],")");
               }
               if (pricesHighest[k]==high_j){
                  matchFound_high2 = true;
                  Print("> RES H2(",high_j,") FOUND @ ",k," (",pricesHighest[k],")");
               }
If the match for the two coordinates is found but the current resistance levels are equal to the prices, it then means we already have the levels. So we don't need to proceed creating more resistance levels. We inform of the instance, set the stop_processing flag to true, and break out of the loop prematurely.
               if (matchFound_high1 && matchFound_high2){
                  if (resistanceLevels[0]==high || resistanceLevels[1]==high_j){
                     Print("CONFIRMED BUT This is the same resistance level, skip updating!");
                     stop_processing = true; // Set the flag to stop processing
                     break; // stop the inner loop prematurely
                  }
                  ...

               }
The stop_processing flag is defined outside the for loops in the upper part, and incorporated in the first for loop execution logic, to ensure that we save resources.
   bool stop_processing = false; // Flag to control outer loop

//...
   for (int i=1; i<=visible_bars-1 && !stop_processing; i++){
      ...

   }
Otherwise, if the match for the two coordinates is found but they do not equal the current prices, it means that we have another new resistance level and we can update it to the latest data.
                  else {
                     Print(" ++++++++++ RESISTANCE LEVELS CONFIRMED @ BARS ",i,
                     "(",high,") & ",j,"(",high_j,")");
                     resistanceLevels[0] = high;
                     resistanceLevels[1] = high_j;
                     ArrayPrint(resistanceLevels);

                     ...
                  }
Here is the visualization of the results we get.
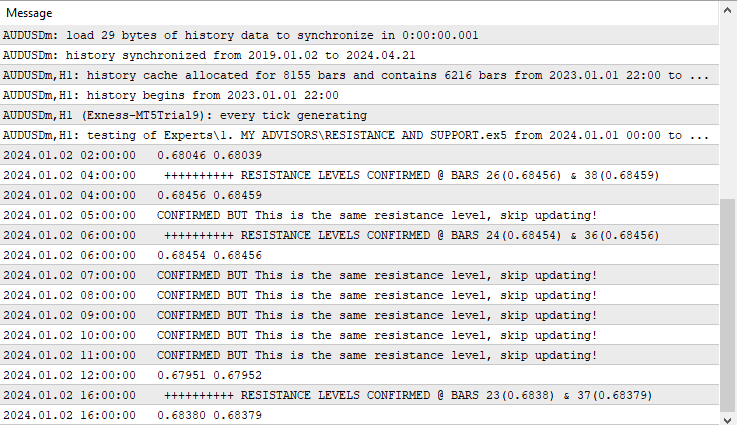
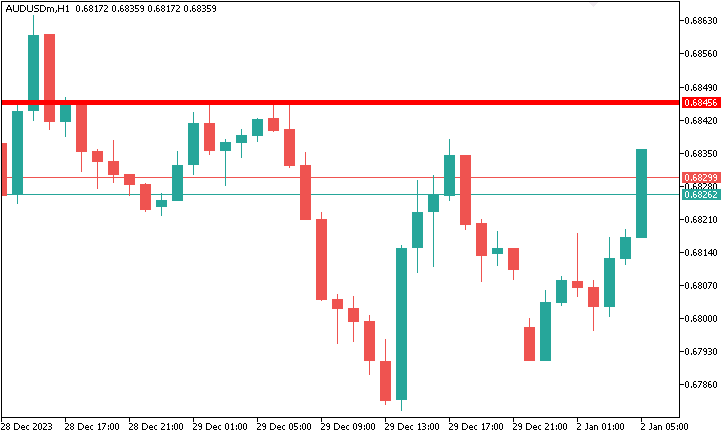
To visualize the levels, let us map them to the chart.
                     draw_S_R_Level(resLine,high,colorRes,5);
                     draw_S_R_Level_Point(resline_prefix,high,time,218,-1,colorRes,90);
                     draw_S_R_Level_Point(resline_prefix,high,time_j,218,-1,colorRes,90);

                     stop_processing = true; // Set the flag to stop processing
                     break;
We use two functions for the job. The first function draw_S_R_Level takes the name of the line to be drawn, the price, the color, and the width of the line.
void draw_S_R_Level(string levelName,double price,color clr,int width){
   if (ObjectFind(0,levelName) < 0){
      ObjectCreate(0,levelName,OBJ_HLINE,0,TimeCurrent(),price);
      ObjectSetInteger(0,levelName,OBJPROP_COLOR,clr);
      ObjectSetInteger(0,levelName,OBJPROP_WIDTH,width);
   }
   else {
      ObjectSetDouble(0,levelName,OBJPROP_PRICE,price);
   }
   ChartRedraw(0);
}
The function is a void data type meaning it doesn't have to return anything. We then use a conditional statement to check whether the object does exist by use of the ObjectFind function, which returns a negative integer in case the object is not found. If that is the case, we proceed to create the object identified as OBJ_HLINE, to the current time and the specified price, since it requires just a single coordinate. We then set its color and width. If the object is found, we just update its price to the specified price and redraw the chart for the current changes to apply. This function only draws a plain line on the chart. Here is what we get.
void draw_S_R_Level_Point(string objName,double price,datetime time,
      int arrowcode,int direction,color clr,double angle){
   //objName = " ";
   StringConcatenate(objName,objName," @ \nTime: ",time,"\nPrice: ",DoubleToString(price,_Digits));
   if (ObjectCreate(0,objName,OBJ_ARROW,0,time,price)) {
      ObjectSetInteger(0,objName,OBJPROP_ARROWCODE,arrowcode);
      ObjectSetInteger(0,objName,OBJPROP_COLOR,clr);
      ObjectSetInteger(0,objName,OBJPROP_FONTSIZE,10);
      if (direction > 0) ObjectSetInteger(0,objName,OBJPROP_ANCHOR,ANCHOR_TOP);
      if (direction < 0) ObjectSetInteger(0,objName,OBJPROP_ANCHOR,ANCHOR_BOTTOM);
   }
   string prefix = resline_prefix;
   string txt = "\n"+prefix+"("+DoubleToString(price,_Digits)+")";
   string objNameDescription = objName + txt;
   if (ObjectCreate(0,objNameDescription,OBJ_TEXT,0,time,price)) {
     // ObjectSetString(0,objNameDescription,OBJPROP_TEXT, "" + txt);
      ObjectSetInteger(0,objNameDescription,OBJPROP_COLOR,clr);
      ObjectSetDouble(0,objNameDescription,OBJPROP_ANGLE, angle);
      ObjectSetInteger(0,objNameDescription,OBJPROP_FONTSIZE,10);
      if (direction > 0) {
         ObjectSetInteger(0,objNameDescription,OBJPROP_ANCHOR,ANCHOR_LEFT);
         ObjectSetString(0,objNameDescription,OBJPROP_TEXT, "    " + txt);
      }
      if (direction < 0) {
         ObjectSetInteger(0,objNameDescription,OBJPROP_ANCHOR,ANCHOR_BOTTOM);
         ObjectSetString(0,objNameDescription,OBJPROP_TEXT, "    " + txt);
      }
   }
   ChartRedraw(0);
}
The custom function " draw_S_R_Level_Point " takes seven parameters to ease its re-usability. The functions of the parameters are as follows:
- objName: A string representing the name of the graphical object to be created.
- price: A double value representing the price coordinate where the object should be placed.
- time: A datetime value indicating the time coordinate where the object should be placed.
- arrowCode: An integer specifying the arrow code for the arrow object.
- direction: An integer indicating the direction (up or down) for positioning the text label.
- clr: A color value (e.g., clrBlue, clrRed) for the graphical objects.
- angle: Orientation angle of the description label.
The function first concatenates the name of the object with time and price for the distinction of the level points. This ensures that when we hover over the label, there is a pop-up of the description with the specific unique time and price of the coordinate.
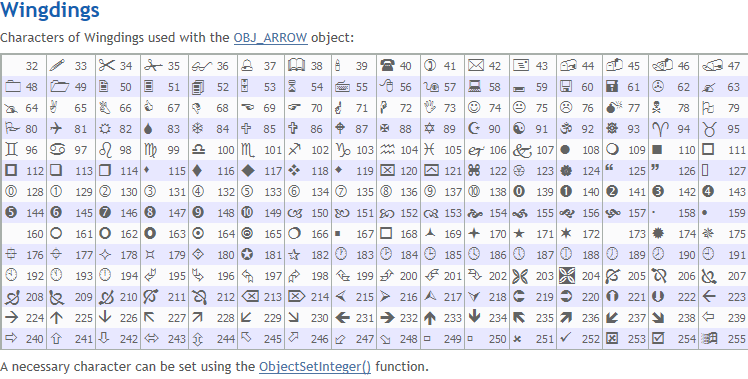
The function then checks whether an object with the specified objName already exists on the chart. If not, it proceeds to create the objects. The creation of the object is achieved by the use of the in-built "ObjectCreate" function, which requires specification of the object to be drawn, in this case, the arrow object identified as "OBJ_ARROW", as well as the time and price, which forms the ordinates of the object creation point. Afterward, we set the object properties arrow code, color, font size, and anchoring point. For the arrow code, MQL5 has some already predefined characters of the Wingdings font that can be directly used. Here is a table specifying the characters:
Up to this point, we only draw the specified arrow to the chart as follows:
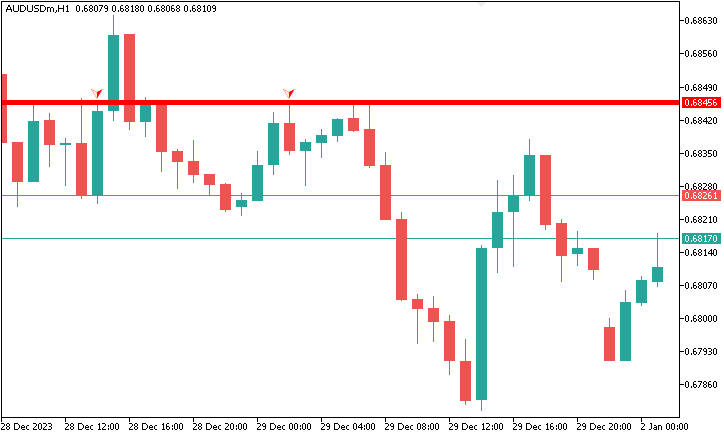
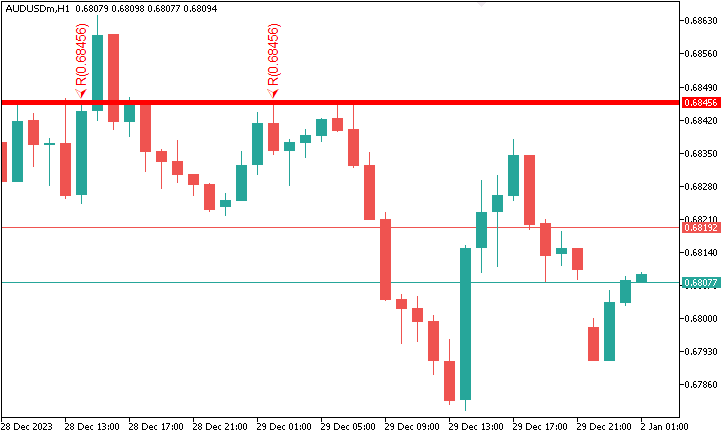
We can see that we managed to draw the resistance points with the specified arrow code, in this case, we used arrow code 218, but there is no description of them. Therefore, to add the respective description, we proceed to concatenate the arrow with a text. We create another text object specified as "OBJ_TEXT" and set its respective properties as well. The text label serves as a descriptive annotation associated with the resistance points, by providing additional context or information about the resistance points, making them more informative for traders and analysts. We choose the value of the text to be a specified price, signifying that it is a resistance point.
The variable "objNameDescription" is then created by concatenating the original "objName" with the descriptive text. This combined name ensures that the arrow and its associated text label are linked together. This specific code snippet is used to achieve that.
   string prefix = resline_prefix;
   string txt = "\n"+prefix+"("+DoubleToString(price,_Digits)+")";
   string objNameDescription = objName + txt;
   if (ObjectCreate(0,objNameDescription,OBJ_TEXT,0,time,price)) {
     // ObjectSetString(0,objNameDescription,OBJPROP_TEXT, "" + txt);
      ObjectSetInteger(0,objNameDescription,OBJPROP_COLOR,clr);
      ObjectSetDouble(0,objNameDescription,OBJPROP_ANGLE, angle);
      ObjectSetInteger(0,objNameDescription,OBJPROP_FONTSIZE,10);
      if (direction > 0) {
         ObjectSetInteger(0,objNameDescription,OBJPROP_ANCHOR,ANCHOR_LEFT);
         ObjectSetString(0,objNameDescription,OBJPROP_TEXT, "    " + txt);
      }
      if (direction < 0) {
         ObjectSetInteger(0,objNameDescription,OBJPROP_ANCHOR,ANCHOR_BOTTOM);
         ObjectSetString(0,objNameDescription,OBJPROP_TEXT, "    " + txt);
      }
   }
This is what we get as a result of the resistance points concatenation with their descriptions.
Concurrently, to map the support levels, the same logic applies but with inverse conditions.
         else if (is_support){
            //Print("SUPPORT AT BAR ",i," (",low,") & ",j," (",low_j,"), Pts = ",low_diff);

            for (int k=0; k<ArraySize(pricesLowest); k++){
               if (pricesLowest[k]==low){
                  matchFound_low1 = true;
                  //Print("> SUP L1(",low,") FOUND @ ",k," (",pricesLowest[k],")");
               }
               if (pricesLowest[k]==low_j){
                  matchFound_low2 = true;
                  //Print("> SUP L2(",low_j,") FOUND @ ",k," (",pricesLowest[k],")");
               }
               if (matchFound_low1 && matchFound_low2){
                  if (supportLevels[0]==low || supportLevels[1]==low_j){
                     Print("CONFIRMED BUT This is the same support level, skip updating!");
                     stop_processing = true; // Set the flag to stop processing
                     break; // stop the inner loop prematurely
                  }
                  else {
                     Print(" ++++++++++ SUPPORT LEVELS CONFIRMED @ BARS ",i,
                     "(",low,") & ",j,"(",low_j,")");
                     supportLevels[0] = low;
                     supportLevels[1] = low_j;
                     ArrayPrint(supportLevels);

                     draw_S_R_Level(supLine,low,colorSup,5);
                     draw_S_R_Level_Point(supline_prefix,low,time,217,1,colorSup,-90);
                     draw_S_R_Level_Point(supline_prefix,low,time_j,217,1,colorSup,-90);

                     stop_processing = true; // Set the flag to stop processing
                     break;
                  }
               }
            }
         }
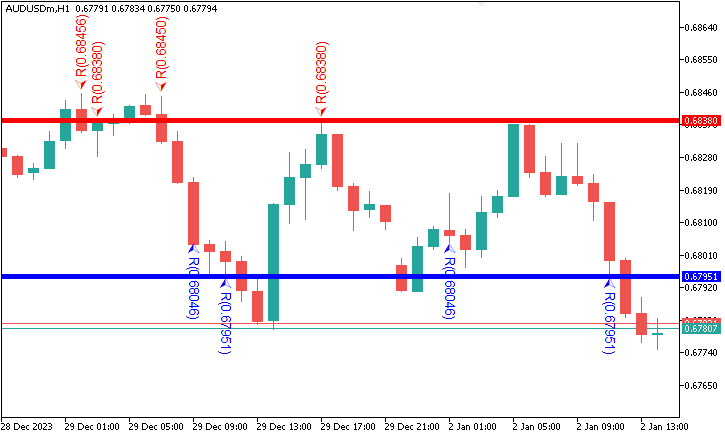
The final result that we get due to the levels identification and their respective mapping into the chart milestone is as below.
We then proceed to monitor the levels and if the levels become out of visible bars proximity, we consider the resistance level invalid and delete it. To achieve this, we will need to find the object level lines, and when found, we check the conditions for their validity.
   if (ObjectFind(0,resLine) >= 0){
      double objPrice = ObjectGetDouble(0,resLine,OBJPROP_PRICE);
      double visibleHighs[];
      ArraySetAsSeries(visibleHighs,true);
      CopyHigh(_Symbol,_Period,1,visible_bars,visibleHighs);
      //Print("Object Found & visible bars is: ",ArraySize(visibleHighs));
      //ArrayPrint(visibleHighs);
      bool matchHighFound = false;

      ...
   }
Here, we check if the resistance line object is found, and if so, we get its price. We again copy the highs of the visible bars on the chart and store them in the visibleHighs double array variable.
Afterward, we loop via the high prices and try to find if there is a match between the price of the currently selected bar and the resistance line price. If there is a match, we set the matchHighFound flag to true and terminate the loop.
      for (int i=0; i<ArraySize(visibleHighs); i++){
         if (visibleHighs[i] == objPrice){
            Print("> Match price for resistance found at bar # ",i+1," (",objPrice,")");
            matchHighFound = true;
            break;
         }
      }
If case there is no match, it means that the resistance level is out of proximity. We inform of the instance and use a custom function to delete the object.
      if (!matchHighFound){
         Print("(",objPrice,") > Match price for the resistance line not found. Delete!");
         deleteLevel(resLine);
      }
The custom function deleteLevel takes just one argument, the level name to be deleted, and uses the ObjectDelete function to delete the defined object.
void deleteLevel(string levelName){
   ObjectDelete(0,levelName);
   ChartRedraw(0);
}
The same logic applies to the support level line, but inverse conditions prevail.
   if (ObjectFind(0,supLine) >= 0){
      double objPrice = ObjectGetDouble(0,supLine,OBJPROP_PRICE);
      double visibleLows[];
      ArraySetAsSeries(visibleLows,true);
      CopyLow(_Symbol,_Period,1,visible_bars,visibleLows);
      //Print("Object Found & visible bars is: ",ArraySize(visibleLows));
      //ArrayPrint(visibleLows);
      bool matchLowFound = false;

      for (int i=0; i<ArraySize(visibleLows); i++){
         if (visibleLows[i] == objPrice){
            Print("> Match price for support found at bar # ",i+1," (",objPrice,")");
            matchLowFound = true;
            break;
         }
      }
      if (!matchLowFound){
         Print("(",objPrice,") > Match price for the support line not found. Delete!");
         deleteLevel(supLine);
      }
   }
Finally, if up to this point, the resistance and support levels are still within the chart, it means they are valid, and so, we can continue to create a logic that will determine whether they are broken and open market position. Let us consider resistance level break first.
Since the price could break above the resistance level severally leading to multiple signal generations, we need logic to ensure that once we break a resistance level and generate a signal, we won't trigger the signal again when we break it afterward if it is the very same level. To achieve this, we declare a static double variable that will hold our price for the signal, which will maintain its value until we have another different signal.
static double ResistancePriceTrade = 0;
   if (ObjectFind(0,resLine) >= 0){
      double ResistancePriceLevel = ObjectGetDouble(0,resLine,OBJPROP_PRICE);
      if (ResistancePriceTrade != ResistancePriceLevel){
      ...

   }
We then check the existence of the resistance line, and if it does exist, we get its price. Using a conditional statement, we check if the signal is not equal to the resistance line price, meaning that we do not yet have a generated signal for that particular level and that we can proceed to check for the breakout signal. To do the check-up, we will need the data for the previous bar as well as updated price quotes.
         double Ask = NormalizeDouble(SymbolInfoDouble(_Symbol,SYMBOL_ASK),_Digits);
         double Bid = NormalizeDouble(SymbolInfoDouble(_Symbol,SYMBOL_BID),_Digits);
         double open1 = iOpen(_Symbol,_Period,1);
         double high1 = iHigh(_Symbol,_Period,1);
         double low1 = iLow(_Symbol,_Period,1);
         double close1 = iClose(_Symbol,_Period,1);
We then use conditional statements to check whether the price breaks above the resistance level. If so, we inform of the sell signal via a print to the journal. Then we use our trade object and dot operator to get access to the sell entry method and provide the necessary parameters. Finally, we update the signal variable value to the current resistance level so we don't bother generating another signal based on the same resistance level.
         if (open1 > close1 && open1 < ResistancePriceLevel
            && high1 > ResistancePriceLevel && Bid < ResistancePriceLevel){
            Print("$$$$$$$$$$$$ SELL NOW SIGNAL!");
            obj_Trade.Sell(0.01,_Symbol,Bid,Bid+350*5*_Point,Bid-350*_Point);
            ResistancePriceTrade = ResistancePriceLevel;
         }
The same logic applies to the support breakout logic, but inverse conditions prevail.
   static double SupportPriceTrade = 0;
   if (ObjectFind(0,supLine) >= 0){
      double SupportPriceLevel = ObjectGetDouble(0,supLine,OBJPROP_PRICE);
      if (SupportPriceTrade != SupportPriceLevel){
         double Ask = NormalizeDouble(SymbolInfoDouble(_Symbol,SYMBOL_ASK),_Digits);
         double Bid = NormalizeDouble(SymbolInfoDouble(_Symbol,SYMBOL_BID),_Digits);
         double open1 = iOpen(_Symbol,_Period,1);
         double high1 = iHigh(_Symbol,_Period,1);
         double low1 = iLow(_Symbol,_Period,1);
         double close1 = iClose(_Symbol,_Period,1);

         if (open1 < close1 && open1 > SupportPriceLevel
            && low1 < SupportPriceLevel && Ask > SupportPriceLevel){
            Print("$$$$$$$$$$$$ BUY NOW SIGNAL!");
            obj_Trade.Buy(0.01,_Symbol,Ask,Ask-350*5*_Point,Ask+350*_Point);
            SupportPriceTrade = SupportPriceLevel;
         }

      }
   }
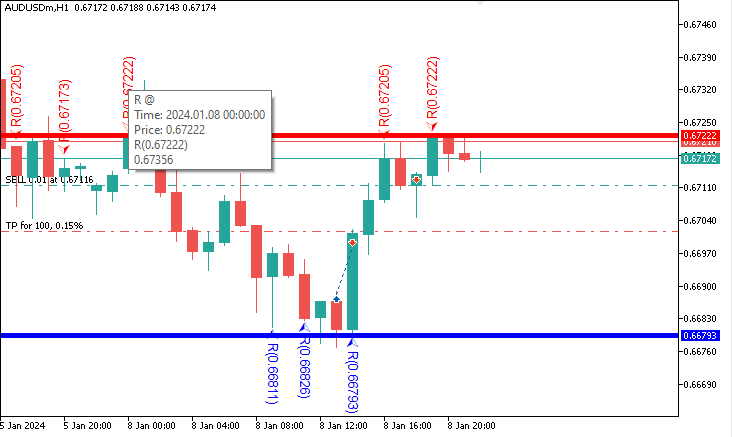
Here is the representation of the milestone.
The following is the full code that is needed to create a Support and Resistance forex trading strategy in MQL5 that identifies the levels, maps them in the chart, and opens market positions respectively.
//+------------------------------------------------------------------+
//|                                       RESISTANCE AND SUPPORT.mq5 |
//|                                  Copyright 2024, MetaQuotes Ltd. |
//|                                             https://www.mql5.com |
//+------------------------------------------------------------------+
#property copyright "Copyright 2024, MetaQuotes Ltd."
#property link      "https://www.mql5.com"
#property version   "1.00"

#include <Trade/Trade.mqh>
CTrade obj_Trade;

//bool stop_processing = false;

double pricesHighest[], pricesLowest[];

double resistanceLevels[2], supportLevels[2];


#define resLine "RESISTANCE LEVEL"
#define colorRes clrRed
#define resline_prefix "R"

#define supLine "SUPPORT LEVEL"
#define colorSup clrBlue
#define supline_prefix "S"

//+------------------------------------------------------------------+
//| Expert initialization function                                   |
//+------------------------------------------------------------------+
int OnInit(){
//---

   ArraySetAsSeries(pricesHighest,true);
   ArraySetAsSeries(pricesLowest,true);
   // define the size of the arrays
   ArrayResize(pricesHighest,50);
   ArrayResize(pricesLowest,50);
//---
   return(INIT_SUCCEEDED);
}
//+------------------------------------------------------------------+
//| Expert deinitialization function                                 |
//+------------------------------------------------------------------+
void OnDeinit(const int reason){
//---
   ArrayFree(pricesHighest);
   ArrayFree(pricesLowest);

   //ArrayFree(resistanceLevels); // cannot be used for static allocated array
   //ArrayFree(supportLevels); // cannot be used for static allocated array

   ArrayRemove(resistanceLevels,0,WHOLE_ARRAY);
   ArrayRemove(supportLevels,0,WHOLE_ARRAY);
}
//+------------------------------------------------------------------+
//| Expert tick function                                             |
//+------------------------------------------------------------------+
void OnTick(){
//---

   int currBars = iBars(_Symbol,_Period);
   static int prevBars = currBars;
   if (prevBars == currBars) return;
   prevBars = currBars;

   int visible_bars = (int)ChartGetInteger(0,CHART_VISIBLE_BARS);
   bool stop_processing = false; // Flag to control outer loop
   bool matchFound_high1 = false, matchFound_low1 = false;
   bool matchFound_high2 = false, matchFound_low2 = false;

   ArrayFree(pricesHighest);
   ArrayFree(pricesLowest);

   int copiedBarsHighs = CopyHigh(_Symbol,_Period,1,visible_bars,pricesHighest);
   int copiedBarsLows = CopyLow(_Symbol,_Period,1,visible_bars,pricesLowest);

   //ArrayPrint(pricesHighest);
   //ArrayPrint(pricesLowest);
         // sort the array in ascending order
   ArraySort(pricesHighest);
   ArraySort(pricesLowest);
   //ArrayPrint(pricesHighest);
   //ArrayPrint(pricesLowest);
   ArrayRemove(pricesHighest,10,WHOLE_ARRAY);
   ArrayRemove(pricesLowest,0,visible_bars-10);
   //Print("FIRST 10 HIGHEST PRICES:");
   //ArrayPrint(pricesHighest);
   //Print("LAST 10 LOWEST PRICES:");
   //ArrayPrint(pricesLowest);

   for (int i=1; i<=visible_bars-1 && !stop_processing; i++){
      //Print(":: BAR NO: ",i);
      double open = iOpen(_Symbol,_Period,i);
      double high = iHigh(_Symbol,_Period,i);
      double low = iLow(_Symbol,_Period,i);
      double close = iClose(_Symbol,_Period,i);
      datetime time = iTime(_Symbol,_Period,i);

      int diff_i_j = 10;

      for (int j=i+diff_i_j; j<=visible_bars-1; j++){
         //Print("BAR CHECK NO: ",j);
         double open_j = iOpen(_Symbol,_Period,j);
         double high_j = iHigh(_Symbol,_Period,j);
         double low_j = iLow(_Symbol,_Period,j);
         double close_j = iClose(_Symbol,_Period,j);
         datetime time_j = iTime(_Symbol,_Period,j);

         // CHECK FOR RESISTANCE
         double high_diff = NormalizeDouble((MathAbs(high-high_j)/_Point),0);
         bool is_resistance = high_diff <= 10;

         // CHECK FOR SUPPORT
         double low_diff = NormalizeDouble((MathAbs(low-low_j)/_Point),0);
         bool is_support = low_diff <= 10;

         if (is_resistance){
            //Print("RESISTANCE AT BAR ",i," (",high,") & ",j," (",high_j,"), Pts = ",high_diff);

            for (int k=0; k<ArraySize(pricesHighest); k++){
               if (pricesHighest[k]==high){
                  matchFound_high1 = true;
                  //Print("> RES H1(",high,") FOUND @ ",k," (",pricesHighest[k],")");
               }
               if (pricesHighest[k]==high_j){
                  matchFound_high2 = true;
                  //Print("> RES H2(",high_j,") FOUND @ ",k," (",pricesHighest[k],")");
               }
               if (matchFound_high1 && matchFound_high2){
                  if (resistanceLevels[0]==high || resistanceLevels[1]==high_j){
                     Print("CONFIRMED BUT This is the same resistance level, skip updating!");
                     stop_processing = true; // Set the flag to stop processing
                     break; // stop the inner loop prematurily
                  }
                  else {
                     Print(" ++++++++++ RESISTANCE LEVELS CONFIRMED @ BARS ",i,
                     "(",high,") & ",j,"(",high_j,")");
                     resistanceLevels[0] = high;
                     resistanceLevels[1] = high_j;
                     ArrayPrint(resistanceLevels);

                     draw_S_R_Level(resLine,high,colorRes,5);
                     draw_S_R_Level_Point(resline_prefix,high,time,218,-1,colorRes,90);
                     draw_S_R_Level_Point(resline_prefix,high,time_j,218,-1,colorRes,90);

                     stop_processing = true; // Set the flag to stop processing
                     break;
                  }
               }
            }
         }

         else if (is_support){
            //Print("SUPPORT AT BAR ",i," (",low,") & ",j," (",low_j,"), Pts = ",low_diff);

            for (int k=0; k<ArraySize(pricesLowest); k++){
               if (pricesLowest[k]==low){
                  matchFound_low1 = true;
                  //Print("> SUP L1(",low,") FOUND @ ",k," (",pricesLowest[k],")");
               }
               if (pricesLowest[k]==low_j){
                  matchFound_low2 = true;
                  //Print("> SUP L2(",low_j,") FOUND @ ",k," (",pricesLowest[k],")");
               }
               if (matchFound_low1 && matchFound_low2){
                  if (supportLevels[0]==low || supportLevels[1]==low_j){
                     Print("CONFIRMED BUT This is the same support level, skip updating!");
                     stop_processing = true; // Set the flag to stop processing
                     break; // stop the inner loop prematurely
                  }
                  else {
                     Print(" ++++++++++ SUPPORT LEVELS CONFIRMED @ BARS ",i,
                     "(",low,") & ",j,"(",low_j,")");
                     supportLevels[0] = low;
                     supportLevels[1] = low_j;
                     ArrayPrint(supportLevels);

                     draw_S_R_Level(supLine,low,colorSup,5);
                     draw_S_R_Level_Point(supline_prefix,low,time,217,1,colorSup,-90);
                     draw_S_R_Level_Point(supline_prefix,low,time_j,217,1,colorSup,-90);

                     stop_processing = true; // Set the flag to stop processing
                     break;
                  }
               }
            }
         }


         if (stop_processing){break;}
      }
      if (stop_processing){break;}
   }

   if (ObjectFind(0,resLine) >= 0){
      double objPrice = ObjectGetDouble(0,resLine,OBJPROP_PRICE);
      double visibleHighs[];
      ArraySetAsSeries(visibleHighs,true);
      CopyHigh(_Symbol,_Period,1,visible_bars,visibleHighs);
      //Print("Object Found & visible bars is: ",ArraySize(visibleHighs));
      //ArrayPrint(visibleHighs);
      bool matchHighFound = false;

      for (int i=0; i<ArraySize(visibleHighs); i++){
         if (visibleHighs[i] == objPrice){
            Print("> Match price for resistance found at bar # ",i+1," (",objPrice,")");
            matchHighFound = true;
            break;
         }
      }
      if (!matchHighFound){
         Print("(",objPrice,") > Match price for the resistance line not found. Delete!");
         deleteLevel(resLine);
      }
   }

   if (ObjectFind(0,supLine) >= 0){
      double objPrice = ObjectGetDouble(0,supLine,OBJPROP_PRICE);
      double visibleLows[];
      ArraySetAsSeries(visibleLows,true);
      CopyLow(_Symbol,_Period,1,visible_bars,visibleLows);
      //Print("Object Found & visible bars is: ",ArraySize(visibleLows));
      //ArrayPrint(visibleLows);
      bool matchLowFound = false;

      for (int i=0; i<ArraySize(visibleLows); i++){
         if (visibleLows[i] == objPrice){
            Print("> Match price for support found at bar # ",i+1," (",objPrice,")");
            matchLowFound = true;
            break;
         }
      }
      if (!matchLowFound){
         Print("(",objPrice,") > Match price for the support line not found. Delete!");
         deleteLevel(supLine);
      }
   }

   static double ResistancePriceTrade = 0;
   if (ObjectFind(0,resLine) >= 0){
      double ResistancePriceLevel = ObjectGetDouble(0,resLine,OBJPROP_PRICE);
      if (ResistancePriceTrade != ResistancePriceLevel){
         double Ask = NormalizeDouble(SymbolInfoDouble(_Symbol,SYMBOL_ASK),_Digits);
         double Bid = NormalizeDouble(SymbolInfoDouble(_Symbol,SYMBOL_BID),_Digits);
         double open1 = iOpen(_Symbol,_Period,1);
         double high1 = iHigh(_Symbol,_Period,1);
         double low1 = iLow(_Symbol,_Period,1);
         double close1 = iClose(_Symbol,_Period,1);

         if (open1 > close1 && open1 < ResistancePriceLevel
            && high1 > ResistancePriceLevel && Bid < ResistancePriceLevel){
            Print("$$$$$$$$$$$$ SELL NOW SIGNAL!");
            obj_Trade.Sell(0.01,_Symbol,Bid,Bid+350*5*_Point,Bid-350*_Point);
            ResistancePriceTrade = ResistancePriceLevel;
         }

      }
   }

   static double SupportPriceTrade = 0;
   if (ObjectFind(0,supLine) >= 0){
      double SupportPriceLevel = ObjectGetDouble(0,supLine,OBJPROP_PRICE);
      if (SupportPriceTrade != SupportPriceLevel){
         double Ask = NormalizeDouble(SymbolInfoDouble(_Symbol,SYMBOL_ASK),_Digits);
         double Bid = NormalizeDouble(SymbolInfoDouble(_Symbol,SYMBOL_BID),_Digits);
         double open1 = iOpen(_Symbol,_Period,1);
         double high1 = iHigh(_Symbol,_Period,1);
         double low1 = iLow(_Symbol,_Period,1);
         double close1 = iClose(_Symbol,_Period,1);

         if (open1 < close1 && open1 > SupportPriceLevel
            && low1 < SupportPriceLevel && Ask > SupportPriceLevel){
            Print("$$$$$$$$$$$$ BUY NOW SIGNAL!");
            obj_Trade.Buy(0.01,_Symbol,Ask,Ask-350*5*_Point,Ask+350*_Point);
            SupportPriceTrade = SupportPriceLevel;
         }

      }
   }

}
//+------------------------------------------------------------------+

void draw_S_R_Level(string levelName,double price,color clr,int width){
   if (ObjectFind(0,levelName) < 0){
      ObjectCreate(0,levelName,OBJ_HLINE,0,TimeCurrent(),price);
      ObjectSetInteger(0,levelName,OBJPROP_COLOR,clr);
      ObjectSetInteger(0,levelName,OBJPROP_WIDTH,width);
   }
   else {
      ObjectSetDouble(0,levelName,OBJPROP_PRICE,price);
   }
   ChartRedraw(0);
}

void deleteLevel(string levelName){
   ObjectDelete(0,levelName);
   ChartRedraw(0);
}

void draw_S_R_Level_Point(string objName,double price,datetime time,
      int arrowcode,int direction,color clr,double angle){
   //objName = " ";
   StringConcatenate(objName,objName," @ \nTime: ",time,"\nPrice: ",DoubleToString(price,_Digits));
   if (ObjectCreate(0,objName,OBJ_ARROW,0,time,price)) {
      ObjectSetInteger(0,objName,OBJPROP_ARROWCODE,arrowcode);
      ObjectSetInteger(0,objName,OBJPROP_COLOR,clr);
      ObjectSetInteger(0,objName,OBJPROP_FONTSIZE,10);
      if (direction > 0) ObjectSetInteger(0,objName,OBJPROP_ANCHOR,ANCHOR_TOP);
      if (direction < 0) ObjectSetInteger(0,objName,OBJPROP_ANCHOR,ANCHOR_BOTTOM);
   }
   string prefix = resline_prefix;
   string txt = "\n"+prefix+"("+DoubleToString(price,_Digits)+")";
   string objNameDescription = objName + txt;
   if (ObjectCreate(0,objNameDescription,OBJ_TEXT,0,time,price)) {
     // ObjectSetString(0,objNameDescription,OBJPROP_TEXT, "" + txt);
      ObjectSetInteger(0,objNameDescription,OBJPROP_COLOR,clr);
      ObjectSetDouble(0,objNameDescription,OBJPROP_ANGLE, angle);
      ObjectSetInteger(0,objNameDescription,OBJPROP_FONTSIZE,10);
      if (direction > 0) {
         ObjectSetInteger(0,objNameDescription,OBJPROP_ANCHOR,ANCHOR_LEFT);
         ObjectSetString(0,objNameDescription,OBJPROP_TEXT, "    " + txt);
      }
      if (direction < 0) {
         ObjectSetInteger(0,objNameDescription,OBJPROP_ANCHOR,ANCHOR_BOTTOM);
         ObjectSetString(0,objNameDescription,OBJPROP_TEXT, "    " + txt);
      }
   }
   ChartRedraw(0);
}
Cheers to us! Now we created a pure price action trading system based on the Support and Resistance forex trading strategy to not only generate trading signals but also open market positions based on the generated signals.
Strategy tester results
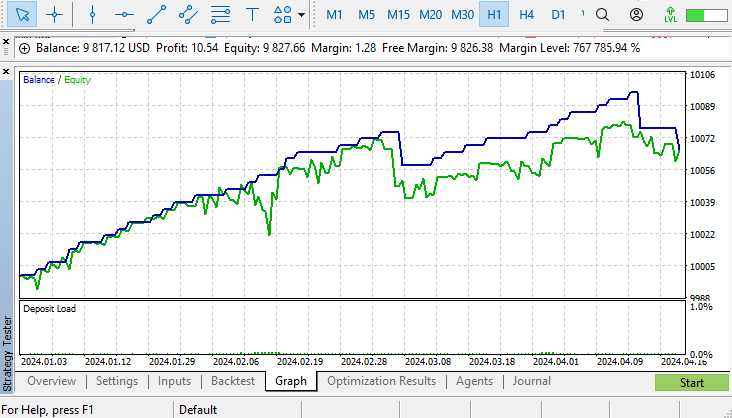
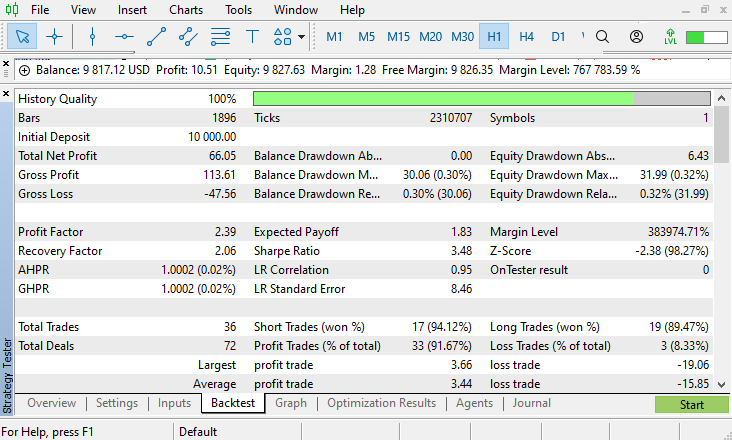
Upon testing on the strategy tester, here are the results.
- Balance/Equity graph:
- Backtest results:
Conclusion
In conclusion, the automation of the support and resistance forex trading strategy is possible and easy, as we have seen. All that it takes is for one to have a clear understanding of the strategy, as well as its blueprint, and then use the knowledge for a breakthrough. We confidently leveraged the powerful features of the MQL5 language to precise and efficient trading strategy. The analysis and EA creation have shown that automation not only saves valuable time but also enhances the effectiveness of trading by reducing human error and emotional interference.
We sincerely hope that the article was instructive and useful to you in automating support and resistance EA. Such automated system integration will surely increase in frequency as the financial markets develop further, providing traders with cutting-edge instruments to handle all aspects of market dynamics. With technologies like MQL5 continuing to advance and open the door to more complex and intelligent trading solutions, the future of trading appears bright.
 Developing Zone Recovery Martingale strategy in MQL5
 Creating Time Series Predictions using LSTM Neural Networks: Normalizing Price and Tokenizing Time
 Automated Parameter Optimization for Trading Strategies Using Python and MQL5
 Developing a Replay System (Part 39): Paving the Path (III)
- Free trading apps
- Over 8,000 signals for copying
- Economic news for exploring financial markets
You agree to website policy and terms of use