How to Integrate Smart Money Concepts (BOS) Coupled with the RSI Indicator into an EA
Introduction
In the fast-paced world of foreign exchange trading, having a reliable and efficient trading system is crucial for success. Trading in general has plenty of terms, concepts, and strategies. Often at times it can be over whelming, especially for new traders who are still trying to find their footing in the trading industry. Smart Money Concept(SMC) is one of the trending concepts in forex trading, but it can be difficult at times for new traders or for anyone to use smart money concepts in their trading.
To solve this problem, there should be a robust tool for automating trading decision based on market structure and price action. The solution is to couple the Smart Money Concept (Break Of Structure) with the popular Relative Strength Index(RSI) indicator. This combination provides a strategic edge by leveraging both price action and momentum analysis, which enhances the accuracy of trade entries and exits, aiming to optimize trading performance.
The idea of the Expert Advisor example
The idea and functionality of this Expert Advisor example is that the expert will be detecting the swing lows and the swing highs as some smart money concepts utilizes the swings. The RSI indicator will still be using the traditional conversion of the 70 level for over bought market and the 30 level for over sold market and the period will be 8. When the market price is above the previously detected high, that will indicate the break of structure on the upside. Similarly, when the market price is below the previously detected low, that will indicate break of structure on the downside.
Now let's develop the Expert Advisor example
The EA aims to open a buy and a sell orders based on market conditions and RSI levels. Specifically, it:
- Identifies swing highs and swing lows in the market.
- Checks if the market is above the previous swing high (for a sell signal) or below the previous swing low (for a buy signals).
- Then Confirms the signal with RSI levels.
With that being said, basically the Expert Advisor will search for break of structure or break of previous swings (high/low) and then if the RSI value is within the specified settings then a market order will be executed (BUY/SELL).
Code Breakdown
1. Properties and Includes
#property copyright "Copyright 2024, MetaQuotes Ltd."
#property link      "https://www.mql5.com"
#property version   "1.00"
#include <Trade/Trade.mqh>
These lines define the EA's properties and include the trade library necessary for executing trades.
2. Global Variables and Inputs
long MagicNumber = 76543;
double lotsize = 0.01;
input int RSIperiod = 8;
input int RSIlevels = 70;
int stopLoss = 200;
int takeProfit = 500;
bool closeSignal = false;
- MagicNumber: A unique identifier for the EA's trades.
- Lotsize: The size of each trade.
- RSIperiod: Period for the RSI calculations.
- RSIlevels: Threshold level for the RSI.
- Stoploss and takeProfit: SL and TP levels in points.
- CloseSignal: Flag for closing positions based on the opposite signal compared to the position which is currently open.
3. RSI Variables
int handle;
double buffer[];
MqlTick currentTick;
CTrade trade;
datetime openTimeBuy = 0;
datetime openTimeSell = 0;
- Handle: Handle for the RSI indicator.
- Buffer: Array to store the RSI values.
- currentTick: Structure to store current market prices.
- Trade: This is the object fortrade operations.
- openTimeBuy and openTimeSell: The timestamps for the last buy and sell signals and operations.
4. Initialization Function
int OnInit() {
    if (RSIperiod <= 1) {
        Alert("RSI period <= 1");
        return INIT_PARAMETERS_INCORRECT;
    }
    if (RSIlevels >= 100 || RSIlevels <= 50) {
        Alert("RSI level >= 100 or <= 50");
        return INIT_PARAMETERS_INCORRECT;
    }
    trade.SetExpertMagicNumber(MagicNumber);
    handle = iRSI(_Symbol, PERIOD_CURRENT, RSIperiod, PRICE_CLOSE);
    if (handle == INVALID_HANDLE) {
        Alert("Failed to create indicator handle");
        return INIT_FAILED;
    }
    ArraySetAsSeries(buffer, true);
    return INIT_SUCCEEDED;
}
- Validates RSI period and levels.
- Sets the magic number for trade identification.
- Creates an RSI indicator handle.
- Sets the buffer as a series to store RSI values in reverse chronological order.
5. Deinitialization Function
void OnDeinit(const int reason) {
    if (handle != INVALID_HANDLE) {
        IndicatorRelease(handle);
    }
}
Releases the RSI indicator handle when the EA is removed.
6. OnTick Function
As we all know, the OnTick function contains the core logic for detecting signals and executing trades.
void OnTick() {
    static bool isNewBar = false;
    int newbar = iBars(_Symbol, _Period);
    static int prevBars = newbar;
    if (prevBars == newbar) {
        isNewBar = false;
    } else if (prevBars != newbar) {
        isNewBar = true;
        prevBars = newbar;
    }
Firstly, since the OnTick function runs on every Tick, we need to make sure that when we do detect a signal or execute a trade we execute it once per bar. We accomplish that by declaring a static boolean variable isNewBar. Which we set to false initially, and then declare an int variable newBar which is assigned the function iBars so that we can keep track of every candle bar.
- static bool isNewBar: Keeps track of whether a new bar (candlestick) has formed.
- int newbar = iBars(_symbol, _Period): Gets the current number of bars on the chart.
- static int prevBars = newbar: Initializes the previous bar count.
- The if-else block checks if the bar count has changed, indicating a new bar. If a new bar has formed, 'isNewBar' is set to 'true' otherwise, it's 'false'.
    const int length = 10;
    int right_index, left_index;
    int curr_bar = length;
    bool isSwingHigh = true, isSwingLow = true;
    static double swing_H = -1.0, swing_L = -1.0;
We then need to set the variables to detect the swing highs and swing lows:
- const int length = 10: Defines the range for detecting the swing highs and the swing lows.
- int right_index, left_index: Indices for bars to the right and bars to the left of the current bar.
- int curr_bar = length: Set the current bar index.
- bool isSwingHigh = true, isSwingLow = true: These are flags to determine if a bar is a swing high or a swing low.
- static double swing_H = -1.0, swing_L = -1.0: Stores the latest detected swing high and the latest detected swing low values.
    double Ask = NormalizeDouble(SymbolInfoDouble(_Symbol, SYMBOL_ASK), _Digits);
    double Bid = NormalizeDouble(SymbolInfoDouble(_Symbol, SYMBOL_BID), _Digits);
The variables are of type double and the variable 'Ask' is used to get the current market ASK price, and the variable 'Bid' is used to get the current market BID price:
- double Ask: Gets the current ask price
- double Bid: Gets the current bid price
- NormalizeDouble: Rounds the price to the correct number of decimal places.
    if (isNewBar) {
        for (int a = 1; a <= length; a++) {
            right_index = curr_bar - a;
            left_index = curr_bar + a;

            if ((high(curr_bar) <= high(right_index)) || (high(curr_bar) < high(left_index))) {
                isSwingHigh = false;
            }
            if ((low(curr_bar) >= low(right_index)) || (low(curr_bar) > low(left_index))) {
                isSwingLow = false;
            }
        }

        if (isSwingHigh) {
            swing_H = high(curr_bar);
            Print("We do have a swing high at: ", curr_bar, " H: ", high(curr_bar));
            drawswing(TimeToString(time(curr_bar)), time(curr_bar), high(curr_bar), 32, clrBlue, -1);
        }
        if (isSwingLow) {
            swing_L = low(curr_bar);
            Print("We do have a swing low at: ", curr_bar, " L: ", low(curr_bar));
            drawswing(TimeToString(time(curr_bar)), time(curr_bar), low(curr_bar), 32, clrRed, +1);
        }
    }
We then proceed to search for swing highs and swings lows, but before that, if a new bar is detected, the function checks the surrounding bars within the defined 'length' to identify if there are swing highs or swing lows. The variable length is to define a range of candles to search for swings, for each bar within the range, the function compares the current bar's high/low with adjacent bars.
If the current bar's high is not higher than the surrounding bars, then it is not a swing high. If the current bar's low is not lower than the surrounding bars, it is not a swing low. Given that all those conditions are met then a swing high or a swing low is confirmed, then the respective value is stored, and then a marker is drawn on the chart using the 'drawswing' function.
    int values = CopyBuffer(handle, 0, 0, 2, buffer);
    if (values != 2) {
        Print("Failed to get indicator values");
        return;
    }

    Comment("Buffer[0]: ", buffer[0],
            "\nBuffer[1]: ", buffer[1]);
- copyBuffer(handle, 0, 0, 2, buffer): Copies the latest RSI values into the buffer.
- If the function fails to retrieve the RSI values, it exits.
- The RSI values will be displayed as a comment on the chart.
    int cntBuy = 0, cntSell = 0;
    if (!countOpenPositions(cntBuy, cntSell)) {
        return;
    }
'countOpenPositions(cntBuy, cntSell)' this function counts the number of open buy and sell positions, if the function fails, 'OnTick' exits.
    if (swing_H > 0 && Ask > swing_H && buffer[0] >= 70) {
        Print("Sell Signal: Market is above previous high and RSI >= 70");
        int swing_H_index = 0;
        for (int i = 0; i <= length * 2 + 1000; i++) {
            if (high(i) == swing_H) {
                swing_H_index = i;
                break;
            }
        }
        drawBreakLevels(TimeToString(time(0)), time(swing_H_index), high(swing_H_index), time(0), high(swing_H_index), clrBlue, -1);

        if (cntSell == 0) {
            double Bid = NormalizeDouble(SymbolInfoDouble(_Symbol, SYMBOL_BID), _Digits);
            double sl = Bid + stopLoss * _Point;
            double tp = Bid - takeProfit * _Point;
            trade.PositionOpen(_Symbol, ORDER_TYPE_SELL, lotsize, currentTick.bid, sl, tp, "RSI EA");
        }

        swing_H = -1.0;
        return;
    }
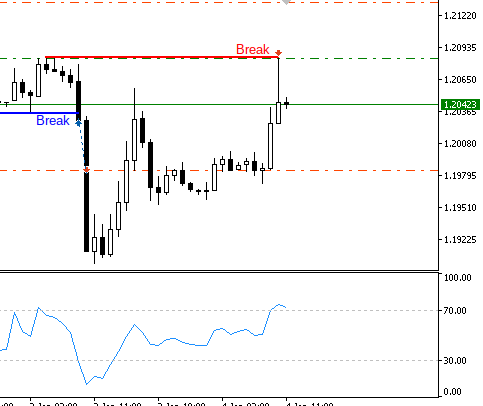
As I have explained previously, we will be checking for a sell signal. The logic is that the ask price must be above the previous swing high. Additionally, the RSI value must be somewhat greater or equals to the 70 level. If the conditions are met, it marks the swing high and draws a break level on the chart. If there are no open sell positions, it then proceeds to open a sell position, this sell trade will be opened with the calculated stop loss and take profit level, and then the swing high value will reset.
    if (swing_L > 0 && Bid < swing_L && buffer[0] <= 30) {
        Print("Buy Signal: Market is below previous low and RSI <= 30");
        int swing_L_index = 0;
        for (int i = 0; i <= length * 2 + 1000; i++) {
            if (low(i) == swing_L) {
                swing_L_index = i;
                break;
            }
        }
        drawBreakLevels(TimeToString(time(0)), time(swing_L_index), low(swing_L_index), time(0), low(swing_L_index), clrRed, +1);

        if (cntBuy == 0) {
            double Ask = NormalizeDouble(SymbolInfoDouble(_Symbol, SYMBOL_ASK), _Digits);
            double sl = Ask - stopLoss * _Point;
            double tp = Ask + takeProfit * _Point;
            trade.PositionOpen(_Symbol, ORDER_TYPE_BUY, lotsize, currentTick.ask, sl, tp, "RSI EA");
        }

        swing_L = -1.0;
        return;
    }
}
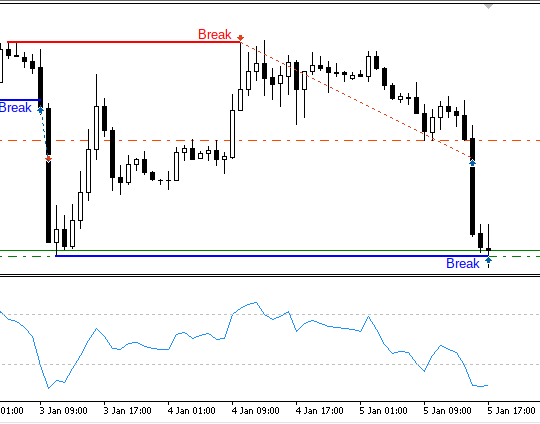
For the buy signal the same opposite logic applies, if the bid price is below the previous swing low, and the RSI value is less than or equal to the 30 level, then technically the buy logic is in order and the condition is met. When the condition is met it marks the swing low and then draws a break level on the chart. And if there are no open buy positions, it will proceed to open a new buy trade with the calculated stop loss and calculated take profit levels, and the lastly it will reset the swing low value.
What we are trying to accomplish is the following:
_ A sell Trade with all the conditions met:

_ A buy Trade with all the conditions met:

The summary of the OnTick function:
The Expert performs the following key actions on each market tick
- Detects New Bars: It first checks if we have a new candle bar which could have formed since the last tick, and also it keeps track of all the candles.
- Identifies Swing Highs and Swing Lows: It then identifies swing points in the market to use as reference levels for later when the market price is above swing High or the market is below swing low.
- Retrieves RSI Values: Obtains the latest RSI values for signal confirmation.
- Counts Open Positions: Keeps track of the current open Buy and Sell positions.
- Generates Trading Signals: Uses the swing points which are the swing high and the swing low and the RSI levels to generate Buy or Sell signals.
- Executes Trades: Opens new positions based on the generated signals if the conditions are all met.
Custom Functions for High, Low, and Time Values
double high(int index){
       return (iHigh(_Symbol, _Period, index));
}

double low(int index){
       return (iLow(_Symbol, _Period, index));
}

datetime time(int index){
       return (iTime(_Symbol, _Period, index));
}
The function high (int index) returns the high price of the bar at the specified index. It takes index as a parameter of type 'int'. The in-built MQL5 function iHigh(_symbol,_Period,index) is used to get the high price of the bar at index for the current symbol and period. Then followed by low (int index) this function returns the low price of the bar at the specified index, and it also takes index as a parameter which is of type int, and then we have iLow(_symbol, _Period, index). It is also MQL5 in-built function which gets the low price for the bar at index for the current symbol. Finally, we have time (int index) this function returns the time of the bar at the specified index, iTime(_symbol, _Period, index) is also MQL5 in-built function to get the time of the bar at index for the current symbol and period iTime's datatype is of type datetime.
The Function to Draw Swing Points
void drawswing(string objName, datetime time, double price, int arrCode, color clr, int direction){
   if(ObjectFind(0, objName) < 0){
      ObjectCreate(0, objName, OBJ_ARROW, 0, time, price);
      ObjectSetInteger(0, objName, OBJPROP_ARROWCODE, arrCode);
      ObjectSetInteger(0, objName, OBJPROP_COLOR, clr);
      ObjectSetInteger(0, objName, OBJPROP_FONTSIZE, 10);

      if(direction > 0){ObjectSetInteger(0, objName, OBJPROP_ANCHOR, ANCHOR_TOP);}
      if(direction < 0){ObjectSetInteger(0, objName, OBJPROP_ANCHOR, ANCHOR_BOTTOM);}

      string text = "";
      string Descr = objName + text;
      ObjectCreate(0, Descr, OBJ_TEXT, 0, time, price);
      ObjectSetInteger(0, Descr, OBJPROP_COLOR, clr);
      ObjectSetInteger(0, Descr, OBJPROP_FONTSIZE, 10);

      if(direction > 0){
         ObjectSetString(0, Descr, OBJPROP_TEXT,"  "+text);
         ObjectSetInteger(0, Descr, OBJPROP_ANCHOR, ANCHOR_LEFT_UPPER);
      }
      if(direction < 0){
         ObjectSetString(0, Descr, OBJPROP_TEXT,"  "+text);
         ObjectSetInteger(0, Descr, OBJPROP_ANCHOR, ANCHOR_LEFT_LOWER);
      }
   }
   ChartRedraw(0);
}
This Function crereates visual markers for the swing points (highs and lows) on the chart. It takes the following parameters:
- ObjName: Is the name of the object to be created.
- Time: The time at which the swing happened or has been detected.
- Price: The price at which the swing formed.
- ArrCode: Arrow code for the visual representation.
- Clr: Color for the arrow.
- Direction: Direction of the swing (positive for high, negative for low).
Functionality
1. Object Creation:
- ObjectFind(0, objName) < 0: Checks is an object with the given name already exists.
- ObjectCreate(0, objName, OBJ-ARROW, 0, time, price): Creates an arrow object at the specified time and price.
- ObjectSetInteger(0, objName, OBJPROP-ARROWCODE, arrCode): Set the arrow code.
- ObjectSetInteger(0, objName, OBJPROP-COLOR, clr): Sets the arrow color.
- ObjectSetInteger(0, objName, OBJPROP-FONTSIZE, 10): Sets the font size.
2. Direction Handling:
- Sets the anchor position based on the direction.
- OBJPROP-ANCHOR: Sets the position of the anchor poin for the arrow.
3. Text Object Creation:
- Creates a text object associated with the arrow to display additional information.
- Sets color, fort size, and anchor point for the text based on the direction.
4. Chart Update:
- ChartRedraw(0): Redraws the chart to reflect the changes
Function to Draw Break Levels
void drawBreakLevels(string objName, datetime time1, double price1, datetime time2, double price2, color clr, int direction){
   if(ObjectFind(0, objName) < 0){
         ObjectCreate(0, objName, OBJ_ARROWED_LINE, 0, time1, price1, time2, price2);
         ObjectSetInteger(0, objName, OBJPROP_TIME, 0, time1);
         ObjectSetDouble(0, objName, OBJPROP_PRICE, 0, price1);
         ObjectSetInteger(0, objName, OBJPROP_TIME, 1, time2);
         ObjectSetDouble(0, objName, OBJPROP_PRICE, 1, price2);
         ObjectSetInteger(0, objName, OBJPROP_COLOR, clr);
         ObjectSetInteger(0, objName, OBJPROP_WIDTH, 2);

         string text = "Break";
         string Descr = objName + text;
         ObjectCreate(0, Descr, OBJ_TEXT, 0, time2, price2);
         ObjectSetInteger(0, Descr, OBJPROP_COLOR, clr);
         ObjectSetInteger(0, Descr, OBJPROP_FONTSIZE, 10);

         if(direction > 0){
            ObjectSetString(0, Descr, OBJPROP_TEXT,text+"  ");
            ObjectSetInteger(0, Descr, OBJPROP_ANCHOR, ANCHOR_RIGHT_UPPER);
         }
         if(direction < 0){
            ObjectSetString(0, Descr, OBJPROP_TEXT,text+"  ");
            ObjectSetInteger(0, Descr, OBJPROP_ANCHOR, ANCHOR_RIGHT_LOWER);
         }
   }
   ChartRedraw(0);
}
This Function creates the visual representations for the break of price levels which are the swing points which would have been previously detected on the chart, it has the following parameters:
- objName: Name of the object to be created.
- time1, time2: The start time is the time at which the swing formed, and the end time is the time when break occurs.
- price1, price2: Start price is the price of the swing high or swing low occurred and price2 is the price at which the break of swing high or swing low happens.
- Clr: Color of the arrow.
- Direction: Direction for anchoring text.
Functionality
1. Object Creation:
- ObjectFind(0, objName) < 0: Checks if an object with a given name already exists.
- ObjectCreate(0, objName, OBJ_ARROWED_LINE, 0, time1, price1, time2, price2): Creates the arrow object at the specified times and prices.
- Sets the times and prices for the start and end points of arrow line.
- ObjectSetInteger(0, objName, OBJPROP-COLOR, clr): Sets the line color.
- ObjectSetInteger(0, objName, OBJPROP-WIDTH, 2): Sets the line width.
2. Text Object Creation:
- Creates a text object associated with the line to display additional information.
- Sets color, font size, and anchor point for the text based on the direction.
3. Chart Update:
- chartRedraw(0): Redraws the chart to reflect the changes.
Conclusion
In summary, the custom functions enhance the trading experience since it provides convenient access, there is simplified access to high, low, and time values of the bars. By coupling the RSI indicator with the SMC concepts, we can visualizing the indicators and confirm that the EA follows the instructions. When the function draws the arrow line on the chart, it marks significant points, which are the swing points (Highs and Lows). Additionally, we can observe the break levels. We also have the Dynamic update, which ensures that the chart is up-to-date in real time with the latest markers and indicators, aiding in visual analysis and decision-making.
Through this comprehensive guide, a thorough understanding of how to integrate the SMC concept with the RSI indicator to any Expert Advisor's structure and functionality has been provided. By following the step-by-step explanation, readers should now have a clear grasp of the SMC_RSI Expert Advisor operates, from initializing variables to executing trades based on calculated signals. Whether you are a seasoned trader or a beginner, this comprehensive insight should equip you with the necessary knowledge to utilize and customize this powerful tools effectively on your trading endeavors.
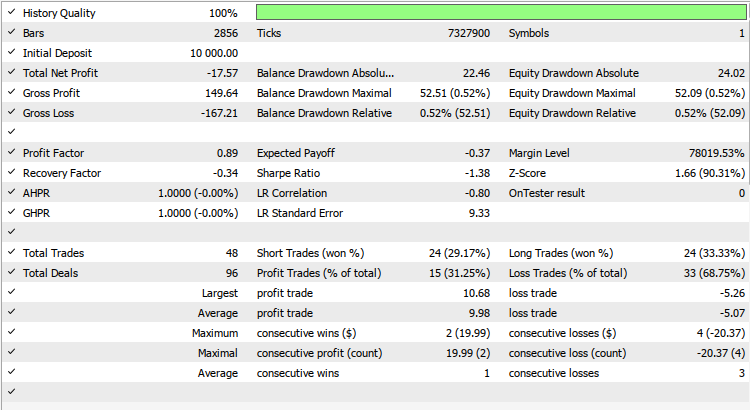
Here are the back test results below, I can say the EA itself still need some sort of optimization to obtain higher profit factor, now below are the back test results:

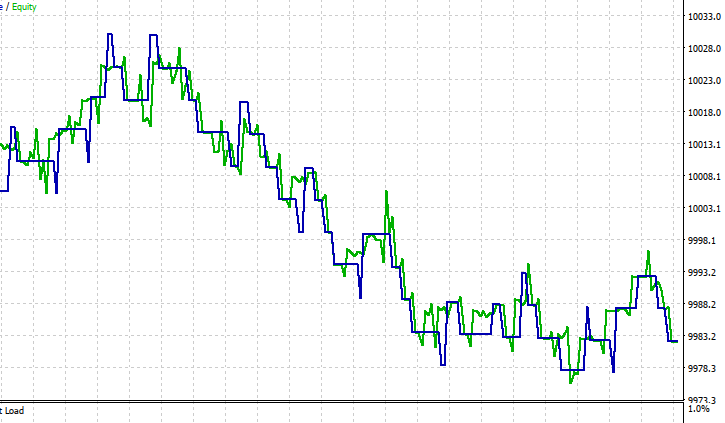
And then below we can see the visual representation of the equity curve, I have only tested for 12 months so who can say precisely how it would perform if maybe tested for possibly a period of 12 years.

 Eigenvectors and eigenvalues: Exploratory data analysis in MetaTrader 5
 Creating a Daily Drawdown Limiter EA in MQL5
 Using PatchTST Machine Learning Algorithm for Predicting Next 24 Hours of Price Action
 Neural networks made easy (Part 79): Feature Aggregated Queries (FAQ) in the context of state
- Free trading apps
- Over 8,000 signals for copying
- Economic news for exploring financial markets
You agree to website policy and terms of use
For copyright issues this article copies directly the code in parts from the original article found at https://www.mql5.com/en/articles/15017 published by @Allan Munene Mutiiria which is originally owned by the author. You should have reserved the courtesy of tagging the original author of the content implemented, which is also found specifically here in YouTube video.
For example:
Original content:
Copyrighted content:
At least you could try to implement your own logic other than just copy and paste not only the logic but also the exact variables used. Here is an example:
Original content:
Copyrighted content:
Clearly some credibility is due to @Allan Munene Mutiiria