
Developing a multi-currency Expert Advisor (Part 7): Selecting a group based on forward period
Introduction
In the previous articles, I have been optimizing individual instances of trading strategies on the same time period - from 2018 to 2022. This is a fairly long period, which surely includes various events affecting the price dynamics. On the other hand, it is not too large and the time of one run remains small enough — within a few tens of seconds. The selected period is arranged so that there is still more than a year left until the current moment in time. This makes it possible to see how the strategy instances will behave in the section of history that was not used when optimizing their parameters.
The standard MetaTrader 5 tester can perform single passes and optimization taking into account the presence of the so-called forward period. When using it, the tester will split the entire specified test period into two parts — main period and forward period. At the end of the main period, all trades are closed and the balance of the trading account is returned to its initial state. Then the EA will work again on the forward period, and all statistics collected by the tester will be calculated separately for the main and forward periods.
In the field of machine learning, the terms In-Sample and Out-Of-Sample (IS and OOS) are often used to refer to the dataset models are trained and tested on. In our area, the main period will play the role of IS, and the forward periodwill be OOS. Keep in mind that OOS is a broader concept than the forward period. We can run EA tests without specifying the forward period in the tester, but if the test period is located outside the period the optimization was carried out on, then this will still be testing on OOS.
Since we have not used OOS testing much in the past (except for the end of this article), then it is time to see whether it is possible to maintain comparable results when working on the forward period, as shown by the EAs on the main period.
Forward period for ready-made EAs
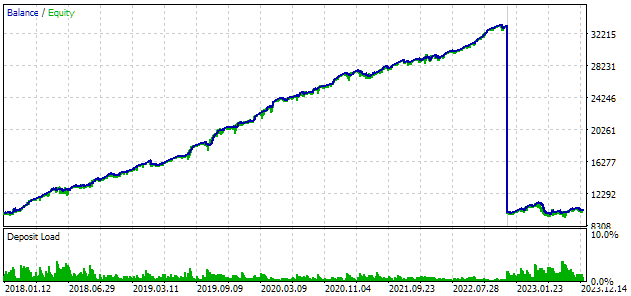
Let's look at the results shown by the EAs from the previous article for a group of manually selected strategies and the best groups of strategies selected automatically based on maximum profit. I will take the entire year of 2023 as the forward period. Three months of 2024 will be left in reserve for now. The result I would like to achieve is a forward period being approximately five times less than on the main period, since the forward is five times shorter than the main period. The drawdown on the forward should preferably be approximately the same or less than on the main period.
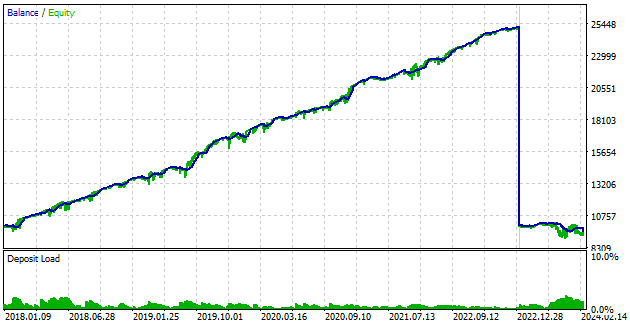
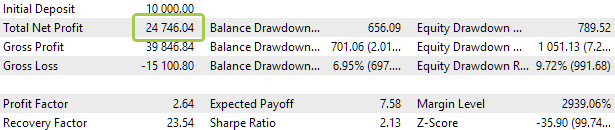
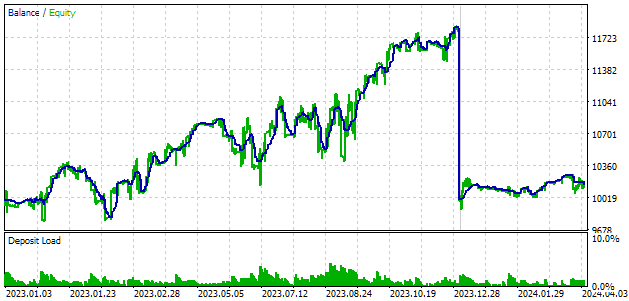
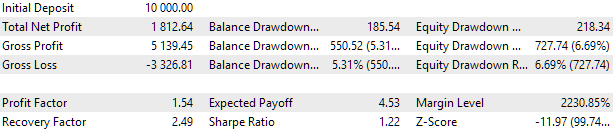
Let's start with a group of manually selected strategies (BaselineExpert.mq5 EA). The vertical section of the blue line clearly separates the main period from the forward period on the graph. At this boundary, the account balance again becomes equal to USD 10,000. The part of the chart that relates to the forward period occupies only a small part of the entire graph. If we need to examine it in more detail, you can run a separate tester pass only on the time interval that refers here to the forward period.
Main period
Forward period
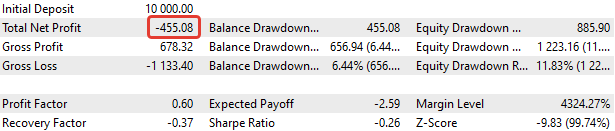
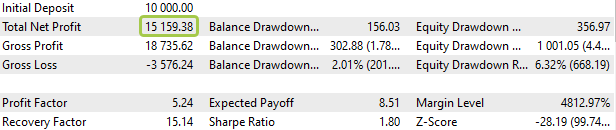
Fig. 1. BaselineExpert.mq5 EA results on the main and forward periods
In this case, we clearly see that the results are significantly worse even without a separate pass for the forward period. This does not mean a complete breakdown of the strategy though. The drawdown increased from 10% to 12% and the recovery period lasted more than six months. But this is not yet a reversal of the balance curve trend. Or is it? No matter how you look at it, the results need improvement.
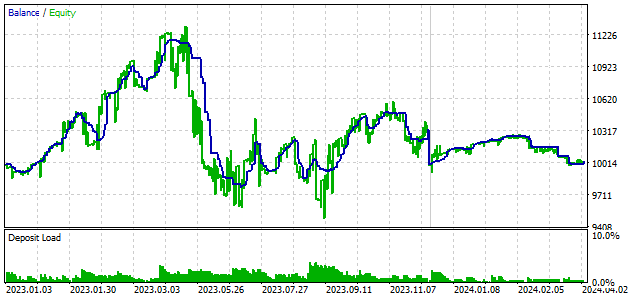
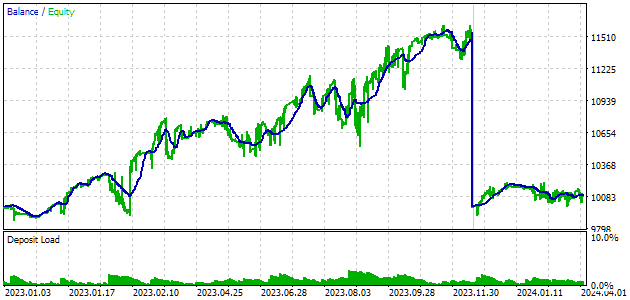
Let's now look at the best group selected without clustering sets (OptGroupExpert.mq5 EA).
Main period
Forward period
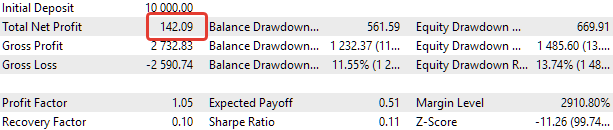
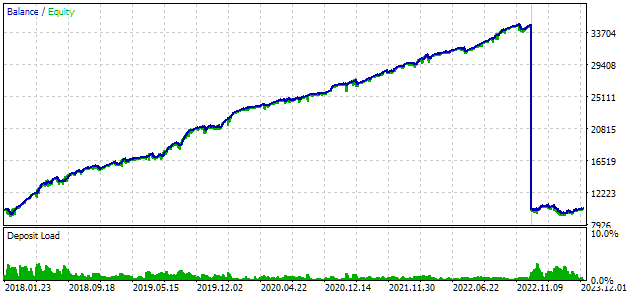
Fig. 2. OptGroupExpert.mq5 EA results on the main and forward periods
For this group of strategies, the results are also significantly worse than expected, despite the fact that a small profit was still made at the end of the forward period. The drawdown has increased by almost one and a half times. It seems that the best group in the main period is no longer than the best group in the forward.
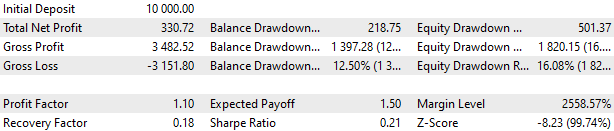
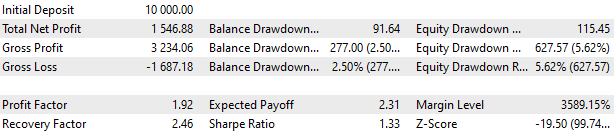
Let's look at the results of the group selected with clustering of parameter sets (OptGroupClusterExpert.mq5 EA), although there is already a strong suspicion that the results will be approximately the same as in the two previous cases.
Main period
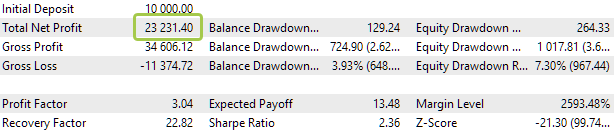
Forward period
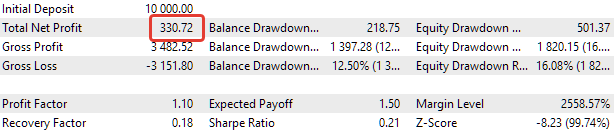
Fig. 3. OptGroupClusterExpert.mq5 EA results on the main and forward periods
Indeed, my suspicion was justified. The results here are just as unclear, with an even greater drawdown. Therefore, we will not present the results for the best group selected from the file, where only one set is left in one cluster. They are about the same.
So, do we have any groups whose results in the forward period satisfy our expectations? To answer this question, we will conduct a new optimization, but with a forward period, so as not to manually launch the EA in the tester on the forward period for all groups of parameter sets obtained during the previous optimization.
Optimization results with forward period
So, we got the optimization results with a forward period for the OptGroupClusterExpert.mq5 EA. The parameter set file used was a file with one set for each of the 64 clusters. For the initial analysis of optimization results, ordinary Excel will probably be sufficient for us. Let's export the optimization results for the main and forward periods to XML files and save them in Excel format:
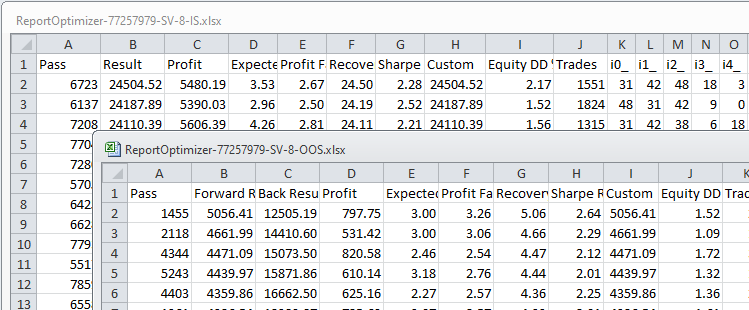
Fig. 4. Source files with optimization results for the main (IS) and forward periods (OOS)
There is the Back Result column in the file for the forward period, which contains the result obtained in the main period with the same set of optimized parameters. This is good, but we would like to see all the other characteristics from the main period next to it. Therefore, we will combine the data from these two tables into one by the Pass key column. The same values in this column correspond to the same combinations of inputs in the pass.
After merging, we will color the data related to the main period and the forward period in different colors, temporarily hide some columns and sort the data in descending order of normalized profit in the main period:
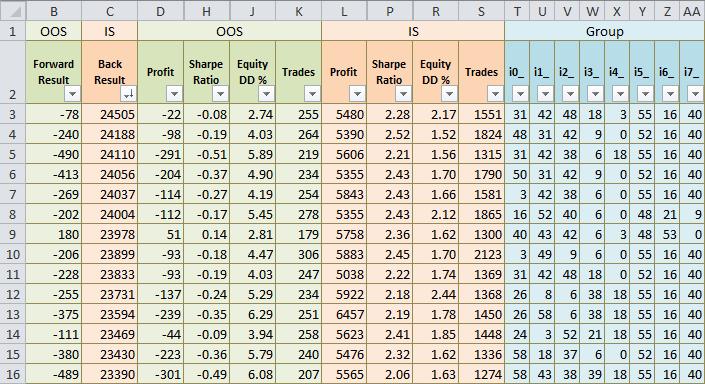
Fig. 5. Combined results for the main and forward periods
It is clear that for the best results in the main period, the results in the forward period are mostly negative. The results are by no means disastrous (losing 3-5% of the initial balance per year), but they are certainly not good.
Let's recall how we get the values in the Forward Result and Back Result columns. This is the result of the OnTester() function returned by the EA after the pass. We call this value normalized profit and calculate it as follows:
Result = Profit * (10% / EquityDD),
wjere Profit is a profit obtained during the test period, EquityDD is a maximum relative drawdown of funds during the test period.
The meaning of this calculated value is the estimated profit over the test period that could be obtained if the size of the opened positions were changed so that the maximum relative drawdown reached 10%.
The parameter results can be compared correctly if the same position scaling factor is used for the forward period and main periods: coeff = (10% / EquityDD). It would be problematic for us to obtain the value of this ratio for the main period during the forward test, so let's make such an adjustment now. The conversion equation will look like this:
ForwardResultCorrected = ForwardResult * (coeff_IS / coeff_OOS)
= ForwardResult * (EquityDD_OOS / EquityDD_IS)
After applying the adjustment, we get the following results:
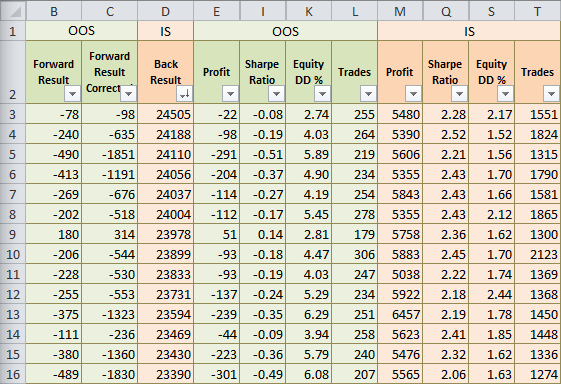
Fig. 6. Results after re-calculating normalized profit in the forward period
We see that the results in the forward period have increased in absolute value. This is correct for the following reasons. Let's imagine that we took, for example, the second set of parameters on the main period. Based on the fact that the drawdown on it was 1.52%, we will increase the position size by 10 / 1.52 = 6.58 times to achieve the target drawdown of 10%. Then, if we do not know anything about the forward period yet, then we would also have to increase the size of positions by 6.58 times. But in this case, if the profit received in the forward period was -98, then the normalized profit should be calculated by multiplying the profit by the same ratio of 6.58. So, we get -635 instead of -240. The value of -240 was smaller because the drawdown in the forward period was almost three times larger (4.03% instead of 1.52%) and when calculating the normalized profit, the ratio was 10 / 4.03 = 2.48, that is, almost three times smaller.
The results are not very pleasant. Let's try to find something more encouraging now. First, let's see if we have any positive results in the forward period at all. Let's sort the data by the Forward Result Corrected column and see the following:
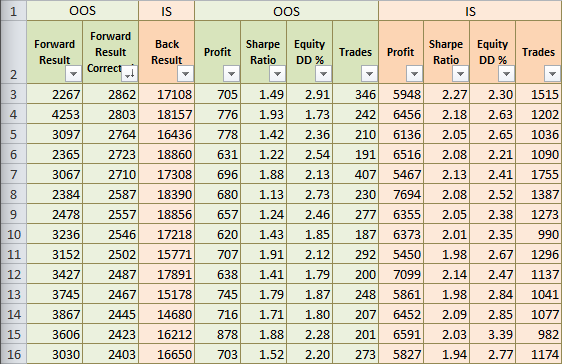
Fig. 7. Results sorted by the forward period result
Still, there are groups of sets that have positive results even in the forward period. They correspond to those groups, for which the standardized profit of approximately 15,000–18,000 is achieved in the main period. We see that here the drawdown does not differ much between the main and forward periods, and the normalized profit in the forward period is approximately one fifth of the normalized profit in the main period.
So, is it possible to choose good groups?
Philosophical question
Actually, this is a very difficult question. It can be formulated in different ways. For example:
- Do we have the right to use selection taking into account the forward period?
- Wouldn't we be fooling ourselves if we hoped that such a choice would allow us to continue to obtain similar results?
- How much can we trust such a choice?
- Will the results be obviously better in the new period for the forward if we selected the group taking into account the forward, compared to the selection without taking it into account?
- For what future period can the results be repeated? Is it comparable to the forward period?
- If we carry out a similar selection procedure, for example, every year, will this mean that we will always have a good group for the next year? What about six months? What about every week?
While they have a common basis, these questions touch upon different aspects.
In order to try to somehow answer these questions, let us recall the Bayesian approach. H First, we formulate a series of hypotheses (or assumptions), then we evaluate their probabilities before receiving new data. After running the experiment, we update our estimates to take into account new data. Some hypotheses become more probable in our eyes, while others become less likely. Here we consider probability as the degree of our confidence in a certain event outcome.
Our main hypothesis will be the following: selecting a group taking into account the forward period improves the results obtained in the period after the forward. Alternative hypothesis: selecting a group taking into account the forward period does not improve results.
One possible experiment would be to select a number of groups taking into account the forward period and several groups without selecting the forward period. Then we test all selected groups in the period after the forward.
If the groups selected with the forward period in mind perform better than the groups selected without the forward period, then this will be weak evidence in favor of the main hypothesis. Our confidence in the validity of the main hypothesis will increase.
If the results for groups selected without taking into account the forward period are approximately the same or better, then this will be weak evidence in favor of the alternative hypothesis. At the same time, we cannot completely reject any of the hypotheses, since the results shown by any group of strategies in the period after the forward depend on many other factors besides the method of selection into groups. It could simply have been an overall bad period for the strategies being used, and therefore one or another method of selecting strategies into groups might not have produced a noticeable effect.
We probably cannot afford more here.
The phrase "taking into account the forward period" may be understood slightly incorrectly. If we apply selection taking into account the forward period, this means that the period that was previously a forward (OOS), now ceases to be an OOS period and becomes an IS period, although we continue to call it a forward period. This means that to evaluate the trading results we need to use a new forward period (forward followed by forward, pardon the tautology).
Let's describe in more detail the experiment we want to conduct to obtain additional information. Let's say we have historical data for the period from 2018 to 2023 inclusive. Based on these, we want to select a group of strategies that will show good results in 2024. Then we can do it in two ways:
- Carry out the optimization on the period 2018-2023 (IS) and select the best group based on its results.
- Perform optimization on 2018-2022 (IS) with simultaneous verification for the forward period 2023 (OOS). Select the best group that provides good and approximately similar results in both periods.
In the second method, we will most likely not select the same group as in the first. Its results will be somewhat worse, but it lasted a year in the OOS period that did not participate in the optimization. In the first method, it is impossible to say something like this about the selected group, since we did not check it outside the IS period. But in the first method, we optimized (trained) the group over a longer period, since in the second method we had to allocate 2022 for the forward period and not use it for the optimization.
Which of these methods will be better? Let's try to conduct such an experiment by comparing the results for groups selected in two ways when trading in 2024.
Selecting using the first method
To select using the first method, we first need to optimize a single copy of the strategy for the period 2018-2023. Previously, we carried out such optimization for the period up to 2022 without including 2023. After the optimization, we will obtain sets of parameters, which we will divide into clusters, as described in the previous article. Then we run optimization to select good groups from eight sets of parameters. Let's look at the results of the best found groups of sets for the period 2018-2023 and 2024:
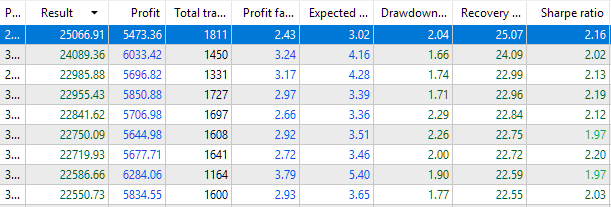
Fig. 8. Results of OptGroupClusterExpert.mq5 optimization to select a group on the main period of 2018-2023
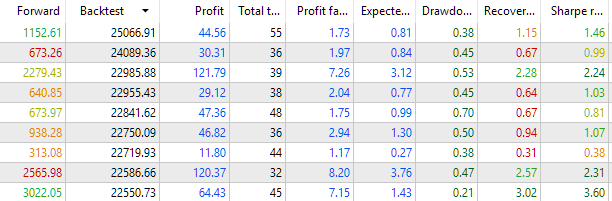
Fig. 9. Results of OptGroupClusterExpert.mq5 to select groups for a period of three months in 2024
We see that the best groups found in the main period for 2018-2023 have generally positive results in the forward period in 2024, but they differ quite significantly from each other. For a more thorough check, select the topmost group, assign it a scaling factor value scale_ = 10 / 2.04 = 5 and run it in the tester on the main period of 2023 and the forward period of 2024.
2023
2024 (3 months)
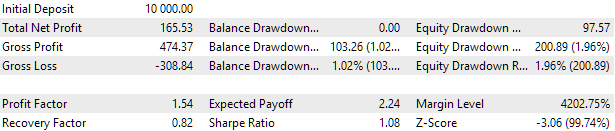
Fig. 10. OptGroupClusterExpert.mq5 EA results for the best group for 2023 and 2024
Based on these results, it is not possible to particularly assess the prospects for the further EA behavior with such a group of sets of strategy parameters, but at least we did not see the onset of a clearly expressed trend towards a decrease in the balance curve in 2024. Let us remember these results and return to them later to compare them with the results obtained using the second selection method.
Selecting using the second method
2023
2024 (3 months)
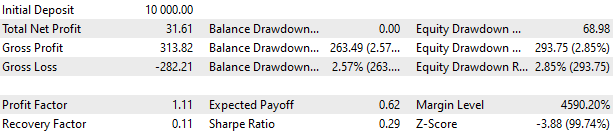
Fig. 11. OptGroupClusterExpert.mq5 EA results for 2023 and 2024
Note that the drawdown for 2023 exceeded the calculated one for the main test period by almost two times: USD 1820 instead of USD 1000.
Use the following algorithm to select into groups, while taking into account 2023 as a forward period:
- In the combined table of optimization results for 2018-2022 (main period) and for 2023 (forward period), calculate the ratio of their values in the main and forward periods for all parameters. For example, in case of the number of trades:
TradesRatio = OOS_Trades / IS_Trades.
The closer these ratios are to 1, the more identical the values of these parameters are in the two periods. For the profit parameter, introduce a ratio that takes into account the different period lengths — in one year, the profit should be approximately 5 times less than in five years:
ResultRatio = OOS_ForwardResultCorrected * 5 / IS_BackResult. - Let's calculate for all these relations the sum of their deviations from unity. This value will be our measure of the difference between the results of each group in the main and forward periods:
SumDiff = |1 - ResultRatio| + ... + |1 - TradesRatio|. -
Also, take into account that the drawdown could be different for each pass in the main and forward periods. Select the maximum drawdown from two periods and use it to calculate the scaling factor for the sizes of positions opened to achieve the standardized drawdown of 10%:
Scale = 10 / MAX(OOS_EquityDD, IS_EquityDD).
-
Now we want to select the sets with the prevalence of Scale over SumDiff. To do this, calculate the last parameter:
Res = Scale / SumDiff.
-
Sort all groups by the value calculated in the previous Res step in descending order. In this case, the groups, whose results in the main and forward periods were more similar and the drawdown in both periods was smaller, find themselves at the top of the table.
- Let's take the group at the top as the first one. To select the next group, sort out all the groups that have the same cluster indices as the first one, and again take the one that ends up at the very top. Let's repeat this a couple of times, now sorting out all the indices that were included in the previously selected groups. We will take the resulting four groups for the new EA.
To test the collaboration of selected groups based on the OptGroupClusterExpert.mq5 EA, create a new one and make some minor changes to it. Since the EA will not be used for optimization, the OnTesterInit() and OnTesterDeinit() functions can be removed from it. We can also remove the inputs that specify the indices of the parameter sets to include in the group, since we will hardcode them in the code based on the selection procedure performed.
In the OnInit() function, create two arrays — strGroups for selected groups and scales - for the group multipliers. strGroups array elements are the strings containing the indices of the parameter sets, separated by commas.
//+------------------------------------------------------------------+
//| Expert initialization function                                   |
//+------------------------------------------------------------------+
int OnInit() {
   // Load strategy parameter sets
   int totalParams = LoadParams(fileName_, params);

   // If nothing is loaded, report an error
   if(totalParams == 0) {
      PrintFormat(__FUNCTION__" | ERROR: Can't load data from file %s.\n"
                  "Check that it exists in data folder or in common data folder.",
                  fileName_);
      return(INIT_PARAMETERS_INCORRECT);
   }

   // Selected set groups
   string strGroups[] = {"55,12,3,35,48,54,16,40",
                         "11,54,33,30,62,6,10,23",
                         "50,15,8,34,2,36,4,9",
                         "26,42,25,22,36,51,53,0"
                        };

   // Scaling factors for selected set groups
   double scales[] = {4.16,
                      3.40,
                      3.33,
                      2.76
                     };

   // Set parameters in the money management class
   CMoney::DepoPart(expectedDrawdown_ / 10.0);
   CMoney::FixedBalance(fixedBalance_);

   // Create an EA handling virtual positions
   expert = new CVirtualAdvisor(magic_, "SimpleVolumes_OptGroupForwardCluster");

   CVirtualStrategyGroup *groups[ArraySize(strGroups)];

   FOREACH(strGroups, {
      // Form the string from the parameter set indices separated by commas
      string strIndexes = strGroups[i];

      // Turn the string into the array
      string indexes[];
      StringSplit(strIndexes, ',', indexes);

      // Create and fill the array of all strategy instances
      CVirtualStrategy *strategies[];

      FOREACH(indexes, {
         // Remove the cluster number from the parameter set string
         string param = CSVStringGet(params[StringToInteger(indexes[i])], 0, 11);
         // Add a strategy with a set of parameters with a given index
         APPEND(strategies, new CSimpleVolumesStrategy(param))
      });

      // Add the strategy to the next group of strategies
      groups[i] = new CVirtualStrategyGroup(strategies, scales[i]);
   });

   // Form and add the group of strategy groups to the EA
   expert.Add(CVirtualStrategyGroup(groups, scale_));

   return(INIT_SUCCEEDED);
}
Save this code in the OptGroupForwardClusterExpert.mq5 file of the current folder.
Let's look at the EA test results. Just like last time, we will combine two periods in one pass - 2023 and the first three months of 2024.
2023
2024 (3 months)
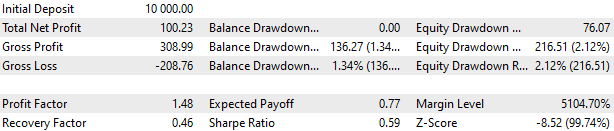
Fig. 12. OptGroupClusterForwardExpert.mq5 EA results for 2023 and 2024
Here, the results for 2023 are clearly better: the rising trend is observed throughout the entire period, although there is also a period from March to July when the balance curve did not show any significant growth. The drawdown during this period also improved and is within the maximum expected limits.
The results for 2024 are also better, but not particularly amazing. Perhaps, three months is a too short period for the graph to look as beautiful as over a long period of several years.
If we compare these results with the results for the first method of selecting good groups, no clear advantage is yet visible for any of these methods. The results are generally quite similar, but the second method required more effort from us compared to the first one. However, since we have clearly outlined the algorithm of actions for the second selection method, it can be automated in the future.
Conclusion
As we can see, the conducted experiment did not increase our confidence that it is better to allocate an additional period as a forward and select groups taking into account the best work in both periods. But that does not mean this approach should not be used. Besides, we only used three months from 2024 for comparison. This is too short a period, since we have seen that the trading strategy used can have periods of balance growth fluctuations around zero lasting up to several months. Therefore, it is not clear whether the first three months of 2024 represent the beginning of such a period, which will then be replaced by growth, or there may not be any growth at all.
We could try to conduct a similar experiment by moving the periods back one year. In this case, the main period will begin in 2017, the selection by the second method will be carried out in 2022, and for comparison of the two methods we will have all of 2023 and the beginning of 2024.
However, we will move further. Nothing stops us from selecting some of the groups using the first method, while selecting others using the second one, and combine them in one EA. But what is the maximum number of trading strategy instances we can combine in one EA so that its operation does not take up too many server resources and does not require abnormally high amounts of RAM? I will try to clarify this issue in one of the following articles.
Thank you for your attention and stay tuned!
P.S. I have not made any changes to the previously created files while preparing this article. I have added only one new file. So it is the only one attached below. You can find all other files mentioned in the previous article.
Translated from Russian by MetaQuotes Ltd.
Original article: https://www.mql5.com/ru/articles/14549
 Features of Experts Advisors
- Free trading apps
- Over 8,000 signals for copying
- Economic news for exploring financial markets
You agree to website policy and terms of use