
Learn how to design a trading system by RSI
Introduction
I think many of those connected with the trading world have ever heard the phrase “Trend is your friend”. It means you should trade with the trend and should not trade against the trend. Yes, sometimes we may trade against the trend during corrections and if you don’t know what corrections are don’t worry — I will explain them and trends in the few coming lines. What I want you to know is that even if we trade against the trend, we have to take care and manage the risk strictly as these kinds of trades will be riskier.
We will talk here about the trends which can exist in markets. I already mentioned them in different articles, and here is why I repeat them in different areas so often:
- It is important to identify the market movement as according to it we will take our decisions.
- Repeating may deepen the understanding and give different insights, especially if something is mentioned in a different contexts and different ways.
- It may be the first time you are reading my article, and so I would like to give a complete view about the subject of this specific article.
It is necessary to identify the market direction or trends. Before learning how to do that, we should understand clearly what each one of them means.
If you look at the market, you will see that there can be three different directions in the market, according to price action or price movements: Uptrend, Downtrend, and Sideways. Each of these market trends has a controlling status according to market participants.
- Uptrend:
During the uptrend, buyers control the market most of the time and this make the rally of prices. So, the prices move up by making higher lows and higher highs.
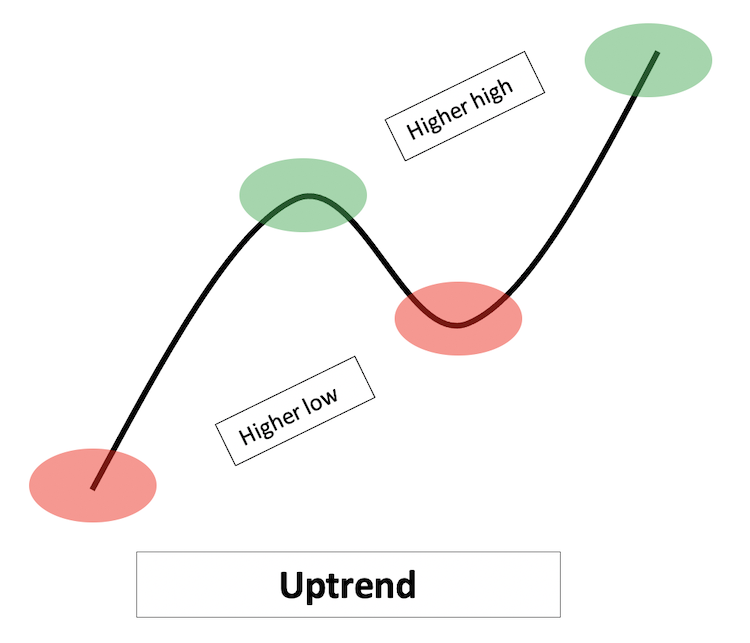
- Downtrend:
During the downtrend, sellers control the market most of the time and this make the slide of prices. So, the prices move down by making lower highs and lower lows.
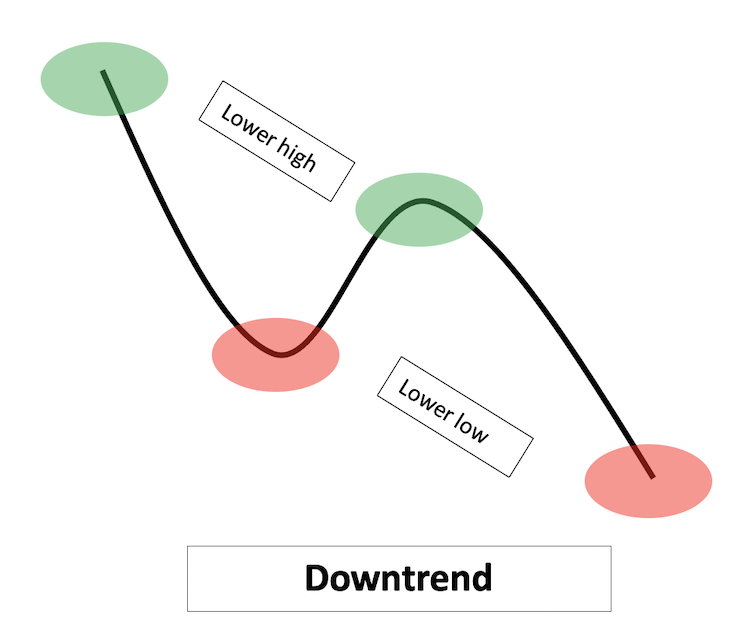
- Sideways:
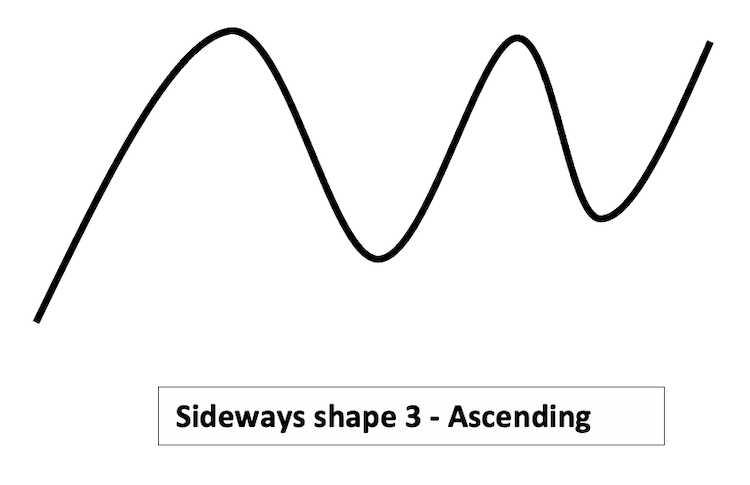
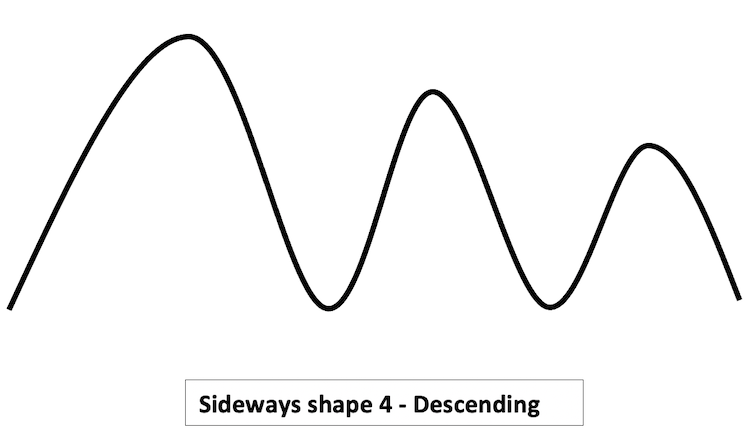
During sideways, there is mainly a balance between buyers and sellers without a complete control from any of the parties. It is any movement except uptrend and downtrend. Below are some forms of these sideways movements
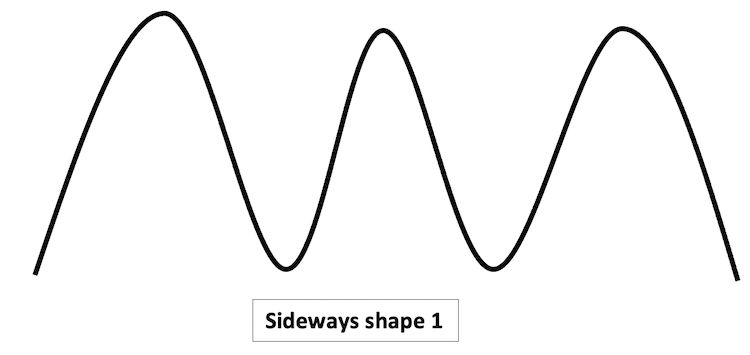
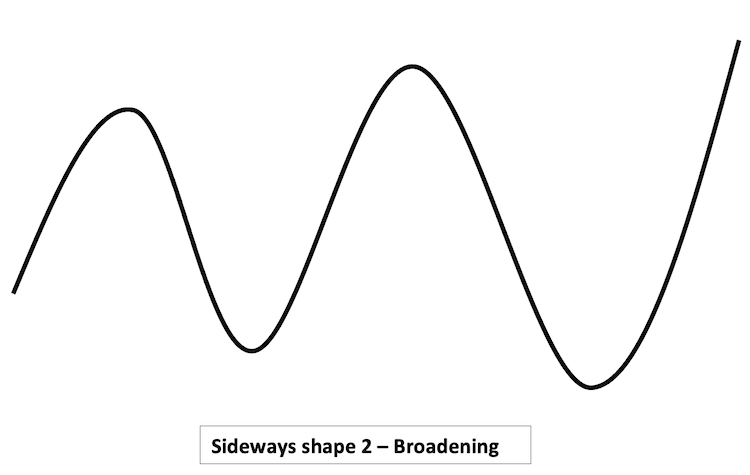
After identifying these types of trends, we should find out more about the trend: if it is strong or weak, which can be found out through the concept of momentum. Momentum is a concept that can measure the velocity of the market direction or trend. This momentum concept is very important in trading and in market movements. There are many tools which are based on this concept. In this article, we will consider one of them, which is one of the most commonly used indicators — RSI (Relative Strength Index). We will see how to use this useful tool easily and effectively by creating a trading system for some of RSI strategies. In this article, we will consider the following topics:
Through these topics, we will learn a lot about this useful tool. We will see what the RSI is and how it is calculated. Some insights and new ideas around the concept of the indicator will be considered in the RSI definition part. Then, we will consider some RSI strategies which can be useful for trading. In the RSI Blueprint part, we will learn blueprints of mentioned RSI strategies to be ready for programming and to identify what the program should be doing. Finally, we will see how to write an RSI-based program which will help us trade easily and effectively and help us improve out trading decisions.
Throughout this and all other articles, we use the MetaTrader 5 trading platform and the MetaQuotes Language Editor MetaEditor which is built-in in Meta Trader 5 — all program codes will be written using this editor.
You can download MetaTrader 5 from the following link: https://www.metatrader5.com/en/download
For more information about how to do it, please see my previous article: Learn Why and How to Design Your Algorithmic Trading System
Disclaimer: All content of this article is made for the purpose of education only not for anything else. So, you will be responsible for any action you take based on the content of this article, as the content of this article does not guarantee any kind of results.
Now, let us to go through this interesting article in order to understand and build another new block in our trading success journey.
RSI definition
RSI — Relative Strength Index — is an indicator created by Welles Wilder. The main objective for this indicator is to measure the strength of an instrument now against its history. To do it, the indicator compares price changes of up days to down days.
The RSI indicator is a momentum as it shows the velocity of the upward or downward market movement, is an oscillator as it is bounded and oscillates between 0 and 100 level, and is a leading indicator as it can lead prices and show a potential movement before it happens. The RSI is designed so as to overcome two problems in momentum indicators, which are the ability to absorb sudden or erratic movements and the ability to be bounded as it ranges from 0 to 100.
RSI can be useful as it shows:
- Potential movements which cannot be seen on the chart alone.
- Clear support and resistance levels.
- Divergence signals which can be an indication for reversals, by divergence which can be shown between RSI and price.
- Failure swings above 70 level and below 30 level, which warns potential reversals.
The calculation and construction of the RSI indicator is implemented through the following steps:
- Get positive or up movements of 14 closes
- Get negative or down movements of 14 closes
- AVG of 14 of positive movements = Sum of positive movements / 14
- AVG of 14 of negative movements = Sum of negative movements / 14
- RS = AVG of 14 of positive movements / AVG of 14 of negative movements
- RSI = 100 - [100 /(1+RS)]
Let’s take an example to understand how to do that.
- Suppose we have 14 days closes as follows:
| Days | Price |
|---|---|
| 1 | 100 |
| 2 | 105 |
| 3 | 120 |
| 4 | 110 |
| 5 | 100 |
| 6 | 115 |
| 7 | 120 |
| 8 | 130 |
| 9 | 125 |
| 10 | 135 |
| 11 | 140 |
| 12 | 130 |
| 13 | 140 |
| 14 | 145 |
So, if we need to calculate RSI, it will be as follows:
First, we will calculate the positive movement and the negative movement by subtracting each day from its previous:| Days | Price | Positive Movements | Negative Movements |
|---|---|---|---|
| 1 | 100 | 0 | 0 |
| 2 | 105 | 5 | 0 |
| 3 | 120 | 15 | 0 |
| 4 | 110 | 0 | 10 |
| 5 | 100 | 0 | 10 |
| 6 | 115 | 15 | 0 |
| 7 | 120 | 5 | 0 |
| 8 | 130 | 10 | 0 |
| 9 | 125 | 0 | 5 |
| 10 | 135 | 10 | 0 |
| 11 | 140 | 5 | 0 |
| 12 | 130 | 0 | 10 |
| 13 | 140 | 10 | 0 |
| 14 | 145 | 5 | 0 |
- Sum of Positive Movements = 80
- Sum of Negative Movements = 35
- AVG of 14 of Positive Movements = Sum of Positive Movements / 14
- AVG of 14 of Positive Movements = 80 / 14 = 5.7
- AVG of 14 of Negative Movements = Sum of Negative Movements / 14
- AVG of 14 of Negative Movements = 35 / 14 = 2.5
- Then, we will calculate RS:
- RS = AVG of 14 of Positive Movements / A VG of 14 of Negative Movements
- RS = 5.7 / 2.5 = 2.29
- Then, we will calculate RSI:
- RSI = 100 - [100 / (1 + RS)]
- RSI = 100 - [100 / (1 + 2.29)] = 69.57
- Get Next AVG movement:
- Next AVG of Positive Movements = [{(Previous AVG of Positive Movements * 13) + Today's Positive Movements (if existing)}/14]
- Next AVG of Negative Movements = [{(Previous AVG of Negative Movements * 13) + Today's Negative Movements (if existing)}/14]
- Get RS:
- RS = Next AVG of Positive Movements / Next AVG of Negative Movements
- Get RSI:
- RSI = 100 - [ 100 / (1+ RS)]
- The RSI period
- The price type based on which the indicator will be calculated
- The color of the RSI line
- The style of the RSI line
- The thickness of the RSI line
- 0 level: the lowest value of the indicator range, which limits the possible indicator values.
- 100 level: the highest value of the indicator range, which limits the possible indicator values.
- 30 level: oversold area.
- 70 level: overbought area.
- RSI Value < 50 = Buy
- RSI Value > 70 = Take Profit
- RSI Value > 50 = Short
- RSI Value < 30 = Take Profit
- During Sideways:
- RSI Value < 30 = Buy
- RSI Value > 50 = Take Profit
- RSI Value > 70 = Short
- RSI Value < 50 = Take Profit
- RSI Uptrend Strategy:
- RSI Downtrend Strategy:
- RSI Sideways Strategy:
Then, we will calculate 14 Average for positive and negative movements:
So, the results are as follows:
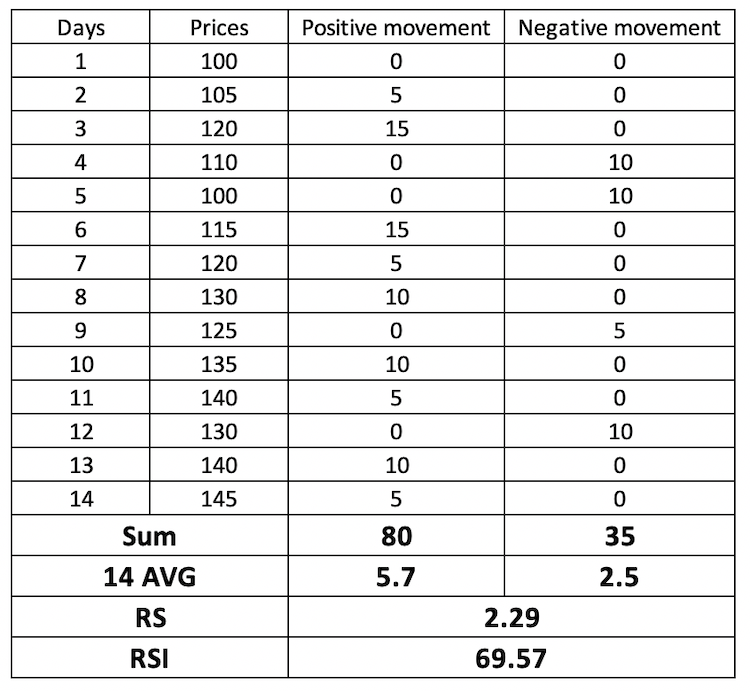
The previous steps calculate the first RSI value. The following steps calculate RSI after the first calculated value:
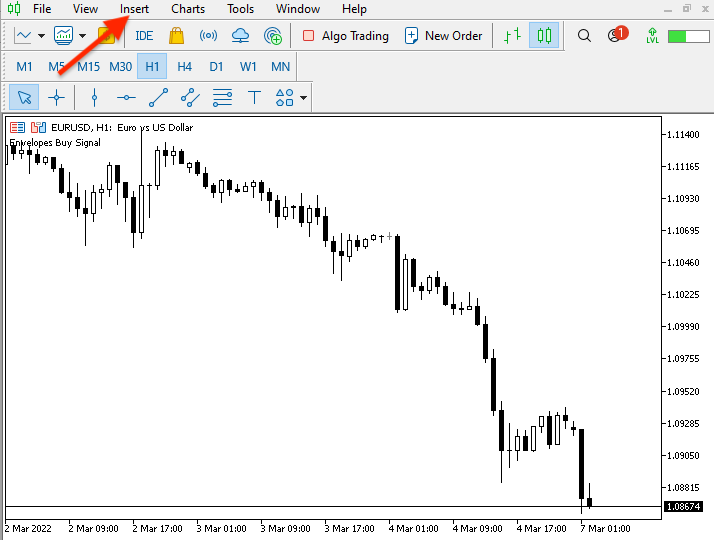
Thus, the RSI indicator is calculated using the above steps. However, you will not have to calculate it manually, and the calculation details are provided here only to help you understand the construction of the RSI. This may give more effective insights about how to use it to get better results in trading. The MetaTrader 5 platform provides a ready-to-use built-in RSI indicator, so you don't need to calculate it. Instead, you can immediately start using it by running the indicator on the chart. The following image shows how to do that.
Follow a few steps in the Meta Trader 5 trading terminal:
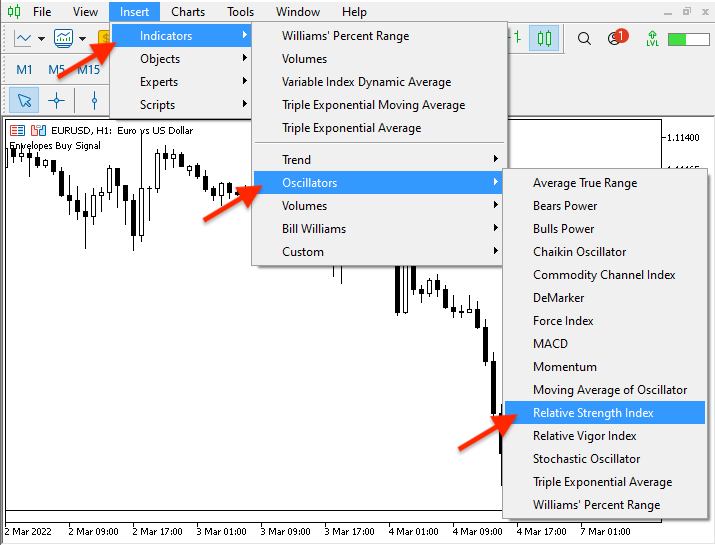
Once you choose the Relative Strength Index (RSI) from the list of oscillators, the following window will appear for the indicator parameters:
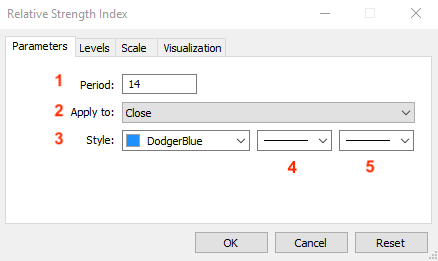
Select the preferred parameters and click OK. The RSI indicator will be displayed on the chart as follows:
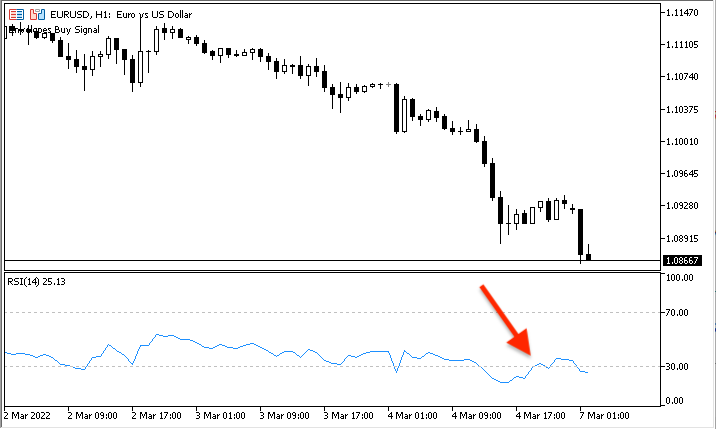
The RSI indicator is displayed in a separate window, below the main chart. The window has four price levels, which denote the following:
There is another level which is not displayed by default: it is the level at the middle of the range, which is equal to 50.
RSI strategy
In this part, we will see how to use RSI - Relative Strength Index - indicator. For this, we will use a simple strategy, which will be different according to different market direction.
We will see how RSI can be used during uptrend, downtrend, and sideways. The specific usage is directly related to the overbought are, the mid range, and the oversold area. First we need to understand how RSI moves during different trends or movements as we can see clearly that RSI moves differently with each trend or movement. Then we will use a simple strategy which can be used during each one of trends — the main objective is to learn how to use it and to give new insights and open our eyes to new ideas that can be useful for our trading. In this part, we will see how RSI reacts to each trend or movement type. However, please pay attention that the strategies are provided for information only, to show how the RSI can be applied to analyze market data. You always should test every strategy that you want to use in your trading, as some strategies may not be suitable for your trading style especially, especially when it comes to educational strategies.
In this case, most of the time RSI values move between or moving between the mid range and level 70 (Overbought level).
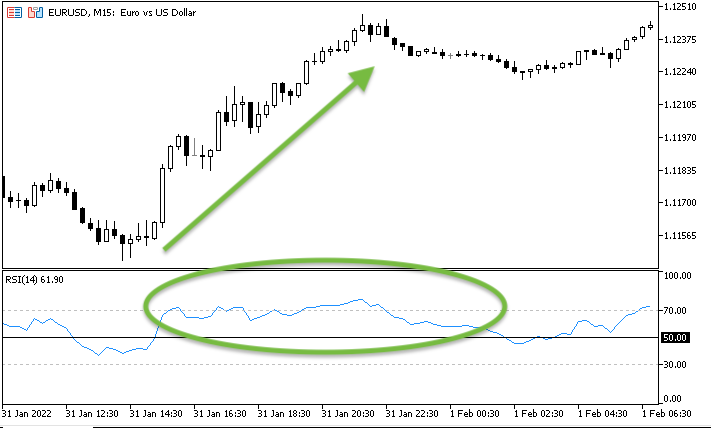
The trading strategy for the uptrend is:
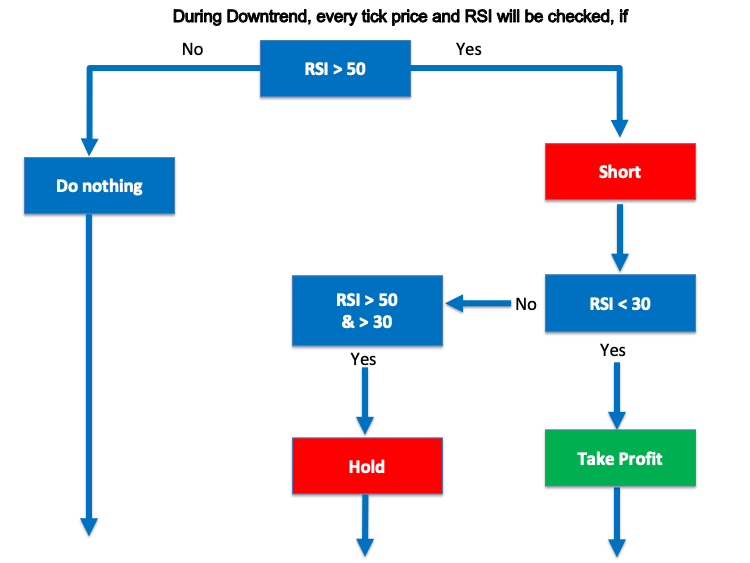
During the downtrend, the RSI moves most of the time between the mid range and level 30 (Oversold level).
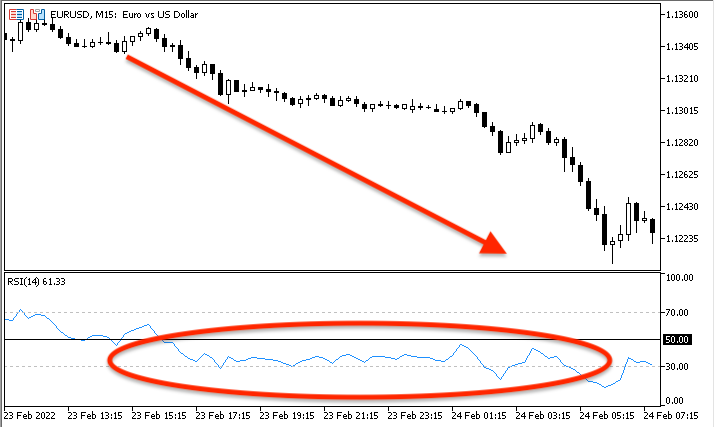
The trading strategy will be as follows:
RSI spends most of the time between levels 30 (Oversold level) and 70 (Oversbought level).
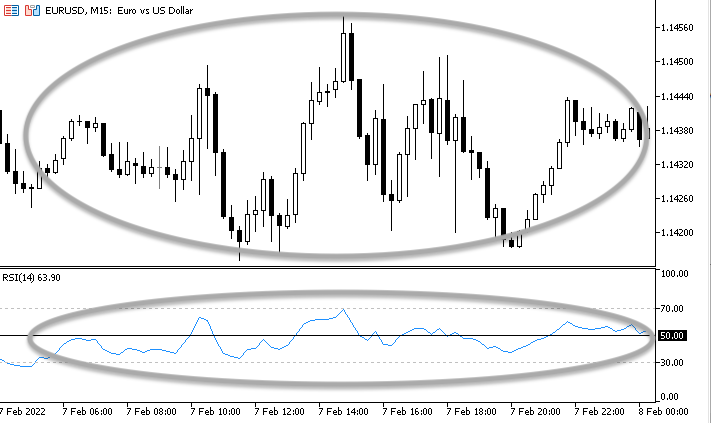
The trading strategy will be as follows:
RSI blueprint
This topics shows the instructions which should be given to the computer when trading a strategy based on the RSI.
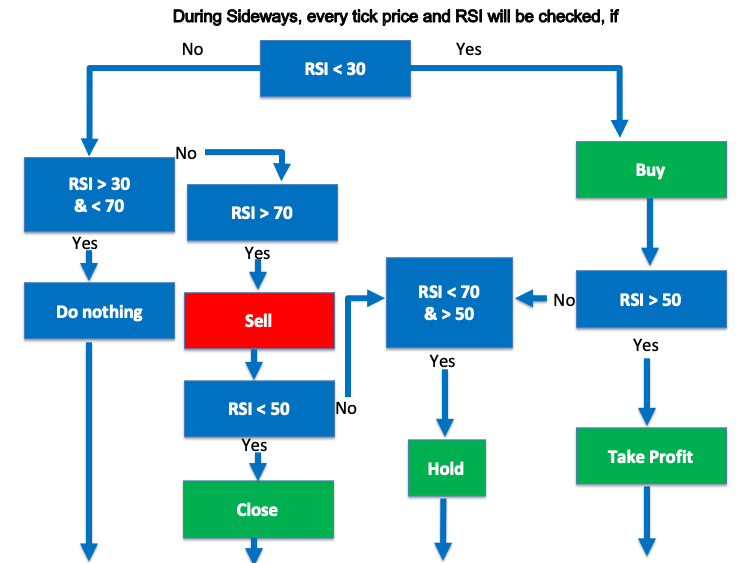
We have already considered 4 strategies which should be implemented as trading systems: RSI Uptrend Strategy, RSI Down Strategy, and RSI Sideways Strategy (Buy, Short). The following blueprints show the instructions for each of the strategies.
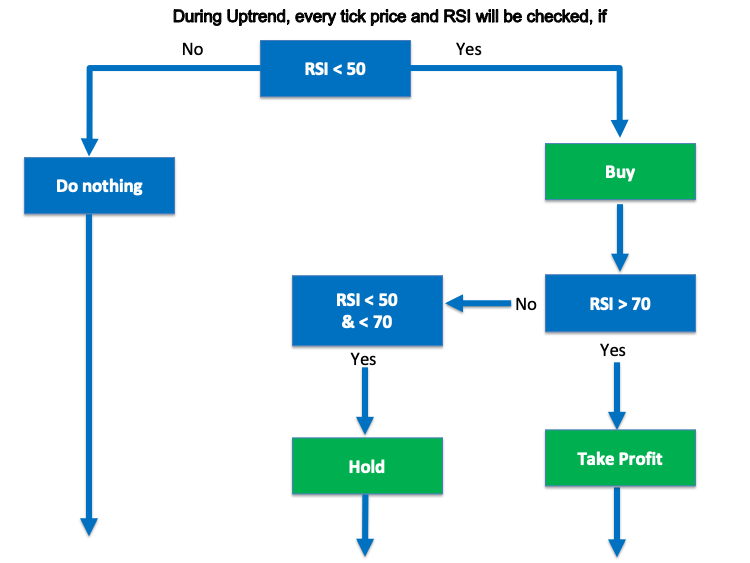
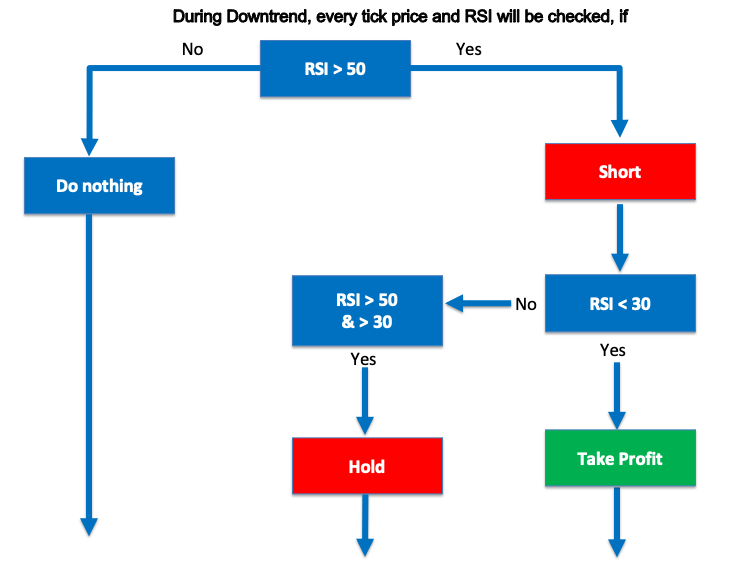
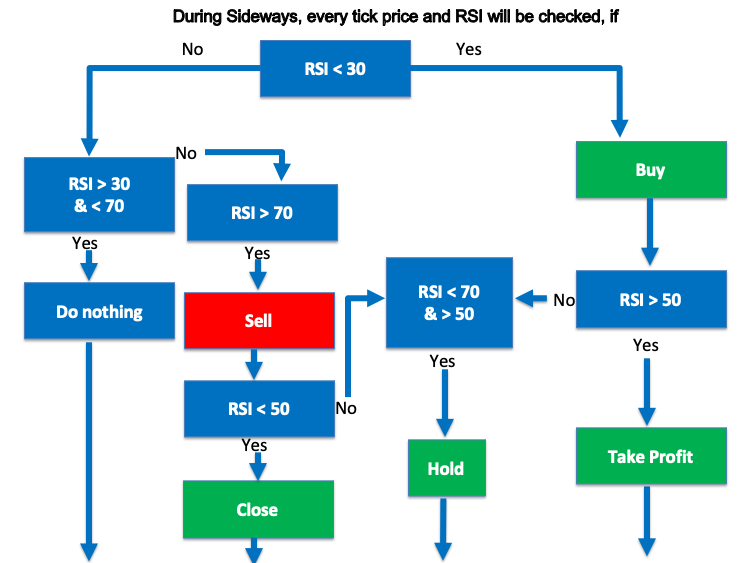
I think they are clear enough. Now that we have prepared blueprints for each strategy which should be implemented in a trading system, we can move on to writing a program. Let's move on to the next part of this article and create the trading system code.
RSI trading system
Now let us see how to write the code of a trading system based on the RSI trading strategies considered above. First, open the MetaTrader 5 trading terminal, then to open IDE (MetaQuotes Language Editor) to write the codes, by pressing F4 or by following the steps shown in the following pictures:
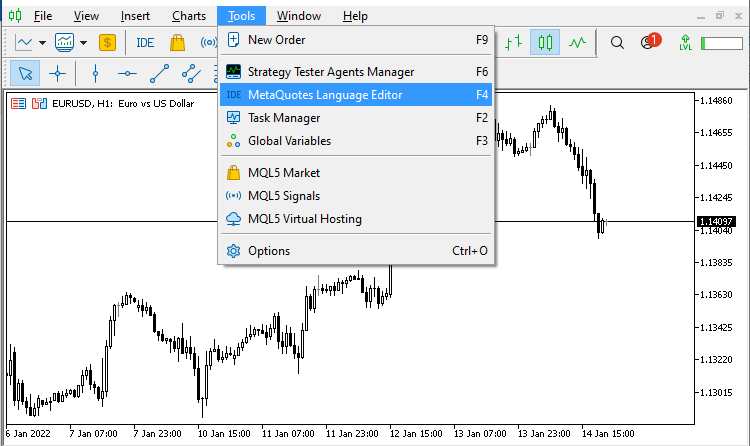
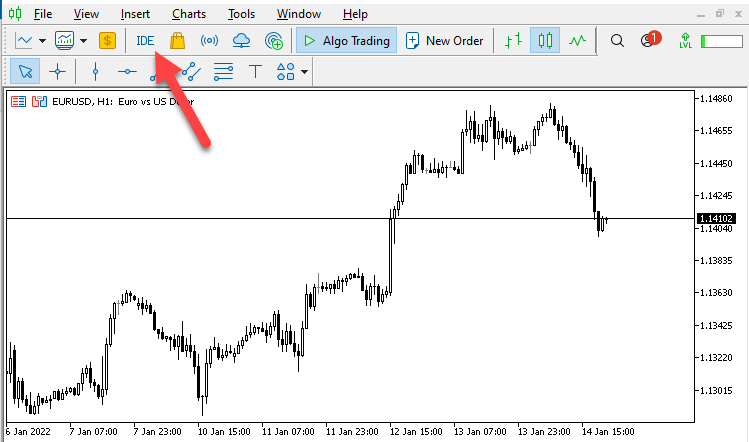
Or you can click on the IDE button on the MetaTrader 5 toolbar:
The following window will appear in the newly opened MetaEditor IDE:
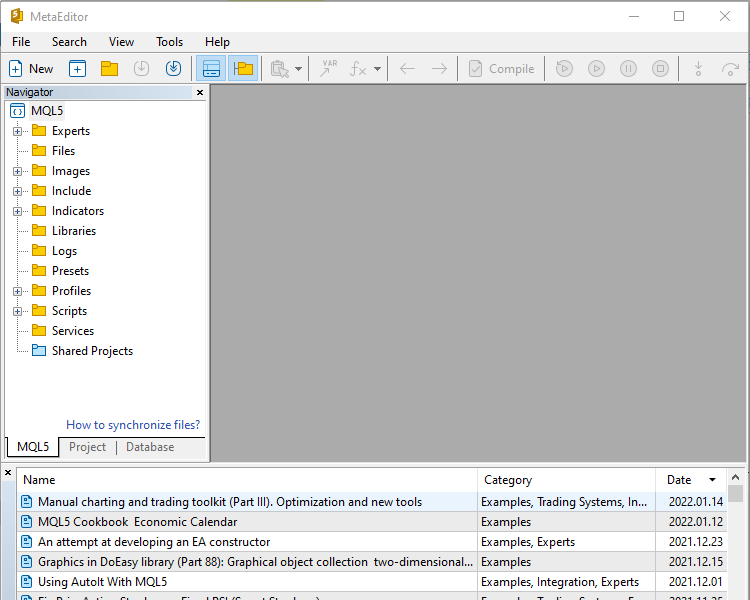
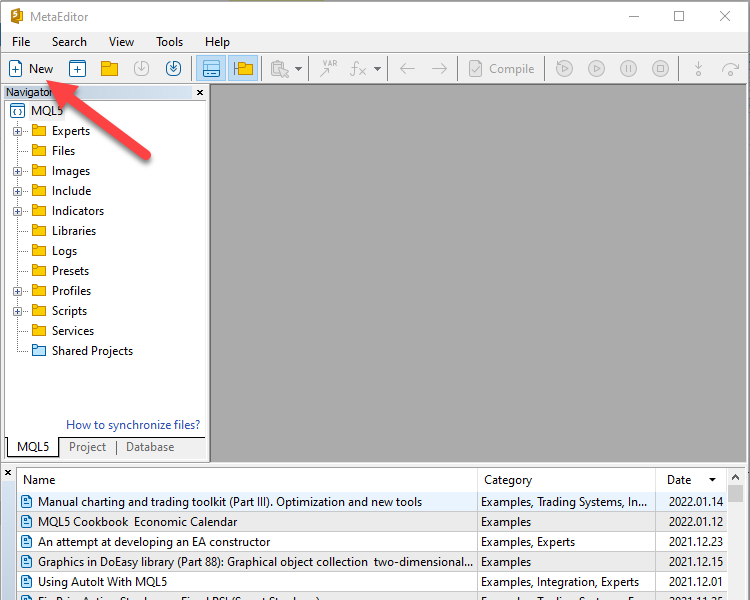
Create a new file, in which you will write the code of the trading system:
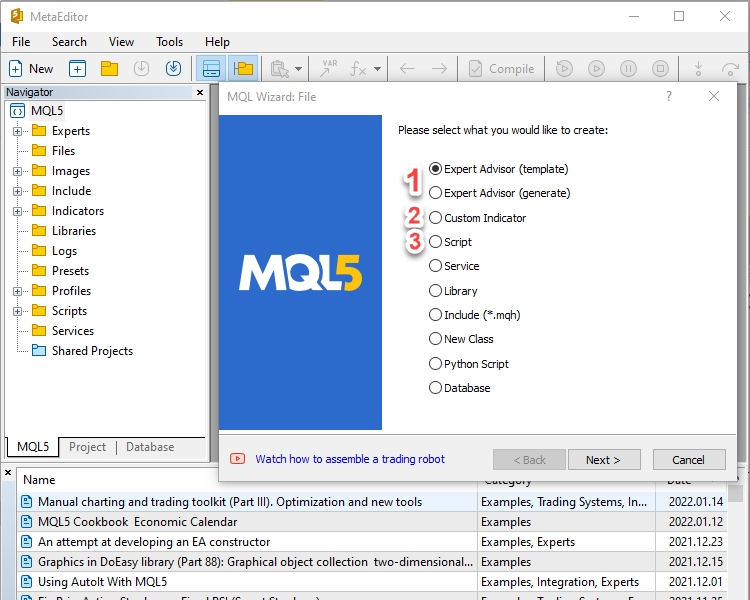
Select the first option to create a new Expert Advisor file. If you want to learn more about other options, you can read my previous article: Learn Why and How to Design Your Algorithmic Trading System
First I would like to share a simple RSI-based Expert Advisor to comment RSI values on the chart to understand how to design a simple pure RSI system:
//+------------------------------------------------------------------+
//|                                            Simple RSI System.mq5 |
//|                                  Copyright 2022, MetaQuotes Ltd. |
//|                                             https://www.mql5.com |
//+------------------------------------------------------------------+
#property copyright "Copyright 2022, MetaQuotes Ltd."
#property link      "https://www.mql5.com"
#property version   "1.00"

//+------------------------------------------------------------------+
//| Expert tick function                                             |
//+------------------------------------------------------------------+
void OnTick()
  {
   //Creating array for prices
   double RSIArray[];

   //Identying RSI properties
   int RSIDef = iRSI(_Symbol, _Period, 14, PRICE_CLOSE);

   //Sorting prices array
   ArraySetAsSeries(RSIArray,true);

   //Identifying EA
   CopyBuffer(RSIDef,0,0,1,RSIArray);

   //Calculating EA
   double RSIValue = NormalizeDouble(RSIArray[0],2);

   //comment with RSI value on the chart
   Comment("RSI Value is ",RSIValue);

  }
//+------------------------------------------------------------------+
Here is how we can execute the created program:
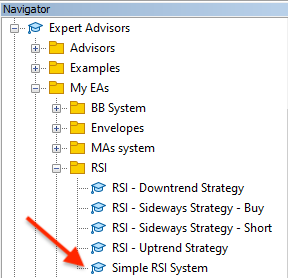
Double click on the file or drag it and drop on the chart, after which the following window will appear:
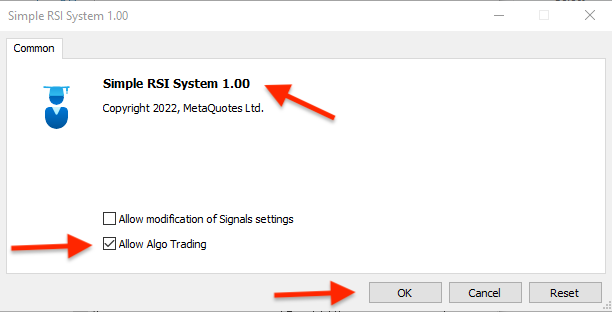
Click Ok and the program will be launched on the chart:
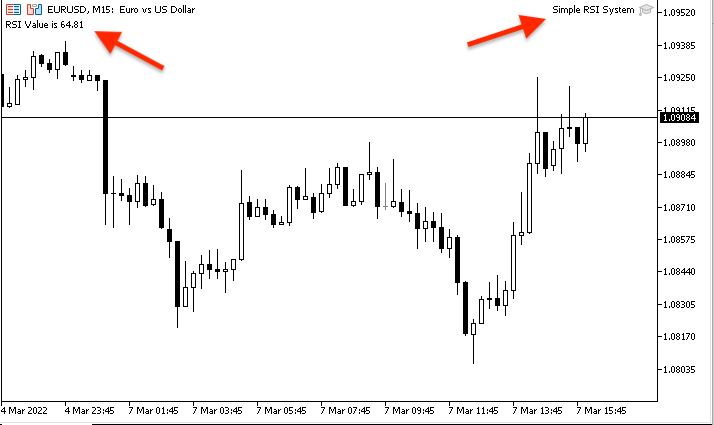
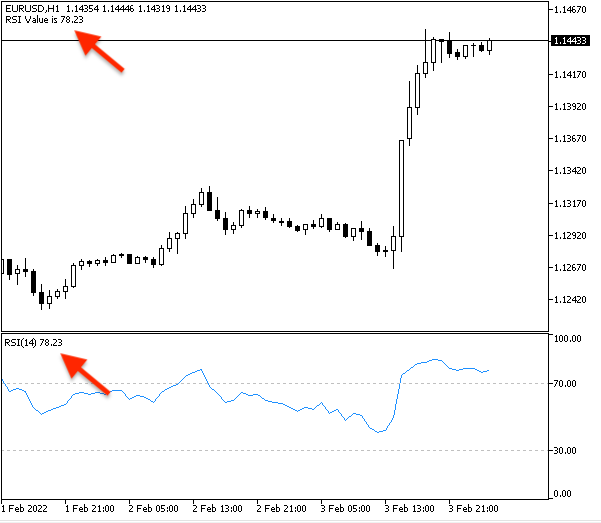
- RSI Uptrend Strategy:
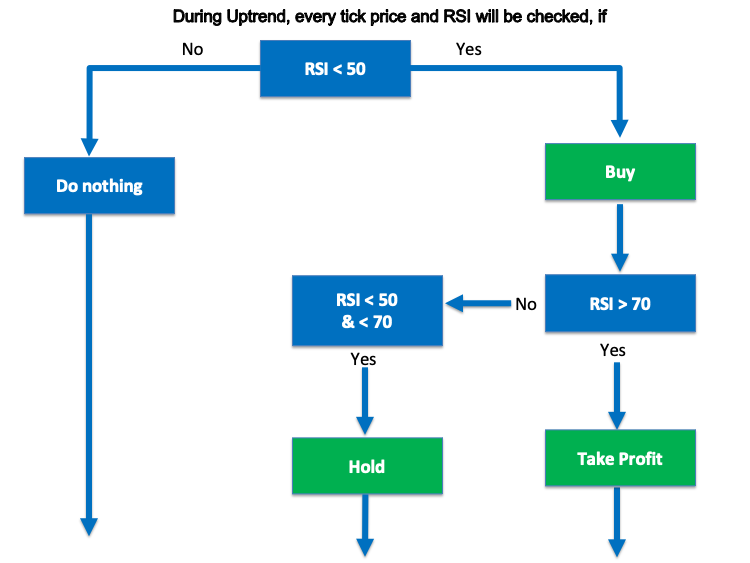
Here is the code:
//+------------------------------------------------------------------+
//|                                       RSI - Uptrend Strategy.mq5 |
//|                                  Copyright 2022, MetaQuotes Ltd. |
//|                                             https://www.mql5.com |
//+------------------------------------------------------------------+
#property copyright "Copyright 2022, MetaQuotes Ltd."
#property link      "https://www.mql5.com"
#property version   "1.00"

//+------------------------------------------------------------------+
//| Expert tick function                                             |
//+------------------------------------------------------------------+
void OnTick()
  {
   //Creating array for prices
   double RSIArray[];

   //Identying RSI properties
   int RSIDef = iRSI(_Symbol, _Period, 14, PRICE_CLOSE);

   //Sorting prices array
   ArraySetAsSeries(RSIArray,true);

   //Identifying EA
   CopyBuffer(RSIDef,0,0,1,RSIArray);

   //Calculating EA
   double RSIValue = NormalizeDouble(RSIArray[0],2);

   //Creating signal according to RSI
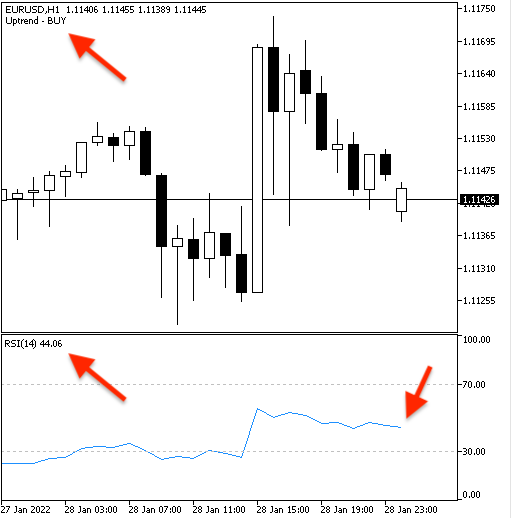
   if(RSIValue<50)
   Comment ("Uptrend - BUY");

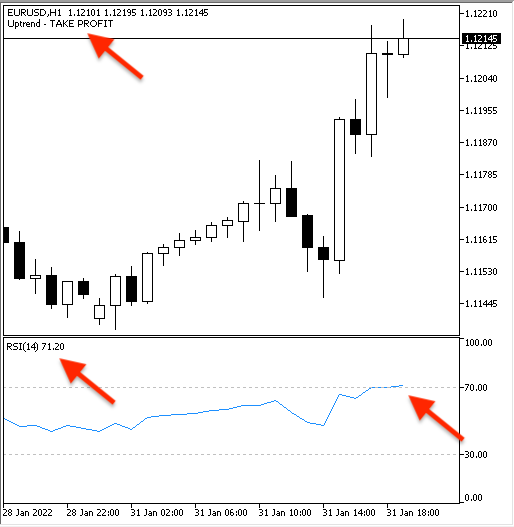
   if(RSIValue>70)
   Comment ("Uptrend - TAKE PROFIT");
  }
//+------------------------------------------------------------------+
Run this program on the chart from the Navigator window as is shown below. Make sure there are no errors or warnings:
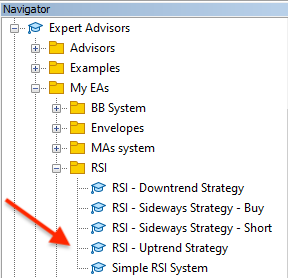
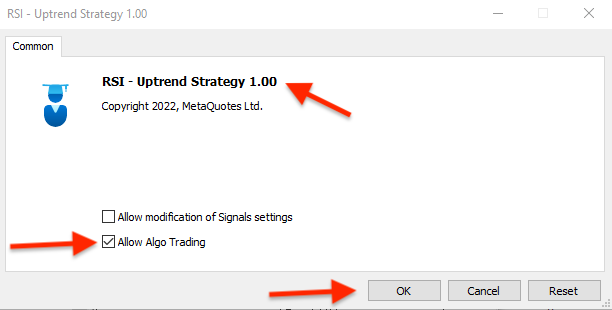
Double click or drag and drop the file on the chart, click ok in the program window, and the program will be launched on the chart:
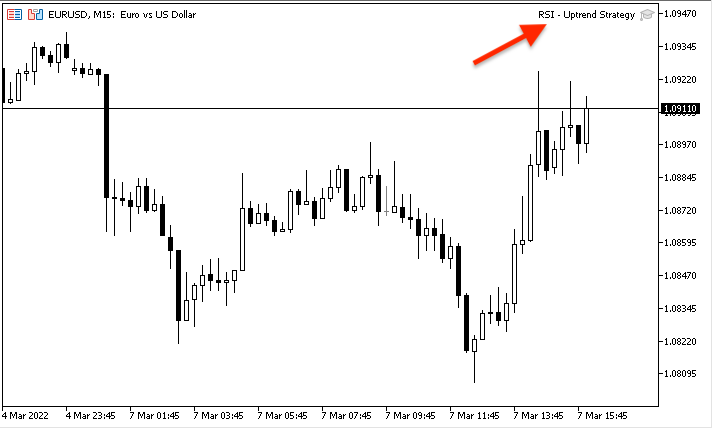
The program signals will be as follows:
- Buy signal:
- Take Profit signal:
- RSI Downtrend Strategy:
The code is:
//+------------------------------------------------------------------+
//|                                     RSI - Downtrend Strategy.mq5 |
//|                                  Copyright 2022, MetaQuotes Ltd. |
//|                                             https://www.mql5.com |
//+------------------------------------------------------------------+
#property copyright "Copyright 2022, MetaQuotes Ltd."
#property link      "https://www.mql5.com"
#property version   "1.00"

//+------------------------------------------------------------------+
//| Expert tick function                                             |
//+------------------------------------------------------------------+
void OnTick()
  {
   //Creating array for prices
   double RSIArray[];

   //Identying RSI properties
   int RSIDef = iRSI(_Symbol, _Period, 14, PRICE_CLOSE);

   //Sorting prices array
   ArraySetAsSeries(RSIArray,true);

   //Identifying EA
   CopyBuffer(RSIDef,0,0,1,RSIArray);

   //Calculating EA
   double RSIValue = NormalizeDouble(RSIArray[0],2);

   //Creating signal according to RSI
   if(RSIValue>50)
   Comment ("Downtrend - SHORT");

   if(RSIValue<30)
   Comment ("Downtrend - TAKE PROFIT");
  }
//+------------------------------------------------------------------+
Run this program on the chart from the Navigator window as is shown below. Make sure there are no errors or warnings:
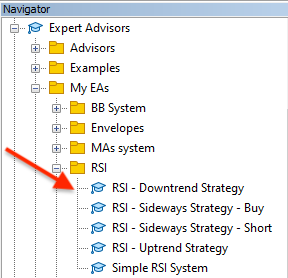
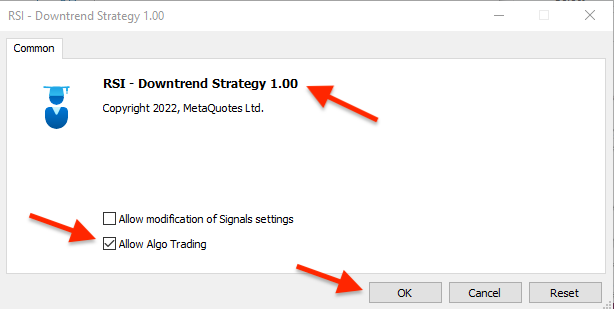
Double click or drag and drop the file on the chart, click ok in the program window, and the program will be launched on the chart:
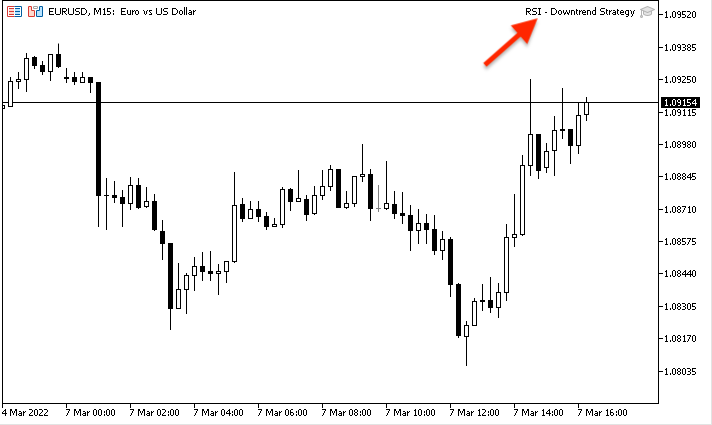
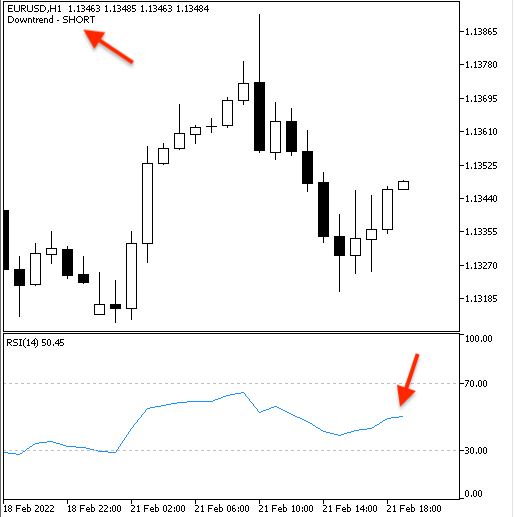
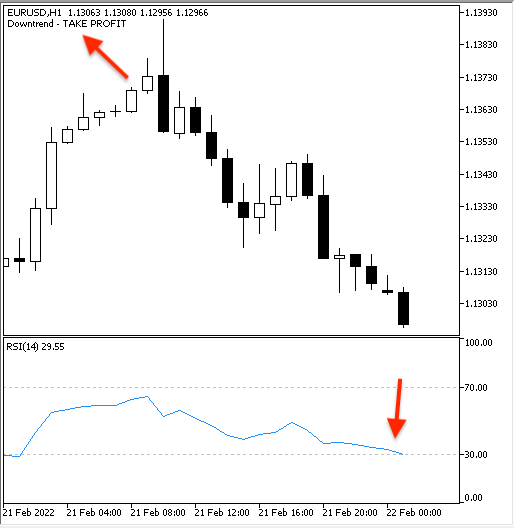
The running program will generate signals as is shown further:
- Short signal:
- Take Profit signal:
- RSI Sideways Strategy:
And the following is the code of this strategy. I will divide the strategy into two separated codes and programs for better understanding: one will be for Buy signal and its take profit and the other will be for Short signal and its take profit and both of them are during sideways:
- Buy signal
//+------------------------------------------------------------------+
//|                                RSI - Sideways Strategy - Buy.mq5 |
//|                                  Copyright 2022, MetaQuotes Ltd. |
//|                                             https://www.mql5.com |
//+------------------------------------------------------------------+
#property copyright "Copyright 2022, MetaQuotes Ltd."
#property link      "https://www.mql5.com"
#property version   "1.00"

//+------------------------------------------------------------------+
//| Expert tick function                                             |
//+------------------------------------------------------------------+
void OnTick()
  {
   //Creating array for prices
   double RSIArray[];

   //Identying RSI properties
   int RSIDef = iRSI(_Symbol, _Period, 14, PRICE_CLOSE);

   //Sorting prices array
   ArraySetAsSeries(RSIArray,true);

   //Identifying EA
   CopyBuffer(RSIDef,0,0,1,RSIArray);

   //Calculating EA
   double RSIValue = NormalizeDouble(RSIArray[0],2);

   //Creating signal according to RSI
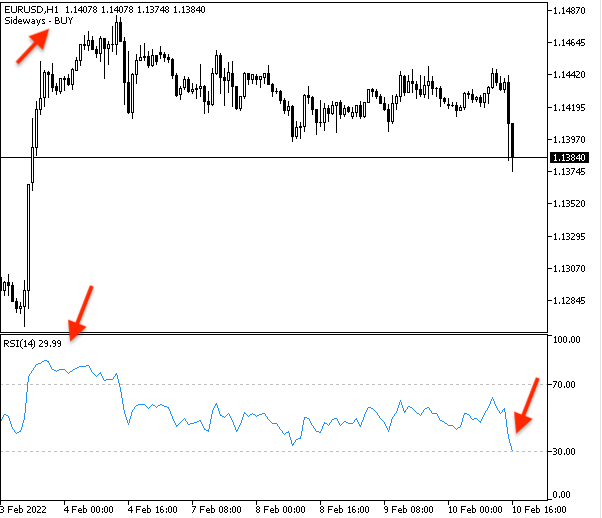
   if(RSIValue<30)
   Comment ("Sideways - BUY");

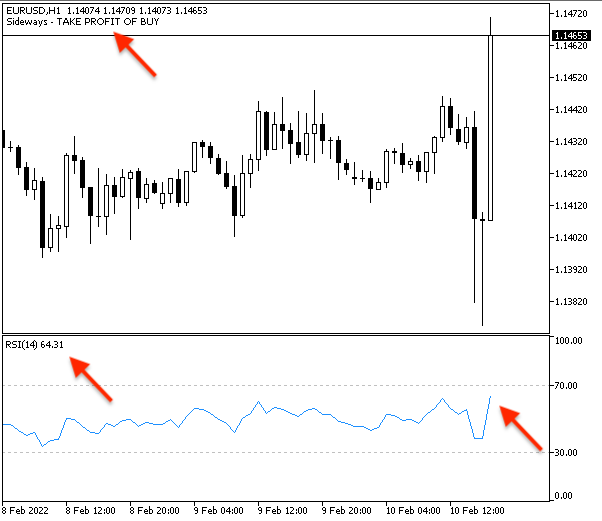
   if(RSIValue>50)
   Comment ("Sideways - TAKE PROFIT");
  }
//+------------------------------------------------------------------+
Run this program on the chart from the Navigator window as is shown below. Make sure there are no errors or warnings:
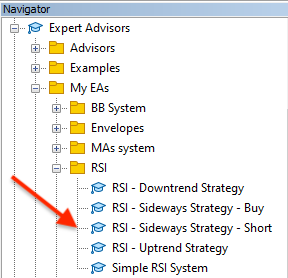
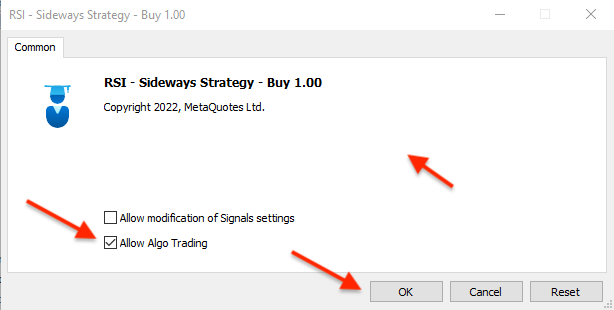
Double click or drag and drop the file on the chart, click ok in the program window, and the program will be launched on the chart:
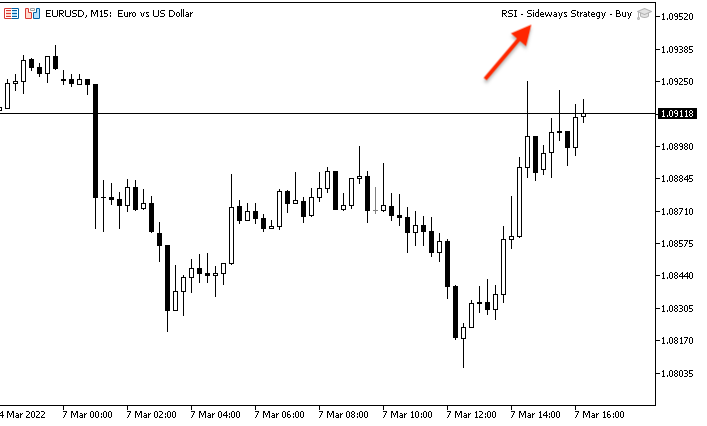
After execution for the program signal will be the same like what you can see in the following picture:
- Buy signal:
- Take Profit signal:
- Short signal
//+------------------------------------------------------------------+
//|                              RSI - Sideways Strategy - Short.mq5 |
//|                                  Copyright 2022, MetaQuotes Ltd. |
//|                                             https://www.mql5.com |
//+------------------------------------------------------------------+
#property copyright "Copyright 2022, MetaQuotes Ltd."
#property link      "https://www.mql5.com"
#property version   "1.00"

//+------------------------------------------------------------------+
//| Expert tick function                                             |
//+------------------------------------------------------------------+
void OnTick()
  {
   //Creating array for prices
   double RSIArray[];

   //Identying RSI properties
   int RSIDef = iRSI(_Symbol, _Period, 14, PRICE_CLOSE);

   //Sorting prices array
   ArraySetAsSeries(RSIArray,true);

   //Identifying EA
   CopyBuffer(RSIDef,0,0,1,RSIArray);

   //Calculating EA
   double RSIValue = NormalizeDouble(RSIArray[0],2);

   //Creating signal according to RSI
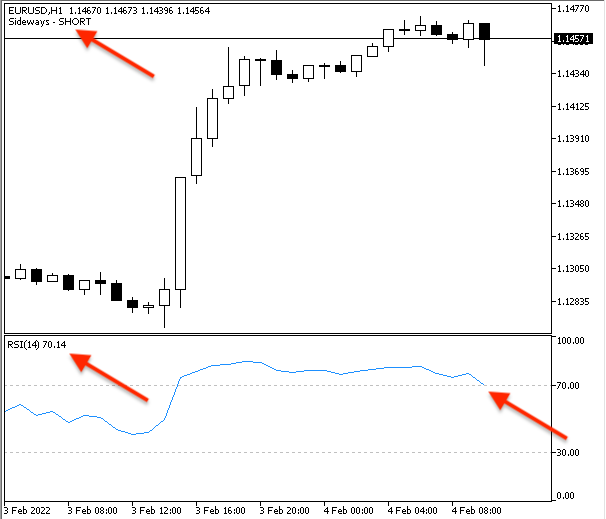
   if(RSIValue>70)
   Comment ("Sideways - SHORT");

   if(RSIValue<50)
   Comment ("Sideways - TAKE PROFIT");
  }
//+------------------------------------------------------------------+
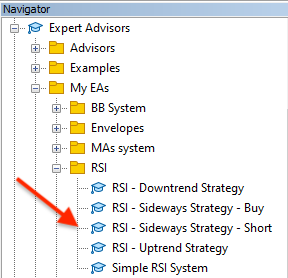
Run this program on the chart from the Navigator window as is shown below. Make sure there are no errors or warnings:
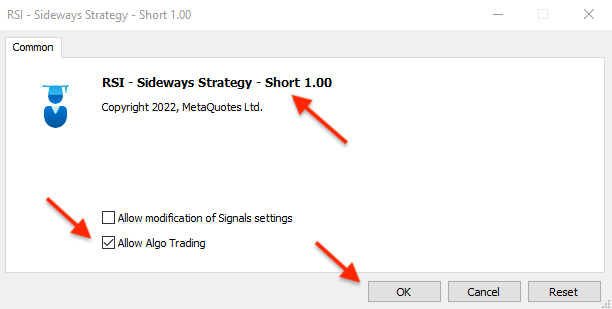
Double click or drag and drop the file on the chart, click ok in the program window, and the program will be launched on the chart:
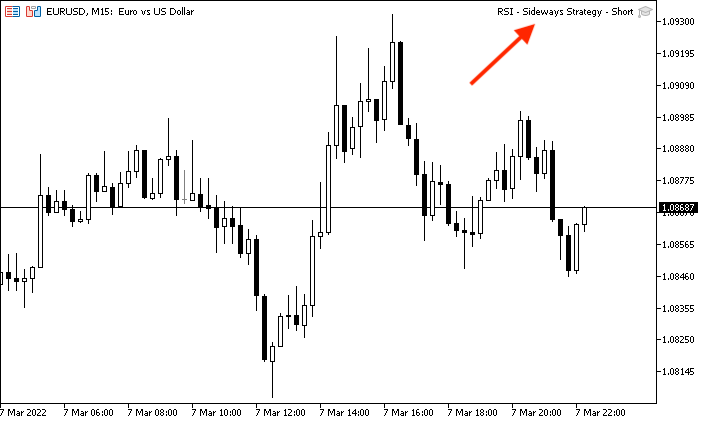
The running program will generate signals as is shown further:
- Short signal:
- Take Profit signal:
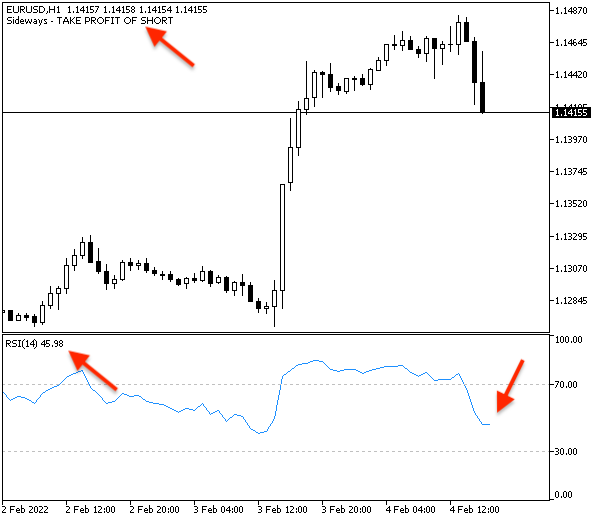
This was all about how we can create and use simple strategies based on the RSI - Relative Strength Index - one of the most popular indicators that is commonly used in trading. We have seen how it can be used for different market trends or movements.
And what I want to confirm here again, this article is for educational purposes only and its main objective is to explain this useful tools. If you need to use anything written in this article for your trading, make sure to properly test it before using as it may be useful for someone but may not be useful for you according to your trading strategy or plan.
Conclusion
In this article, I tried to share with you one of the most powerful tools in trading and in technical analysis which is RSI. We have seen that it depends on the concept of momentum which is one of the most important concepts in market movements and trading. I tried to explain the construction of the RSI and the calculation details just for you to understand how the indicator can be used in a suitable, effective, and beneficial way.
Also, I have shared a simple strategy that can be used in trading and identified how can it can be used during different market movements and trends. So, now you know how to use it during uptrends, downtrends, and sideways. There are many strategies which can be used effectively and can be useful in trading so I hope you keep reading and learning about this RSI indicator and others.
We have also learned how to write code a trading system based on these strategies. MQL5 and programming in general assist in effective, accurate and easy usage of various useful trading and analytical tools, and they help us to live our life smoothly and achieve balanced life.
I recommend that you try to code and apply what you have learned from this article. Such practice can enhance your understanding and awareness about what you have learned and may give you more insights and new ideas. I hope that you found this article useful for you and that some of the ideas will help you achieve better results in your trading.
Warning: All rights to these materials are reserved by MetaQuotes Ltd. Copying or reprinting of these materials in whole or in part is prohibited.
This article was written by a user of the site and reflects their personal views. MetaQuotes Ltd is not responsible for the accuracy of the information presented, nor for any consequences resulting from the use of the solutions, strategies or recommendations described.
 Learn how to design a trading system by Envelopes
- Free trading apps
- Over 8,000 signals for copying
- Economic news for exploring financial markets
You agree to website policy and terms of use
I support. Pointless waste of money by the MQL5 administration. Who reads these articles at all?
Very informative, thanks for sharing.