
Learn how to design a trading system by Envelopes
Introduction
In my previous article, I wrote about one of the most popular indicators — Bollinger Bands — which allows us to trade bands. This article is available at the following link: Learn how to design a trading system by Bollinger Bands
As I mentioned in this article about the Bollinger Band, the concept of band trading has a variety of existing methods that we can use. Every method has a different approach as per its calculation and its strategy but the common thing is the concept that we trade the bands.
Now, I will share another method withing the concept of band trading — the Envelopes indicator. The indicator is represented by two bands which surround the price and its moving average. In this article, we will consider some more details, including the following topics:
- Envelopes definition
- Envelopes strategy
- Envelopes trading strategy system blueprint
- Envelopes trading system
- Conclusion
Through these topics, I will try to explain the indicator in a way to allow a deep understand of the indicator. The information should assist in developing a better trading plan or strategy which can generate better results. So, through the topic of Envelopes definition, I will share with you more details about the concept of the Envelopes indicator. We will consider its calculation for a better understanding of the concept. Then, we will try to develop strategies which will enhance our trading results.
In the Envelopes Strategy part, I will share with you some simple basic strategies which can be used in our favor as examples of how can we use it and this can open our eyes on more strategies to get much better results. Then, in the 'Envelopes trading strategy system blueprint' part, which I consider a very interesting topic, I will share with you a blueprint of how to create a trading system using strategies of the Envelopes indicator. Later, in the 'Envelopes trading system' part, I will share with you the ways to design a trading system based in the Envelopes indicator strategies in the MQL5 language, which can further be used in MetaTrader 5.
I hope that this article will be useful for you and that you will find some insights which will help you develop your own trading system or will help you improve your trading results.
Important!All codes in this article are written in MQL5. These codes can be executed in MetaTrader 5. So, you will need to have MetaTrader 5 to run the applications. If you do not have the MetaTrader 5 terminal yet, you can download it from the following link: https://www.metatrader5.com/en/download
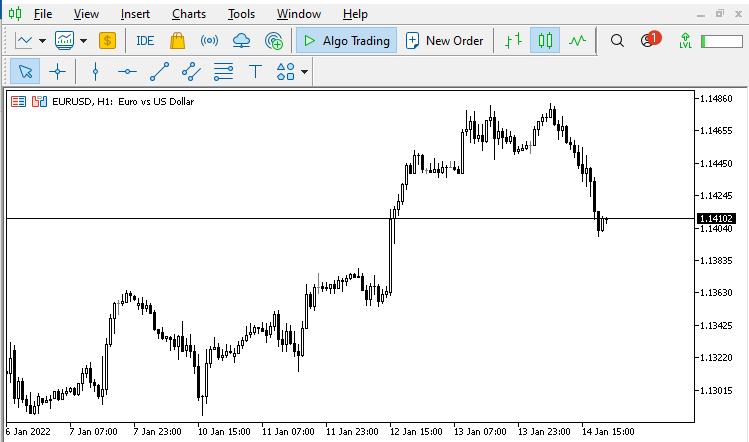
After downloading it the following picture will show the window of MetaTrader 5:
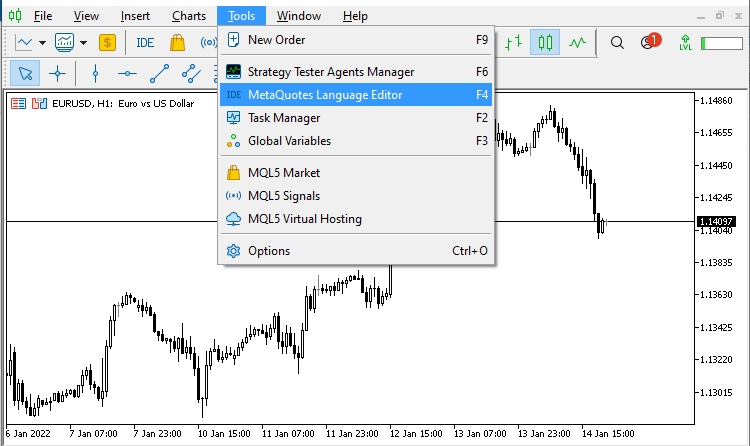
To open the MetaQuotes Language Editor (MetaEditor) to write codes the following picture shows you how to do that:
Another method to open it:
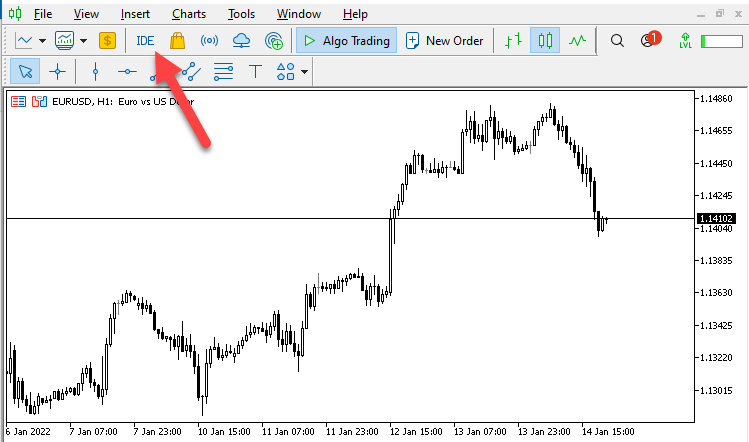
Or you can press F4 while the MetaTrader 5 window is open.
Then the following window will be opened:
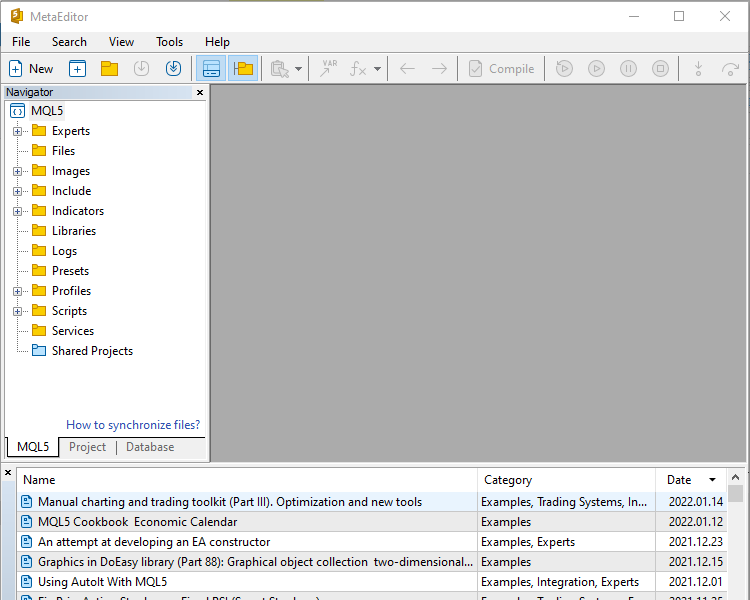
Here is how to open a new file:
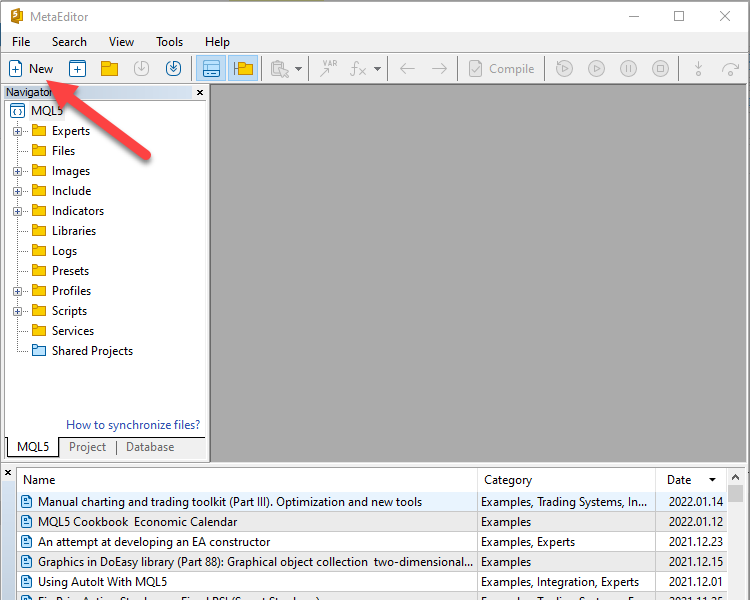
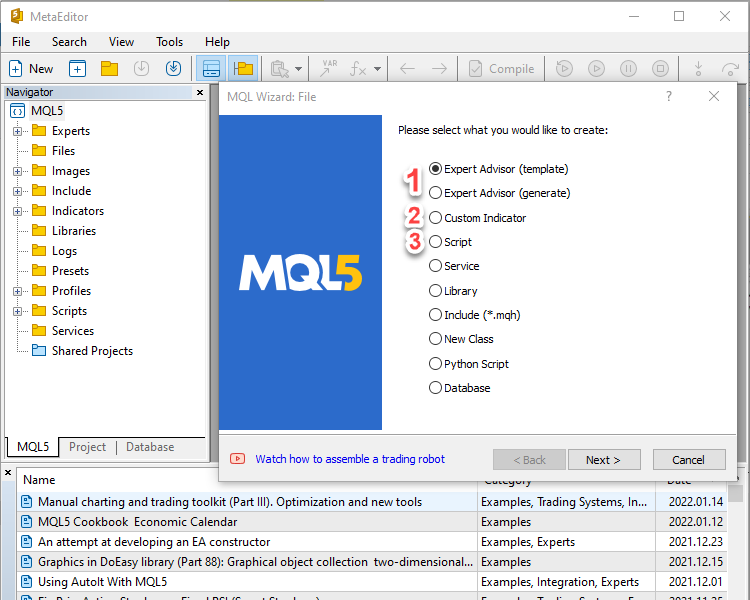
- Open a new file to write an Expert Advisor
- Open a new file to write a custom indicator
- Open a new file to write a script
For more info, you can read my previous article: Learn Why and How to Design Your Algorithmic Trading System
Disclaimer: The content in this article is made for educational purpose only not for anything else. So, you will be responsible for any action you take based on the content of this article, as the content of this article does not guarantee any kind of results.
Now, let’s start our journey to studying the Envelopes indicator to see how it may be beneficial to our trading.
Envelopes definition
The Envelopes indicator is one of the methods of trading bands and like what I mentioned before, there are many methods of trading bands like Bollinger Bands, Channels, Envelopes and others.
Simply put, we can say that Envelopes are two bands that surround the moving average by a certain fixed percentage and normally they surround prices. These Envelopes can be used to filter trend movements and to trade during sideways.
Sometimes during trends, we face some movements in the opposite direction, such as false breakouts or whipsaws. Such movements can generate a fake signal, after which the situation returns to its opposite scenario. For example, if prices cross the moving average upwards, this serves as a signal of an upward movement. Then they turn and cross the moving average downwards, i.e. the opposite of the previous upward crossover. By the way, you can read more about the Moving Averages, about how to use them and to create a trading system based on them, you can read my previous article: Learn how to design different Moving Average systems
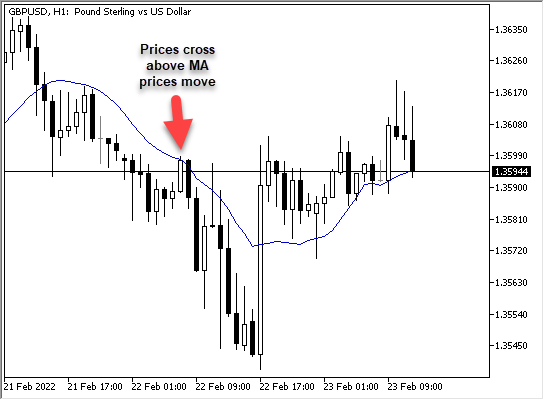
In the above figure, after the price crosses the Moving Average from above, it turns and moves up again.
Sometimes also, we have sideways and there is a balance between buyers and sellers or there is no an obvious trend and we need to benefit from this movement.
In these cases, the Envelopes indicator can be useful for us as it can be a filter for movements during trends. If the price crosses the Moving Average upwards, we wait for the price to cross above the upper band of the Envelopes indicator.
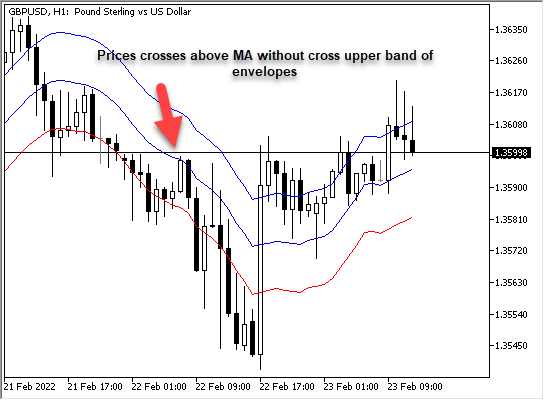
As you can see in the above figure for the same movement that we mentioned before, the price crossed the Moving Average upwards but did not cross the upper band of Envelopes indicator. So, we cannot take action according to this crossover only then we found that prices moved to down again.
And here I need to mention something interesting about Technical Analysis as it has many methods and strategies that can be combined in a way which generates better results.
Like what I mention before, Envelopes are two bands surrounding prices, so the wider bands provide a lower probability to be touched and the narrow bands provide a higher probability to be touched.
Now how can the Envelopes indicator be calculated? Envelopes are set at a certain percentage from the moving average. This percentage depends on the price action, time frame and the user strategy.
To calculate the Envelopes:
- Calculate the Moving Average
- The % of Envelopes = Moving Average * %
- Upper band of Envelopes = Moving Average + The determined % of Moving Average
- Lower band of Envelopes = Moving Average - The determined % of Moving Average
Let us see an example of how to do that.
If we have the following data for prices of 14 days:
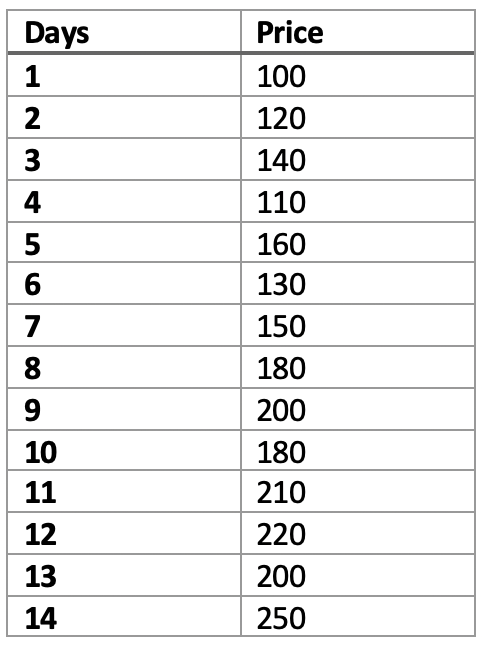
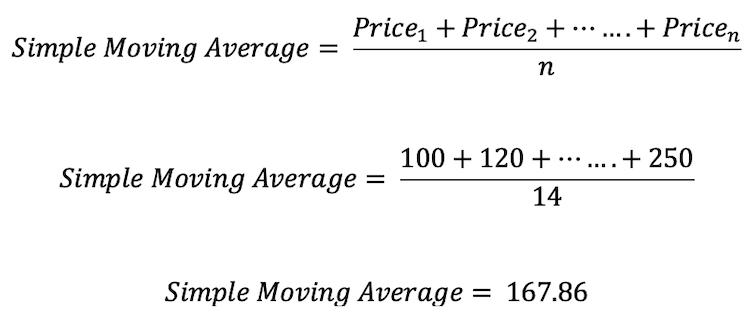
- Get the Moving Average (here we calculate a simple moving average, but you can use any - some of them are described in detail in my previous article: Learn how to design different Moving Average systems
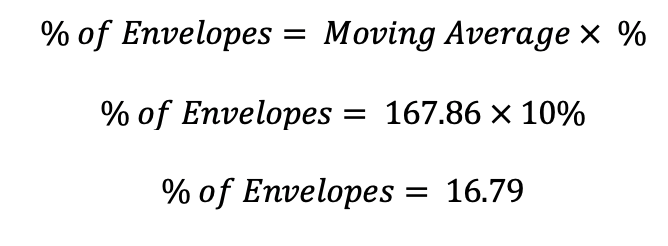
- Calculate the % of Envelopes as per your preferences
- Calculate the Upper Band of Envelopes

- Calculate the Lower Band of Envelopes

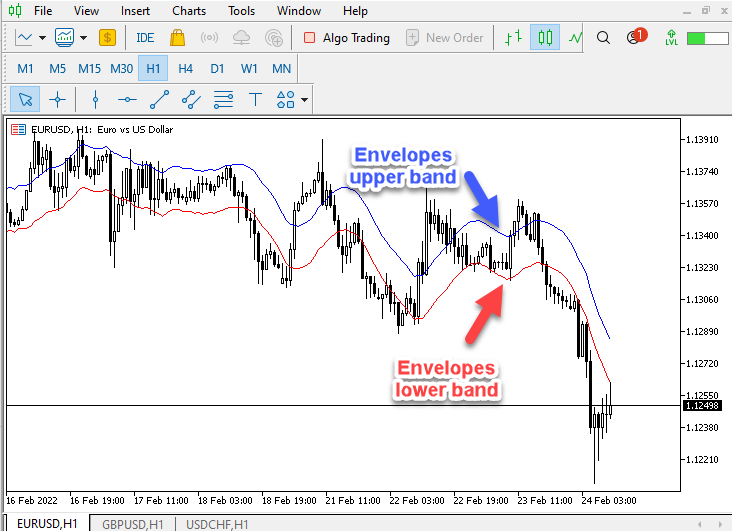
This calculation will be performed at every tick, then values of upper band will be plotted above prices and values of lower band will be plotted below prices.
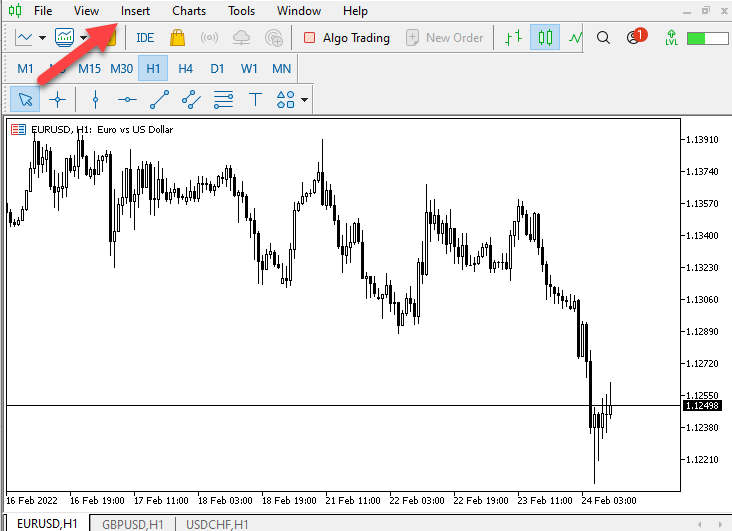
But today we will not do that manually as we have it calculated and built-in in the platform and all what we need to do to choose it and it will be plotted on our chart and the following pictures are about how to do that:
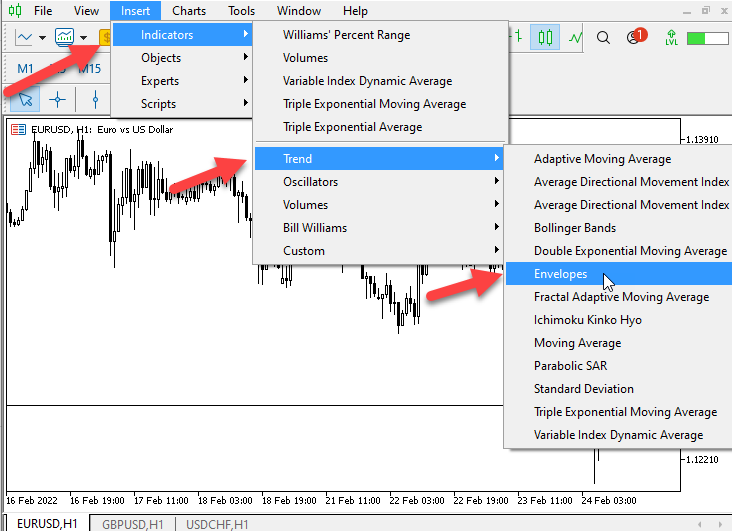
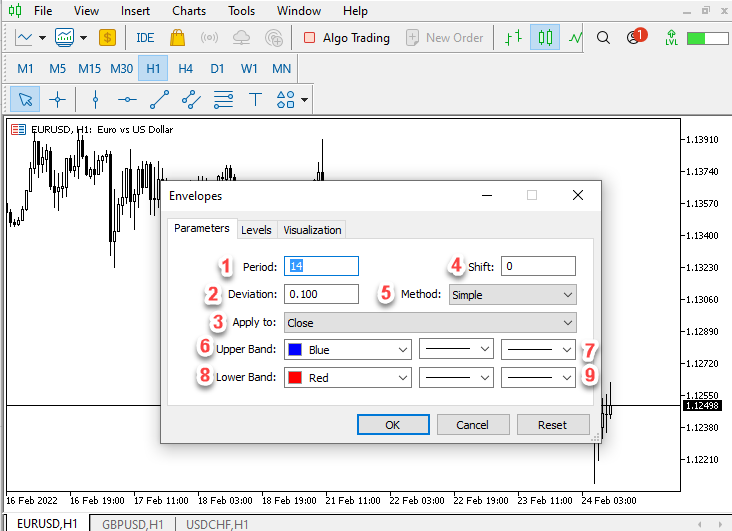
The figure above shows the parameters of Envelopes:
- To determine the period of moving average.
- % Of Envelopes.
- Kind of price (close, Median price, Typical price, etc.)
- Value to be shifted for the Envelopes on the chart.
- Type of Moving Average.
- Color of upper band of Envelopes.
- Style of line of upper band of Envelopes.
- Color of lower band of Envelopes.
- Style of line of lower band of Envelopes.
And after determining all parameter, the indicator will appear on the chart, just as is shown in the following picture:
Envelopes strategy
In this part, I will share with you some of Envelopes strategies. These strategies are used according to market condition or market direction.
As we all know, in the market there us an uptrend, a downtrend, and sideways directions. According to the specific market direction, we will use a specific strategy which will allow us to benefit from this market movement.
It is possible to can combine the Envelopes with other tools and create a strategy based on this combination. The results of such a combined use can be better than using one tool only. So, you can combine the Envelopes indicator with another tool like price action pattern for example: take a signal from Envelopes indicator and take another signal or confirmation signal from a price pattern. Optionally, it is possible to use another technical analysis indicator. I think this is an amazing approach in technical analysis trading to combine more than one concept in a way to get better results and improve your decisions.
According to that, we will divide our strategies to strategies which can be used during trending movement and others which can be used during sideways movements.
- Strategy 1: Uptrend
During uptrend markets, prices move in the uptrend making higher lows and higher highs. Now, we need to know how prices and the Envelopes indicator will act during the uptrend.
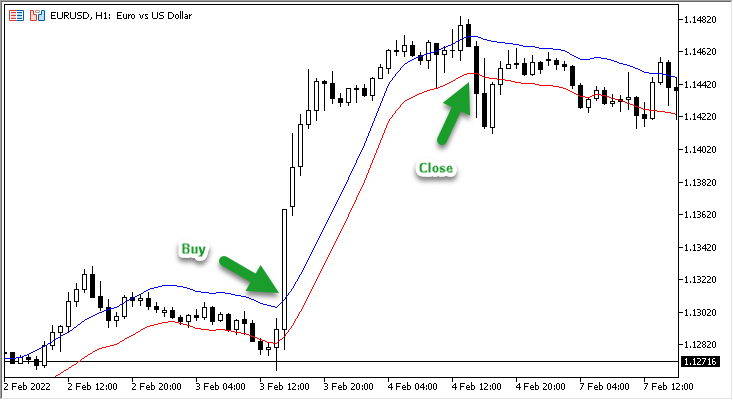
As this indicator is a percentage of moving average which is an average for a period of prices, during the uptrend prices will move above upper band of Envelopes indicator. So, our strategy here during uptrend will be as follows:
We will get a buy signal when prices cross the upper band of Envelopes upward, then take profit when prices cross the lower band of Envelopes downward.
- Prices > Upper band = buy
- Prices < Lower band = take profit
- Strategy 2: Downtrend
During downtrend markets, prices move in the downtrend making lower highs and lower lows. Now, we need to know how prices and the Envelopes indicator will act during downtrend.
During downtrend prices will move below lower band of Envelopes indicator. So, our strategy here during downtrend will be as follows:
We will get a short signal when prices cross the lower band of Envelopes downward, then take profit when prices cross upper band of Envelopes indicator upward.
- Prices < Lower band = short
- Prices > Upper band = take profit
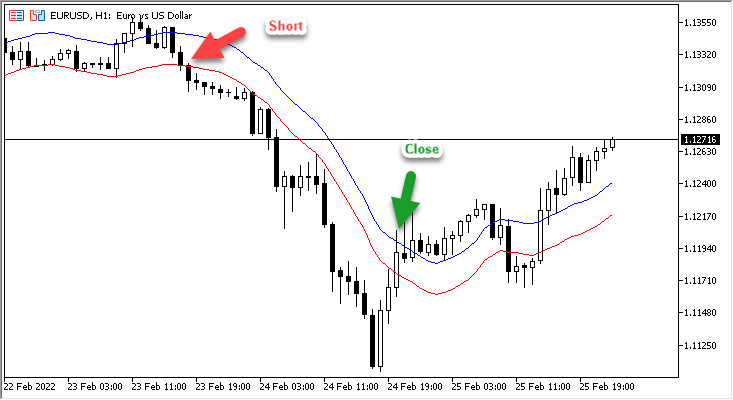
- Strategy 3: Sideways:
During sideways markets, prices move in some of sideways formations making same highs and same lows. Or there is a balance between buyers and sellers without controlling one party on the other and this the simple form ranging between two levels. It shows the balance. This does not mean that there are not other forms for sideways but it is good to know that sideways movement is any movement or form except uptrend and downtrend. Now, we need to know how prices and the Envelopes indicator will act during sideways.
During sideways, prices will move between lower band and upper band of the Envelopes indicator. So, our strategy here during sideways will be as follows:
We will get a buy signal when prices touch the lower band of Envelopes, then take profit when prices touch the upper band of Envelopes. We will get a short signal when prices touch the upper band of Envelopes, then take profit when prices touch the lower band of Envelopes.
- Prices = Lower band = buy
- Prices = Upper band = take profit
- Prices = Upper band = short
- Prices = Lower band = take profit
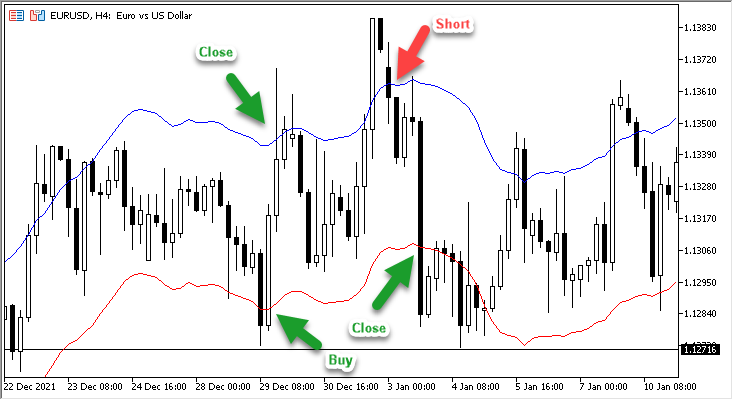
Please note that these strategies are only provided here to help you in understanding how the indicator can be used. This requires improvement and further development for proper use. Be sure to always thoroughly test every strategy you read or learn. Never use them without testing and checking its results especially if it was made for educational purposes.
Envelopes trading strategy system blueprint
In this interesting part, we will design our mentioned strategies as a blueprint to determine what we want to do exactly and what we want the program to do. So, let us do that.
- Strategy 1: Uptrend
- Prices > Upper band = buy
- Prices < Lower band = take profit
So, the blueprint for this strategy will be like the following:
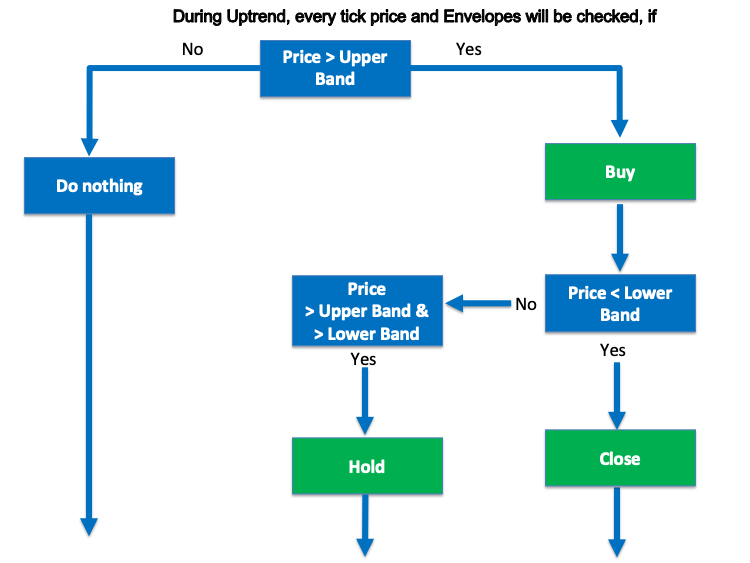
- Strategy 2: Downtrend:
- Prices < Lower band = short
- Prices > Upper band = take profit
So, the blueprint for this strategy will be like the following:
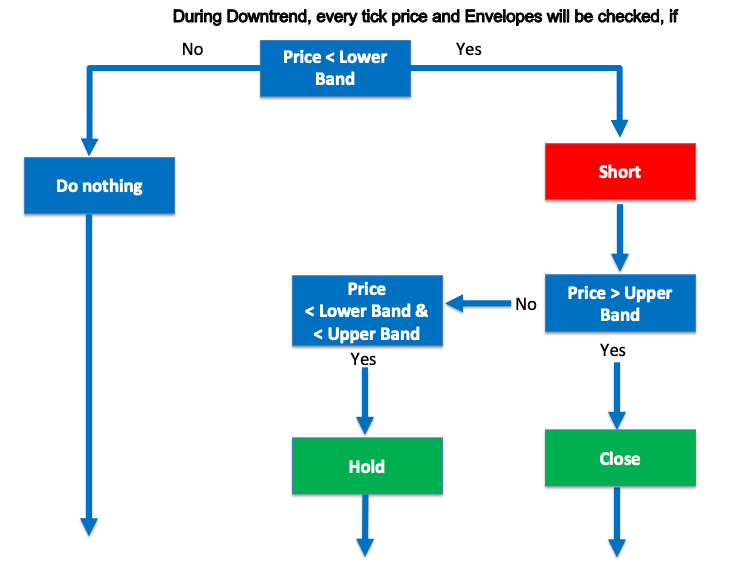
- Strategy 3: Sideways:
- Prices = Lower band = buy
- Prices = Upper band = take profit
- Prices = Upper band = short
- Prices = Lower band = take profit
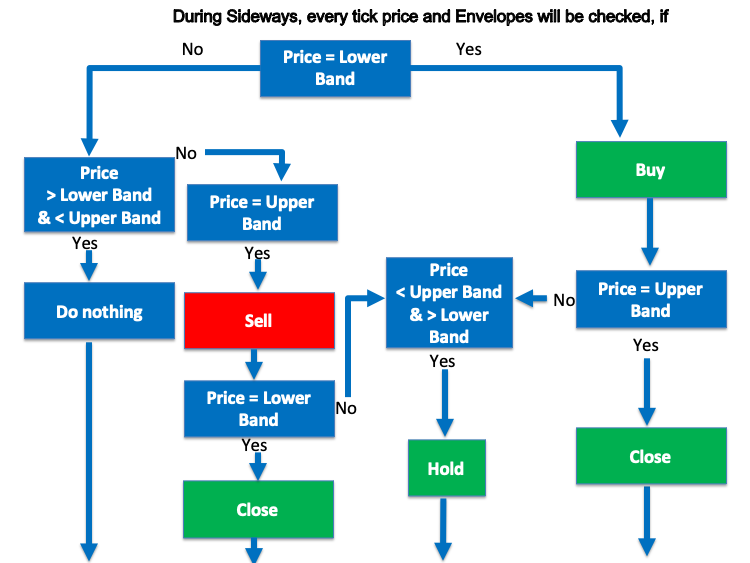
Envelopes trading system
In this part, I will share with you how you can code these strategies using MQL5, in the form of EA (Expert Advisors) programs. This can help someone enhance their trading and identify signals automatically and easily. Now, I will share with you how to code a basic Envelopes EA and give instructions to our program to comment Envelopes indicator upper and lower values on the chart.
Let us design a program which will allow us to see values of Envelopes upper and lower bands as comments on the chart:
//+------------------------------------------------------------------+
//|                                          Simple Envelopes EA.mq5 |
//|                                  Copyright 2022, MetaQuotes Ltd. |
//|                                             https://www.mql5.com |
//+------------------------------------------------------------------+
#property copyright "Copyright 2022, MetaQuotes Ltd."
#property link      "https://www.mql5.com"
#property version   "1.00"

//+------------------------------------------------------------------+
//| Expert tick function                                             |
//+------------------------------------------------------------------+
void OnTick()
  {
   //Creating an array for price info
   MqlRates PriceInfo[];

   //Sorting it from current data to old data
   ArraySetAsSeries(PriceInfo, true);

   //Copy prices data to array
   int Data = CopyRates(Symbol(), Period (), 0, Bars(Symbol(), Period()), PriceInfo);

   //Creating two arrays for prices of upper and lower band
   double UpperBandArray[];
   double LowerBandArray[];

   //Identify Envelopes indicator
   int EnvelopesIdentify = iEnvelopes(_Symbol,_Period,14,0,MODE_SMA,PRICE_CLOSE,0.100);

   //Copying prices data to arrays
   CopyBuffer(EnvelopesIdentify,0,0,1,UpperBandArray);
   CopyBuffer(EnvelopesIdentify,1,0,1,LowerBandArray);

   //Calculation for the current data
   double UpperBandValue=NormalizeDouble(UpperBandArray[0],6);
   double LowerBandValue=NormalizeDouble(LowerBandArray[0],6);

   //Comments on the chart with values of Band of Envelopes
   Comment("Envelopes Upper Band =",UpperBandValue,"\n" "Envelopes Lower Band =",LowerBandValue,"\n");

  }
//+------------------------------------------------------------------+
The code in MetaTrader 5 can be executed as is shown in the following pictures:
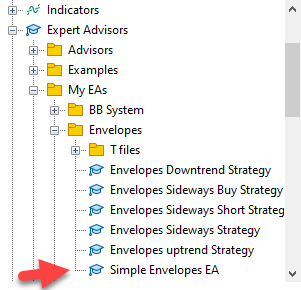

After that the program will appear on the chart:
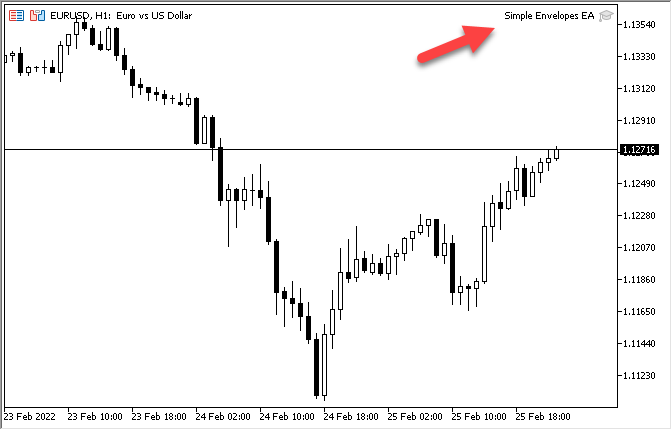
After the execution of the code in the MetaTrader 5 trading terminal we will see the following chart and signals on it:
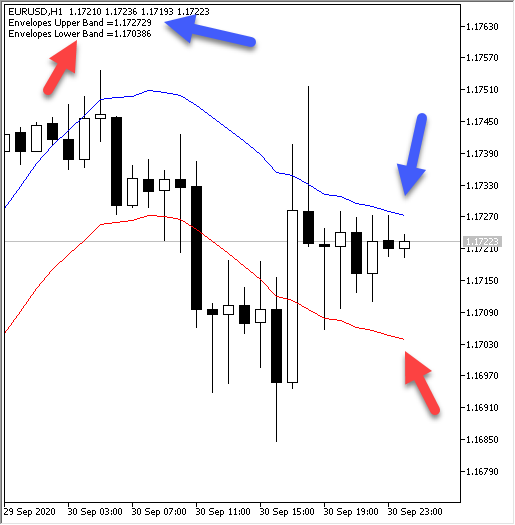
We have two bands of the Envelopes indicator — Lower band and Upper band — and we can see their values on the chart.
Now, we will code our mentioned three strategies, strategy one is about buy and take profit during uptrend, strategy two is about short and take profit during downtrend, then strategy three is about sideways and buy on the lower band and take profit on the upper band then short on the upper band and take profit on the lower band.
- Strategy 1: Uptrend:
- Prices > Upper band = buy
- Prices < Lower band = take profit
The following code is to design the program to execute this strategy:
//+------------------------------------------------------------------+
//|                                   Envelopes uptrend Strategy.mq5 |
//|                                  Copyright 2022, MetaQuotes Ltd. |
//|                                             https://www.mql5.com |
//+------------------------------------------------------------------+
#property copyright "Copyright 2022, MetaQuotes Ltd."
#property link      "https://www.mql5.com"
#property version   "1.00"

//+------------------------------------------------------------------+
//| Expert tick function                                             |
//+------------------------------------------------------------------+
void OnTick()
  {
   //Creating an array for price info
   MqlRates PriceInfo[];

   //Sorting it from current data to old data
   ArraySetAsSeries(PriceInfo, true);

   //Copy prices data to array
   int Data = CopyRates(Symbol(), Period (), 0, Bars(Symbol(), Period()), PriceInfo);

   //Creating two arrays for prices of upper and lower band
   double UpperBandArray[];
   double LowerBandArray[];

   //Identify Envelopes indicator
   int EnvelopesIdentify = iEnvelopes(_Symbol,_Period,14,0,MODE_SMA,PRICE_CLOSE,0.100);

   //Copying prices data to arrays
   CopyBuffer(EnvelopesIdentify,0,0,1,UpperBandArray);
   CopyBuffer(EnvelopesIdentify,1,0,1,LowerBandArray);

   //Calculation for the current data
   double UpperBandValue=NormalizeDouble(UpperBandArray[0],6);
   double LowerBandValue=NormalizeDouble(LowerBandArray[0],6);

   //Comment Buy signal on the chart or no signal
   if (PriceInfo[0].close > UpperBandValue)
   Comment("Envelopes Buy Signal");

   if (PriceInfo[0].close < LowerBandValue)
   Comment("Envelopes Take Profit or Stop Loss");

  }
//+------------------------------------------------------------------+
Code from MetaTrader can be executed as is shown in the following pictures:
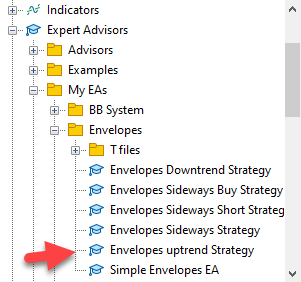
Drag and drop the file on the chart or double click on the file then the code will be executed and the following window will be opened.

After that the program is attached to the chart:

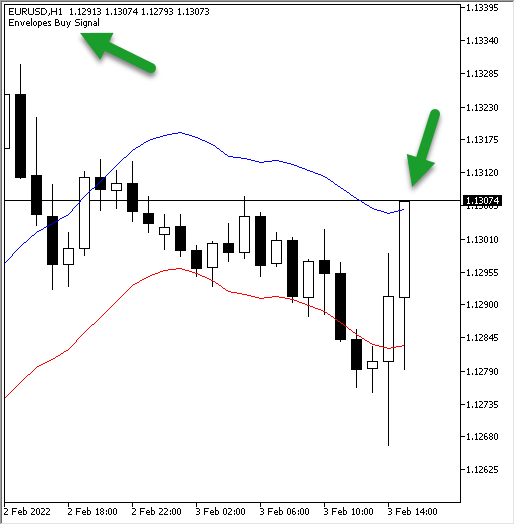
As we can see on the previous chart, the program gives us a buy signal when prices cross above the upper band during uptrend.
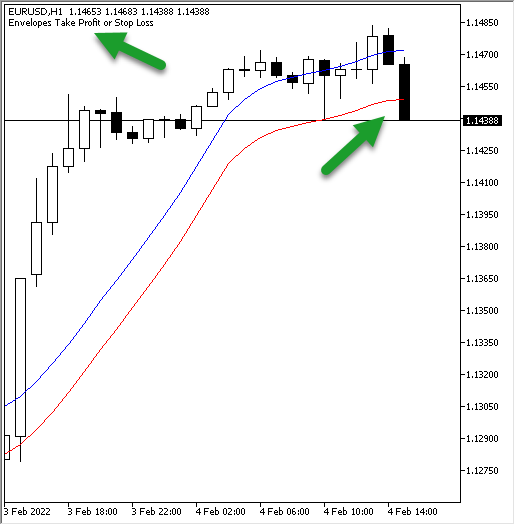
As we can see on the previous chart, the program gives us a take profit signal when prices cross below the lower band.
- Strategy 2: Downtrend
- Prices < Lower band = short
- Prices > Upper band = take profit
The following code is to design the program to execute this strategy:
//+------------------------------------------------------------------+
//|                                 Envelopes Downtrend Strategy.mq5 |
//|                                  Copyright 2022, MetaQuotes Ltd. |
//|                                             https://www.mql5.com |
//+------------------------------------------------------------------+
#property copyright "Copyright 2022, MetaQuotes Ltd."
#property link      "https://www.mql5.com"
#property version   "1.00"

//+------------------------------------------------------------------+
//| Expert tick function                                             |
//+------------------------------------------------------------------+
void OnTick()
  {
   //Creating an array for price info
   MqlRates PriceInfo[];

   //Sorting it from current data to old data
   ArraySetAsSeries(PriceInfo, true);

   //Copy prices data to array
   int Data = CopyRates(Symbol(), Period (), 0, Bars(Symbol(), Period()), PriceInfo);

   //Creating two arrays for prices of upper and lower band
   double UpperBandArray[];
   double LowerBandArray[];

   //Identify Envelopes indicator
   int EnvelopesIdentify = iEnvelopes(_Symbol,_Period,14,0,MODE_SMA,PRICE_CLOSE,0.100);

   //Copying prices data to arrays
   CopyBuffer(EnvelopesIdentify,0,0,1,UpperBandArray);
   CopyBuffer(EnvelopesIdentify,1,0,1,LowerBandArray);

   //Calculation for the current data
   double UpperBandValue=NormalizeDouble(UpperBandArray[0],6);
   double LowerBandValue=NormalizeDouble(LowerBandArray[0],6);

   //Comment Buy signal on the chart or no signal
   if (PriceInfo[0].close < LowerBandValue)
   Comment("Envelopes Short Signal");

   if (PriceInfo[0].close > UpperBandValue)
   Comment("Envelopes Take Profit or Stop Loss");

  }
//+------------------------------------------------------------------+
We can execute the code from MetaTrader 5 like what we can see at the following pictures:
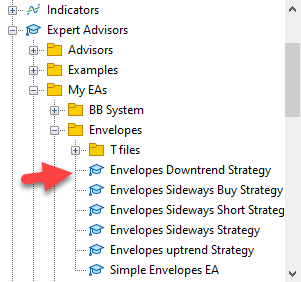
We can drag and drop the file on the chart or double click on the file then the code will be executed and the following window will be opened.

After that we see the program attached to the chart:

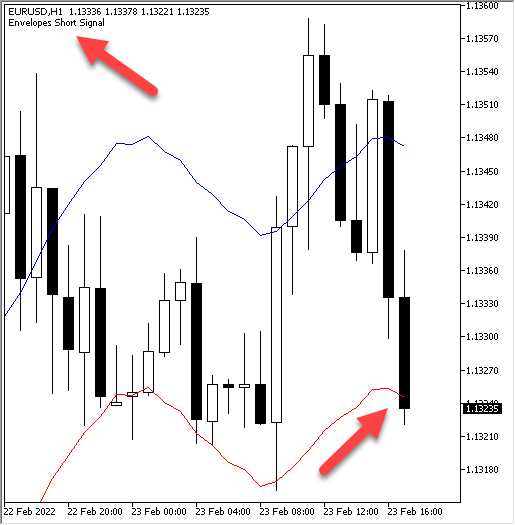
As we can see on the previous chart, the program gives us a short signal when prices cross below the lower band during downtrend.
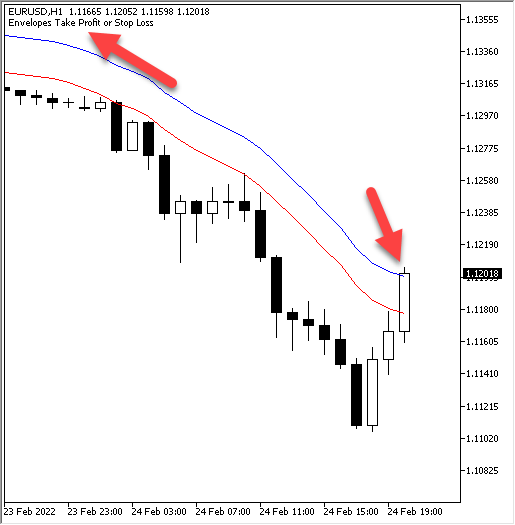
As we can see on the previous chart, the program gives us a take profit signal when prices cross above the upper band during downtrend.
- Strategy 3: Sideways
- Prices = Lower band = buy
- Prices = Upper band = take profit
//+------------------------------------------------------------------+
//|                              Envelopes Sideways Buy Strategy.mq5 |
//|                                  Copyright 2022, MetaQuotes Ltd. |
//|                                             https://www.mql5.com |
//+------------------------------------------------------------------+
#property copyright "Copyright 2022, MetaQuotes Ltd."
#property link      "https://www.mql5.com"
#property version   "1.00"

//+------------------------------------------------------------------+
//| Expert tick function                                             |
//+------------------------------------------------------------------+
void OnTick()
  {
   //Creating an array for price info
   MqlRates PriceInfo[];

   //Sorting it from current data to old data
   ArraySetAsSeries(PriceInfo, true);

   //Copy prices data to array
   int Data = CopyRates(Symbol(), Period (), 0, Bars(Symbol(), Period()), PriceInfo);

   //Creating two arrays for prices of upper and lower band
   double UpperBandArray[];
   double LowerBandArray[];

   //Identify Envelopes indicator
   int EnvelopesIdentify = iEnvelopes(_Symbol,_Period,14,0,MODE_SMA,PRICE_CLOSE,0.150);

   //Copying prices data to arrays
   CopyBuffer(EnvelopesIdentify,0,0,1,UpperBandArray);
   CopyBuffer(EnvelopesIdentify,1,0,1,LowerBandArray);

   //Calculation for the current data
   double UpperBandValue=NormalizeDouble(UpperBandArray[0],6);
   double LowerBandValue=NormalizeDouble(LowerBandArray[0],6);

   //Comment Buy signal on the chart or no signal
   if (PriceInfo[0].close <= LowerBandValue)
   Comment("Envelopes Buy Signal");

   if (PriceInfo[0].close >= UpperBandValue)
   Comment("Envelopes Take Profit");

   if (PriceInfo[0].close > LowerBandValue
   &&  PriceInfo[0].close < UpperBandValue)
   Comment("No Signal");
  }
//+------------------------------------------------------------------+
The code in MetaTrader 5 can be executed as is shown in the following pictures:
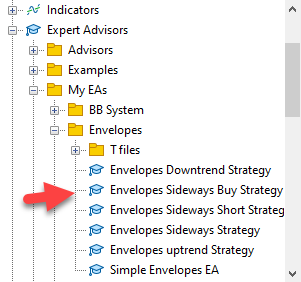

After that the program will appear on the chart:

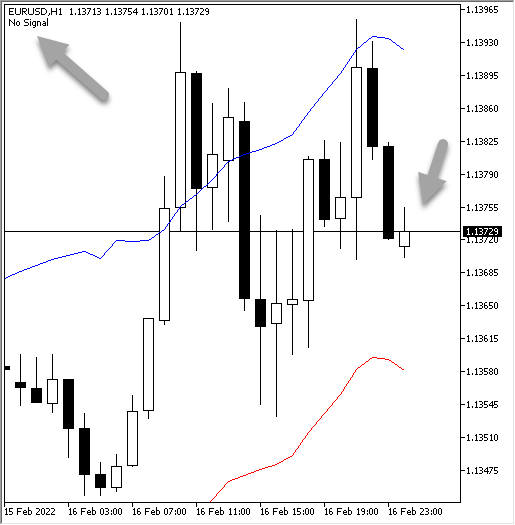
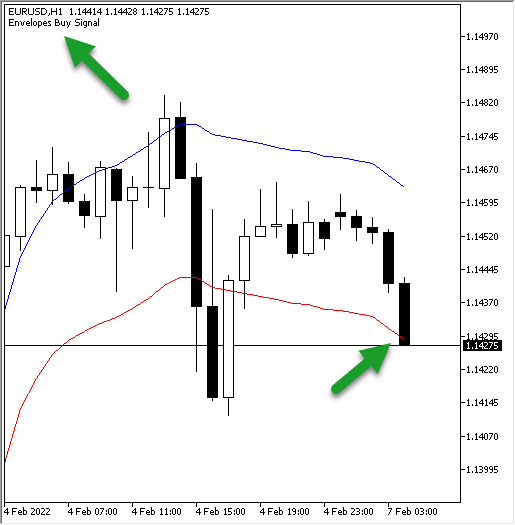
As we can see on the previous chart, the program gives us a buy Signal as prices touch the lower band during sideways.
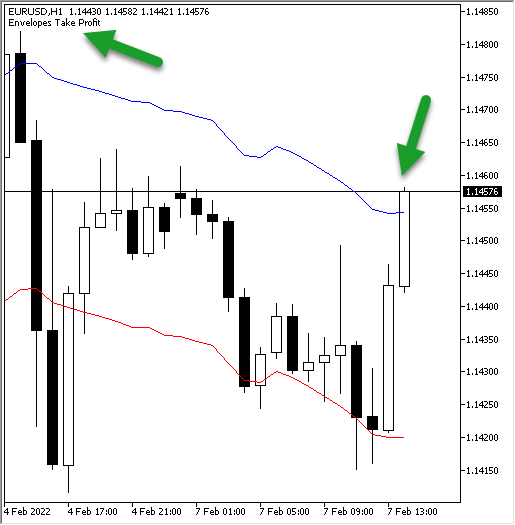
As we can see on the previous chart, the program gives us a take profit Signal as prices touch the upper band during sideways
- Prices = Upper band = short
- Prices = Lower band = take profit
The following code is to design the program to execute this strategy:
//+------------------------------------------------------------------+
//|                            Envelopes Sideways Short Strategy.mq5 |
//|                                  Copyright 2022, MetaQuotes Ltd. |
//|                                             https://www.mql5.com |
//+------------------------------------------------------------------+
#property copyright "Copyright 2022, MetaQuotes Ltd."
#property link      "https://www.mql5.com"
#property version   "1.00"

//+------------------------------------------------------------------+
//| Expert tick function                                             |
//+------------------------------------------------------------------+
void OnTick()
  {
   //Creating an array for price info
   MqlRates PriceInfo[];

   //Sorting it from current data to old data
   ArraySetAsSeries(PriceInfo, true);

   //Copy prices data to array
   int Data = CopyRates(Symbol(), Period (), 0, Bars(Symbol(), Period()), PriceInfo);

   //Creating two arrays for prices of upper and lower band
   double UpperBandArray[];
   double LowerBandArray[];

   //Identify Envelopes indicator
   int EnvelopesIdentify = iEnvelopes(_Symbol,_Period,14,0,MODE_SMA,PRICE_CLOSE,0.150);

   //Copying prices data to arrays
   CopyBuffer(EnvelopesIdentify,0,0,1,UpperBandArray);
   CopyBuffer(EnvelopesIdentify,1,0,1,LowerBandArray);

   //Calculation for the current data
   double UpperBandValue=NormalizeDouble(UpperBandArray[0],6);
   double LowerBandValue=NormalizeDouble(LowerBandArray[0],6);

   //Comment Buy signal on the chart or no signal
   if (PriceInfo[0].close >= UpperBandValue)
   Comment("Envelopes Short Signal");

   if (PriceInfo[0].close <= LowerBandValue)
   Comment("Envelopes Take Profit");

   if (PriceInfo[0].close > LowerBandValue
   &&  PriceInfo[0].close < UpperBandValue)
   Comment("No Signal");

  }
//+------------------------------------------------------------------+
The code in MetaTrader 5 can be executed as is shown in the following pictures:
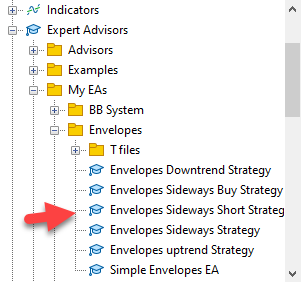

After that the program will appear on the chart:

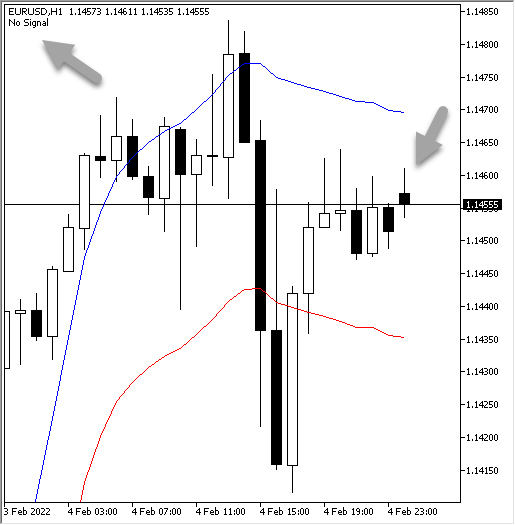
As we can see on the previous chart, the program gives us No Signal as prices move between the upper band and the lower band during sideways.
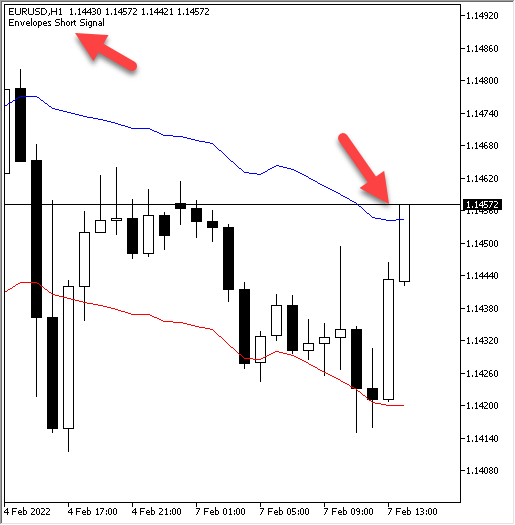
As we can see on the previous chart, the program gives us a short Signal as prices touch the upper band during sideways.
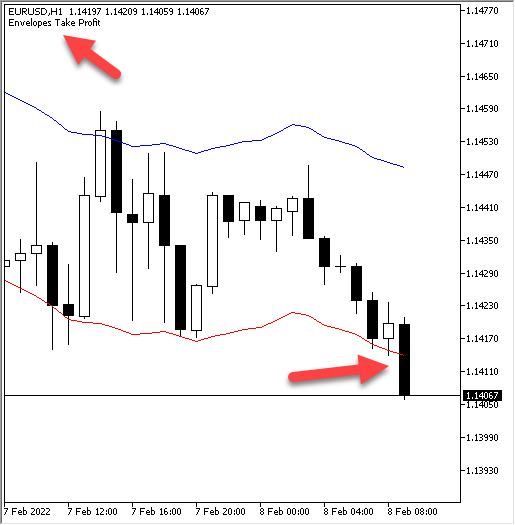
As we can see on the previous chart, the program gives us a take profit Signal as prices touch the lower band during sideways.
Conclusion
In this article, we considered the concept of trading bands through the Envelopes indicator. We also considered the benefits of trading bands and the ways in which the Envelopes indicator can be used during trends and during sideways movements.
We have also seen how the Envelopes are calculated indicator, while understanding the insides of what we are using is always good. Envelopes is one of the indicators which can give us new insights and ideas on how we can improve our trading results and our decisions.
Furthermore, we have considered a simple strategy, allowing to use the indicator in different market conditions: trending market uptrend and downtrend or sideways. We have also seen here how to design a trading system blueprint to help us to understand and to be able to code these strategies easily.
Also, the article features the code in the MQL5 language, related to the implementation of the Envelopes-based strategies. And I want again to mention that the main objective of this article is to learn how coding can be helpful and useful for us in trading and how it can help us to trade easily and effectively.
I would recommend you to write your own codes and to execute them in order to enhance your understanding of the topic. I hope that you found this article useful for you and your trading.
 Learn how to design a trading system by RSI
 Visual evaluation of optimization results
- Free trading apps
- Over 8,000 signals for copying
- Economic news for exploring financial markets
You agree to website policy and terms of use
Mohamed this is truly great material for learning! Thank you very much for your work and contribution.
Thanks for your comment. I hope that it will help to enhance your trading.
Please help me for the "comment" on the chart. For the UpTrend strategy, the "comment" of "take profit or stop loss" is set when the price is lower than LowBandValue.
However, I observe it always indicated even the price is higher than LowBandValue.
Thanks.
Try to revise conditions of strategy of your code.
Uptrend and Downtrend strategies should be better combined into one: just close the current position on the opposite signal. In the same way, you can combine Sideways Long and Sideways Short.
Yes, you can combine them.