
How to build and optimize a volume-based trading system (Chaikin Money Flow - CMF)
Introduction
Welcome to a new article where we explore new indicators in terms of creating them, building trading systems based on their concept, and optimizing these systems to get better insights and results regarding profits and risks. In this article, we will introduce a new volume-based technical indicator called the Chaikin Money Flow (CMF) indicator.
It is better to mention here something important, the main objective of this type of article is to share new technical tools that can be used alone or in conjunction with other tools based on the nature of these tools in addition to testing, optimizing them to get better results to see whether these tools can be useful or not.
We will produce this new indicator (CMF) according to the below topics:
- Chaikin Money Flow: understand the basic knowledge of this technical tool by defining it, how it can be calculated, and how it can be used.
- Custom Chaikin Money Flow indicator: learn how to code our custom indicator by modification or application of our preferences.
- Chaikin Money Flow strategies: we will have a look at some simple trading strategies that are part of our trading system.
- Chaikin Money Flow trading system: build, test, and optimize these simple trading systems.
- Conclusion
Disclaimer: All information provided 'as is' only for educational purposes and is not prepared for trading purposes or advice. The information does not guarantee any kind of result. If you choose to use these materials on any of your trading accounts, you will do that at your own risk and you will be the only responsible.
Chaikin Money Flow
The Chaikin Money Flow (CMF) is a technical indicator based on volume with considering the price action. It can be used alone or in conjunction with other tools to provide better insights, as we'll see. The (CMF) is an indicator developed by Marc Chaikin to monitor the accumulation and distribution of an instrument over a period of time. The main idea behind the CMF is that as the closing price gets closer to the high, there's been an accumulation. On the other hand, as the closing price gets closer to the low, it's a sign of distribution. A positive Chaikin Money Flow result is when the price action consistently closes above the bar's midpoint on rising volume. A negative Chaikin Money Flow result is when the price action consistently closes below the bar's midpoint on rising volume.
Below are the steps in which the CMF indicator is calculated:
- Calculating the Money Flow Multiplier
- Calculating the Money Flow Volume
Money Flow Volume = Money Flow Multiplier * Period's Volume
- Calculating the CMF
n-Period CMF = n-Period sum of Money Flow Volume / n-Period sum of Volume
After calculating the indicator, it will read a range between +1 and -1 and we can find it the same as the following figure:
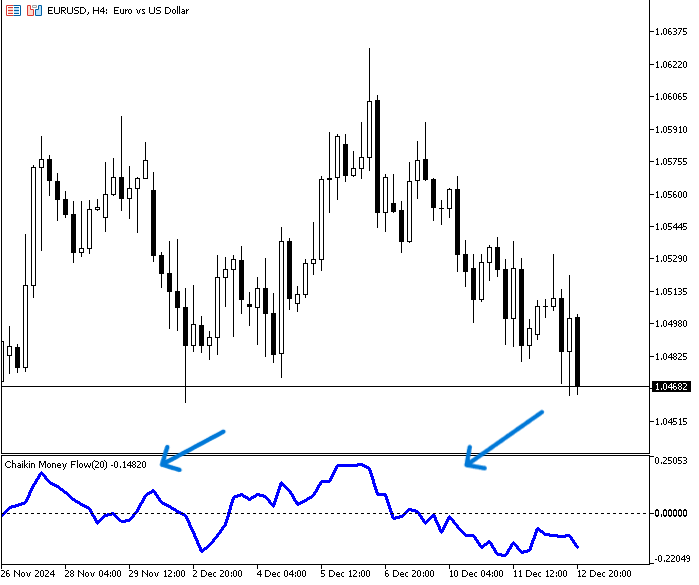
As we can the indicator can be a line which oscillates around the zero, changes in the CMF and buying or selling momentum can be identified by any crossover above or below 0. Positive values above zero indicate buying power; on the other hand, the indicator will fall below zero if selling power begins to take control. When the CMF oscillates around the zero line, we can indicate relatively equal buying and selling power or no clear trend. The CMF is used as a tool for identifying and assessing trends in the instrument being traded.
In the next section, we can tweak our indicator however we want, like drawing it as a histogram instead of a line or whatever else we think will help us trade better. That's the whole point of customizing any indicator according to our preferences through writing or editing its code.
Custom Chaikin Money Flow indicator
In this section, we'll show you how to code a customized CMF indicator step by step so we can use it later on in our simple trading system. As we will see, our customization will be simple since the main objective is to open the reader's eyes to new insights and ideas about the indicator and strategies that can be used depending on this volume indicator.
The following are the steps we will follow to code this customized indicator:
Specifying additional parameters next to #property to Identify the below values for behavior and appearance of the indicator
- The indicator description by using description constant and specifying "Chaikin Money Flow".
#property description "Chaikin Money Flow"
- The place of the indicator as a separate window on the chart by using (indicator_separate_window) constant.
#property indicator_separate_window
- Number of buffers for indicator calculation by using (indicator_buffers) constant, we set it to 4.
#property indicator_buffers 4
- Number of graphic series in the indicator by using (indicator_plots) constant, we set it to 1.
#property indicator_plots 1
- Line thickness in graphic series by using (indicator_width1) constant where 1 is the number of graphic series, we set it to 3.
#property indicator_width1 3
- Horizontal levels of 1,2, and 3 in the separate indicator window by using (indicator_level1), (indicator_level2 ), and (indicator_level3) constants for the (0) level, (0.20), and (-0.20)
#property indicator_level1  0
#property indicator_level2  0.20
#property indicator_level3  -0.20
- The style of horizontal levels of the indicator by using (indicator_levelstyle), here set to STYLE_DOT
#property indicator_levelstyle STYLE_DOT
- The thickness of horizontal levels of the indicator by using (indicator_levelwidth), here set to 0
#property indicator_levelwidth 0
- The color of horizontal levels of the indicator by using (indicator_levelcolor), set to clrBlack
#property indicator_levelcolor clrBlack
- The type of graphical plotting by using (indicator_type1), set to DRAW_HISTOGRAM
#property indicator_type1 DRAW_HISTOGRAM
- The color for displaying line N by using (indicator_color1), here we use clrBlue
#property indicator_color1 clrBlue
- Specifying inputs to set user preferences in terms of periods and volume types that will be used in the indicator calculation by using input function
input int                 periods=20; // Periods
input ENUM_APPLIED_VOLUME volumeTypeInp=VOLUME_TICK;  // Volume Type
- Declaring array of cmfBuffer
double cmfBuffer[]; In the OnInit() function to set up the indicator,
Linking a one-dimensional dynamic array of type double to the CMF indicator buffer by using (SetIndexBuffer) and its parameters are:
- index: to specify the buffer index which will be 0
- buffer[]: to specify the array which will be the cmfBuffer
- data_type: to specify the data type stored in the indicator array.
SetIndexBuffer(0,cmfBuffer,INDICATOR_DATA);
Set the value of the corresponding property of the indicator by using the (IndicatorSetInteger) and its parameters are:
- prop_id: to define the identifier which will be (INDICATOR_DIGITS).
- prop_value: to define the decimal value to be set which will be (5).
IndicatorSetInteger(INDICATOR_DIGITS,5);
Set when the drawing will be begin to be plotted by using (PlotIndexSetInteger) function with parameters of:
- plot_index: to specify the plotting style index which will be (0).
- prop_id: to specify the property identifier which will be (PLOT_DRAW_BEGIN) as one of ENUM_PLOT_PROPERTY_INTEGER enumeration.
- prop_value: to specify the value to be set as a property which will be (0).
PlotIndexSetInteger(0,PLOT_DRAW_BEGIN,0);
Specify the name and period of the indicator by using the (IndicatorSetString) function with parameters of:
- prop_id: to specify the identifier which can be one of ENUM_CUSTOMIND_PROPERTY_STRING enumeration and specify (INDICATOR_SHORTNAME).
- prop_value: to specify the text value of the indicator which will be ("Chaikin Money Flow("+string(periods)+")").
IndicatorSetString(INDICATOR_SHORTNAME,"Chaikin Money Flow("+string(periods)+")");
The OnCalculate section to calculate the CMF value
int OnCalculate(const int rates_total,
                const int prev_calculated,
                const datetime &time[],
                const double &open[],
                const double &high[],
                const double &low[],
                const double &close[],
                const long &tick_volume[],
                const long &volume[],
                const int &spread[])
Check if there is data to calculate the CMF values or not by using the if function
   if(rates_total<periods)
      return(0);
When I have data and have previously calculated CM, I will not start calculating the current value
   int initPos = prev_calculated -1;
   if(initPos<0) initPos = 0;
Calculate the CMF the following steps
- Select the volume type.
- Loop to calculate the CMF value for each bar.
- Declaring sumAccDis, sumVol.
- Loop to calculate declared variables (sumAccDis, sumVol) after declaring and defining the (thisTickVolume) variable.
- Store result in the buffer of cmfBuffer.
- Return calculated values.
   if(volumeTypeInp==VOLUME_TICK)
   {
      for(int pos = initPos;pos<=rates_total-periods;pos++)
      {
         double sumAccDis = 0;
         long sumVol = 0;

         for(int i = 0; i < periods && !IsStopped(); ++i)
         {
            long thisTickVolume = tick_volume[pos+i];
            sumVol += thisTickVolume;
            sumAccDis += AccDis(high[pos+i], low[pos+i], close[pos+i], thisTickVolume);
         }

         cmfBuffer[pos+periods-1] = sumAccDis/sumVol;
      }
   }
   else
   {
      for(int pos = initPos;pos<=rates_total-periods;pos++)
      {
         double sumAccDis = 0;
         long sumVol = 0;

         for(int i = 0; i < periods && !IsStopped(); ++i)
         {
            long thisTickVolume = volume[pos+i];
            sumVol += thisTickVolume;
            sumAccDis += AccDis(high[pos+i], low[pos+i], close[pos+i], thisTickVolume);
         }

         cmfBuffer[pos+periods-1] = sumAccDis/sumVol;
      }
   }

   return (rates_total-periods-10);
Declaring the (AccDis) function that been used in the code to have 4 variables (high, low, close, and volume) to help us calculate the Money Flow Multiplier and Money Flow Volume for the bar, which are used to calculate the CMF.
double AccDis(double high,double low,double close,long volume)
{
   double res=0;

   if(high!=low)
      res=(2*close-high-low)/(high-low)*volume;

   return(res);
}
Now, we have completed our code to create our customized CMF indicator, and the full code in one block can be found below:
#property description "Chaikin Money Flow"
#property indicator_separate_window
#property indicator_buffers 4
#property indicator_plots   1
#property indicator_width1  3
#property indicator_level1  0
#property indicator_level2  0.20
#property indicator_level3  -0.20
#property indicator_levelstyle STYLE_DOT
#property indicator_levelwidth 0
#property indicator_levelcolor clrBlack
#property indicator_type1   DRAW_HISTOGRAM
#property indicator_color1  clrBlue
input int                 periods=20; // Periods
input ENUM_APPLIED_VOLUME volumeTypeInp=VOLUME_TICK;  // Volume Type
double                    cmfBuffer[];
void OnInit()
{
   SetIndexBuffer(0,cmfBuffer,INDICATOR_DATA);
   IndicatorSetInteger(INDICATOR_DIGITS,5);
   PlotIndexSetInteger(0,PLOT_DRAW_BEGIN,0);
   IndicatorSetString(INDICATOR_SHORTNAME,"Chaikin Money Flow("+string(periods)+")");
}
int OnCalculate(const int rates_total,
                const int prev_calculated,
                const datetime &time[],
                const double &open[],
                const double &high[],
                const double &low[],
                const double &close[],
                const long &tick_volume[],
                const long &volume[],
                const int &spread[])
{
   if(rates_total<periods)
      return(0);
   int initPos = prev_calculated -1;
   if(initPos<0) initPos = 0;
   if(volumeTypeInp==VOLUME_TICK)
   {
      for(int pos = initPos;pos<=rates_total-periods;pos++)
      {
         double sumAccDis = 0;
         long sumVol = 0;

         for(int i = 0; i < periods && !IsStopped(); ++i)
         {
            long thisTickVolume = tick_volume[pos+i];
            sumVol += thisTickVolume;
            sumAccDis += AccDis(high[pos+i], low[pos+i], close[pos+i], thisTickVolume);
         }
         cmfBuffer[pos+periods-1] = sumAccDis/sumVol;
      }
   }
   else
   {
      for(int pos = initPos;pos<=rates_total-periods;pos++)
      {
         double sumAccDis = 0;
         long sumVol = 0;

         for(int i = 0; i < periods && !IsStopped(); ++i)
         {
            long thisTickVolume = volume[pos+i];
            sumVol += thisTickVolume;
            sumAccDis += AccDis(high[pos+i], low[pos+i], close[pos+i], thisTickVolume);
         }

         cmfBuffer[pos+periods-1] = sumAccDis/sumVol;
      }
   }
   return (rates_total-periods-10);
}
double AccDis(double high,double low,double close,long volume)
{
   double res=0;

   if(high!=low)
      res=(2*close-high-low)/(high-low)*volume;

   return(res);
}
Once you've put this code together and compiled it, you'll find the file in your indicator folder. When you add it to the chart, you'll see it there, just like in the figure below
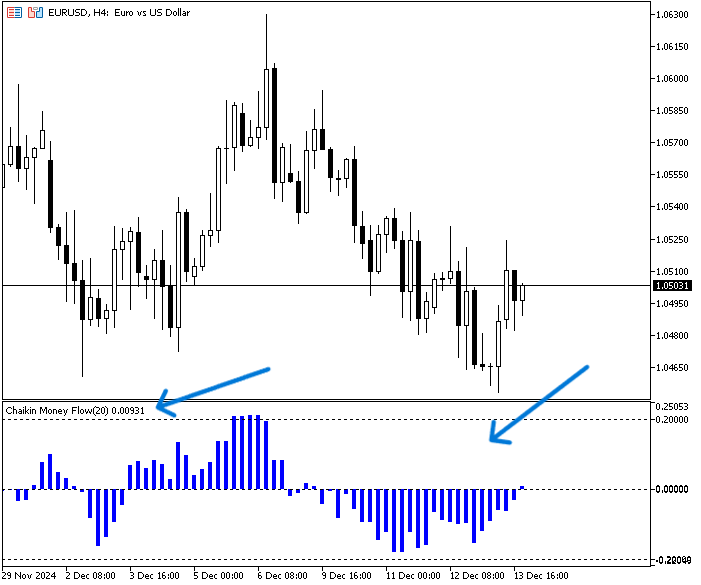
As you can see, this indicator looks and acts just like the one in our custom code. You can change it to suit your needs, depending on what helps you in your system. So far, we have a custom CMF indicator that can be used in our trading system, depending on our simple strategies, which we'll talk about in the next section.
Chaikin Money Flow strategies
In this section, I'll share some simple strategies that you can use with the CMF indicator. These strategies follow different concepts and rules to perform our tests in a good, methodical way in terms of performance and optimization. These strategies are simple in concept, but you can develop them according to your preferences to test them and see how they can be useful.
We'll use the following three simple strategies:
- CMF zero crossover strategy
- CMF overbought and oversold strategy
- CMF trend validation strategy
The CMF zero crossover strategy:
This strategy is pretty straightforward. It uses the value of the CMF indicator to determine when to buy or sell. If the previous CMF value is negative and the current or last value is positive, it's a buy signal. The opposite is true when the previous CMF value is positive and the current or last value is negative.
Simply,
Previous CMF < 0 and Current CMF > 0 --> Buy
Previous CMF > 0 and Current CMF < 0 --> Sell
The CMF overbought and oversold strategy:
This strategy is a bit different from the last one. It looks at other levels to see if it's in an overbought or oversold area. These areas can change from time to time or across different instruments, and you can find that by visual inspection of the indicator movement before you decide on them. When the CMF value is below or equal to -0.20, it'll trigger the buy signal, and vice versa. When the CMF value is above or equal to 0.20, it'll trigger the sell signal.
Simply,
CMF <= -0.20 --> Buy
CMF >= 0.20 --> Sell
The CMF trend validation strategy:
This strategy has another approach as well when getting its signals, we will combine another indicator that may confirm the trend or at least the movement of prices whether up or down with getting the signal from zero crossover. We will combine using the moving average with the CMF indicator. When the previous closing price is below the previous value of the moving average and at the same time the current ask price is above the moving average and the CMF current value is above zero the buying signal will be triggered and vice versa. When the previous closing price is above the previous value of the moving average and at the same time the current bid price is below the moving average and the CMF current value is below zero the selling signal will be triggered.
Simply,
prevClose < prevMA, ask > MA, and CMF > 0 --> Buy
prevClose > prevMA, bid < MA, and CMF < 0 --> Sell
We'll test and optimize each of these strategies by trying out different concepts to get better results as much as we can. We'll see how this works in the next section.
Chaikin Money Flow trading system
In this section, I'll show you how we can code each strategy step by step. Then, I'll test them and show you how we can optimize them to get better results. So, stay tuned and read this really interesting part of the article. Before we get into coding strategies, I'll code a small EA to show us the CMF values printed on the chart. This will be our baseline for all EAs. This will also ensure that we use an accurate indicator with accurate values in our EAs for every strategy.
Here's what we'll do next with this simple EA:
Set inputs of the EA to set up the desired periods and type of volume that will be used in the function of calling the indicator
input int                 periods=20; // Periods
input ENUM_APPLIED_VOLUME volumeTypeInp=VOLUME_TICK;  // Volume Type
Declaring an integer variable for the cmf
int cmf; In the OnInit() event, we will initialize our custom CMF indicator by calling it using the iCustom function, its parameters are:
- Symbol: This is where you'll enter the symbol name as a string. It will be (_Symbol) to be applied to the current symbol.
- Period: This is where you'll enter the period as an ENUM_TIMEFRAMES. It will be PERIOD_CURRENT to be apply the current time frame.
- Name: This is where you'll enter the name of the custom indicator you're calling with the correct path on your local machine, so you'll need to enter the folder/custom_indicator_name. It will be "Chaikin_Money_Flow".
- ...: This is where you'll enter the list of indicator input parameters if it exist. it will be periods and volumeTypeInp inputs.
Then, we will use the return value (INIT_SUCCEEDED) when the initialization is successful to move to the next part in the code.
int OnInit()
  {
   cmf = iCustom(_Symbol,PERIOD_CURRENT,"Chaikin_Money_Flow",periods,volumeTypeInp);
   return(INIT_SUCCEEDED);
  }
In the OnDeinit() event, we will state the message of EA is removed when the deinitialization event occurs.
void OnDeinit(const int reason)
  {
   Print("EA is removed");
  }
In the OnTick() event, we will declare an array for the cmfInd[] as a double data type
double cmfInd[]; Get data of a specified buffer of the cmf indicator by using the CopyBuffer function. Its parameters:
- indicator_handle: to specify the double (cmf) handle which is declared before.
- buffer_num: to specify the cmf buffer number (0).
- start_pos: to specify the start position (0).
- count: to specify count to be copied (3).
- buffer[]: to specify the cmfInd[] array to copy.
CopyBuffer(cmf,0,0,3,cmfInd);
set the AS_SERIES flag to the cmfInd[] to index the element in the time series. You can use the array[] and the flag that will be true on success as parameters.
ArraySetAsSeries(cmfInd,true);
Define a double variable for the CMF current value and normalize it with a 5-decimal limit, you can define it.
double cmfVal = NormalizeDouble(cmfInd[0], 5);
Comment on the chart the current cmf value that was previously defined by using the comment function.
Comment("CMF value = ",cmfVal);
We can find the full code in the one block of code below.
//+------------------------------------------------------------------+
//|                                                      CMF_Val.mq5 |
//+------------------------------------------------------------------+
input int                 periods=20; // Periods
input ENUM_APPLIED_VOLUME volumeTypeInp=VOLUME_TICK;  // Volume Type
int cmf;
int OnInit()
  {
   cmf = iCustom(_Symbol,PERIOD_CURRENT,"Chaikin_Money_Flow",periods,volumeTypeInp);
   return(INIT_SUCCEEDED);
  }
void OnDeinit(const int reason)
  {
   Print("EA is removed");
  }
void OnTick()
  {
    double cmfInd[];
    CopyBuffer(cmf,0,0,3,cmfInd);
    ArraySetAsSeries(cmfInd,true);
    double cmfVal = NormalizeDouble(cmfInd[0], 5);
    Comment("CMF value = ",cmfVal);
  }
After compiling this code and inserting it into the chart as an EA we can find its result the same as below:
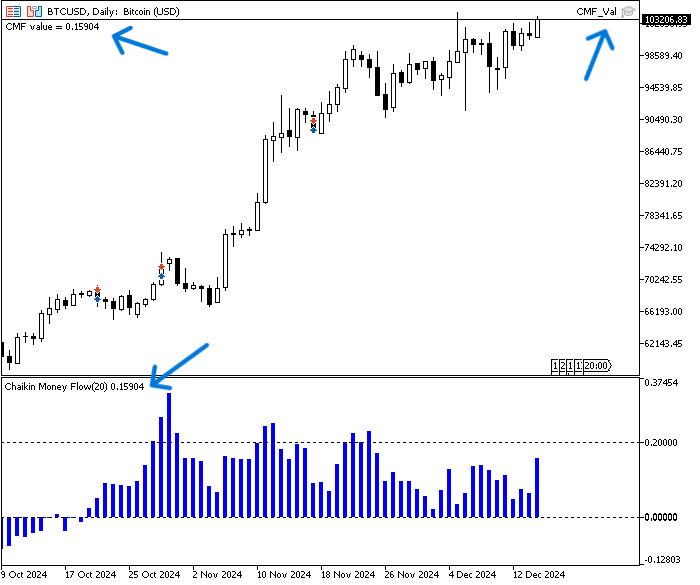
As you can see, the CMF value on the chart is the same as the one on the inserted indicator (0.15904). We can use this as a starting point for other EAs and strategies.
The CMF zero crossover strategy:
As we said, we need to code the zero crossover strategy so that the trades are automatically generated based on that crossover. The program needs to check every new bar continuously. When the crossover occurs above zero, we need it to place a buy order. When the crossover occurs below zero, we need the EA to place a sell order.Here's the full code that will do the job:
//+------------------------------------------------------------------+
//|                                           CMF_Zero_Crossover.mq5 |
//+------------------------------------------------------------------+
#include <trade/trade.mqh>
input int                 periods=20; // Periods
input ENUM_APPLIED_VOLUME volumeTypeInp=VOLUME_TICK;  // Volume Type
input double cmfPosLvls = 0.20; // CMF OB Level
input double cmfNegLvls = -0.20; // CMF OS Level
input int maPeriodInp=20; //MA Period
input double      lotSize=1;
input double      slLvl=300;
input double      tpLvl=900;
int cmf;
CTrade trade;
int barsTotal;
int OnInit()
  {
   barsTotal=iBars(_Symbol,PERIOD_CURRENT);
   cmf = iCustom(_Symbol,PERIOD_CURRENT,"Chaikin_Money_Flow",maPeriodInp,volumeTypeInp);
   return(INIT_SUCCEEDED);
  }
void OnDeinit(const int reason)
  {
   Print("EA is removed");
  }
void OnTick()
  {
   int bars=iBars(_Symbol,PERIOD_CURRENT);
   if(barsTotal != bars)
     {
      barsTotal=bars;
      double cmfInd[];
      CopyBuffer(cmf,0,0,3,cmfInd);
      ArraySetAsSeries(cmfInd,true);
      double cmfVal = NormalizeDouble(cmfInd[0], 5);
      double cmfPreVal = NormalizeDouble(cmfInd[1], 5);
      double ask = SymbolInfoDouble(_Symbol,SYMBOL_ASK);
      double bid = SymbolInfoDouble(_Symbol,SYMBOL_BID);
      if(cmfPreVal<0 && cmfVal>0)
        {
         double slVal=ask - slLvl*_Point;
         double tpVal=ask + tpLvl*_Point;
         trade.Buy(lotSize,_Symbol,ask,slVal,tpVal);
        }
      if(cmfPreVal>0 && cmfVal<0)
        {
         double slVal=bid + slLvl*_Point;
         double tpVal=bid - tpLvl*_Point;
         trade.Sell(lotSize,_Symbol,bid,slVal,tpVal);
	}
     }
  }
//+------------------------------------------------------------------+
Just to let you know, there are differences in this code:
Include the trade file for calling trade functions
#include <trade/trade.mqh> Add more inputs to be determined by the user, cmfPosLvls for oversold level, cmfNegLvls for overbought level, lot size, stop-loss, take-profit
input double cmfPosLvls = 0.20; // CMF OB Level
input double cmfNegLvls = -0.20; // CMF OS Level
input double      lotSize=1;
input double      slLvl=300;
input double      tpLvl=900;
Declaration of the trade objects, barsTotal integer variable
CTrade trade;
int barsTotal;
In the OnTick() event, we just need to check if there's a new bar to keep the code running. We can do this by using an if condition after we've defined an integer variable called bars.
int bars=iBars(_Symbol,PERIOD_CURRENT);
if(barsTotal != bars)
If there is a new bar, we need to execute the remaining code with the following differences:
Update barsTotal to be equal to bars
barsTotal=bars;
Declaring the previous cmf value
double cmfPreVal = NormalizeDouble(cmfInd[1], 5);
Declaring ask and bid double variables
double ask = SymbolInfoDouble(_Symbol,SYMBOL_ASK);
double bid = SymbolInfoDouble(_Symbol,SYMBOL_BID);
Set condition of the buying, if (cmfPreVal<0 and cmfVal>0), we need to declare SL, TP, and place a buy order
      if(cmfPreVal<0 && cmfVal>0)
        {
         double slVal=ask - slLvl*_Point;
         double tpVal=ask + tpLvl*_Point;
         trade.Buy(lotSize,_Symbol,ask,slVal,tpVal);
        }
Set condition of the selling, if (cmfPreVal>0 and cmfVal<0), we need to declare SL, TP, and place a sell order
      if(cmfPreVal>0 && cmfVal<0)
        {
         double slVal=bid + slLvl*_Point;
         double tpVal=bid - tpLvl*_Point;
         trade.Sell(lotSize,_Symbol,bid,slVal,tpVal);
        }
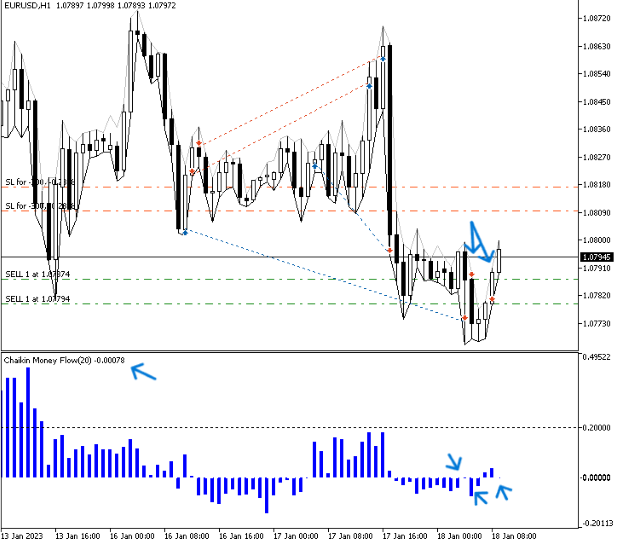
Once we've put this code together and run it by attaching it to the chart, we can see that the positions are placed the same as in the example below, which is from the testing phase.
Buy position:

Sell position:
Now, we need to test all the strategies on EURUSD for a year, from 1/1/2023 to 31/12/2023. We're going to use 300 points for SL and 900 for TP. Our main approach to optimization is to test another concept or add another tool, like the moving average. You can also test other timeframes to see which one will perform better. This type of optimization is worth a try as well.
Regarding the strategy testing results to compare between them, We will focus on the following key measurements:
- Net profit: This is calculated by subtracting the gross loss from the gross profit. The highest value is the best.
- Balance DD relative: It is the maximum loss that the account experiences during trades. The lowest is the best.
- Profit factor: This is the ratio of gross profit to gross loss. The highest is the best.
- Expected Payoff: This is the average profit or loss of a trade. The highest value is the best.
- Recovery factor: It measures how well the tested strategy recovers after losses. The highest is the best.
- Sharpe Ratio: It determines the risk and stability of the tested trading system by comparing the return with the risk-free return. The highest Sharpe Ratio is the best.
The results for the 15-minute time frame test will be the same as shown below:
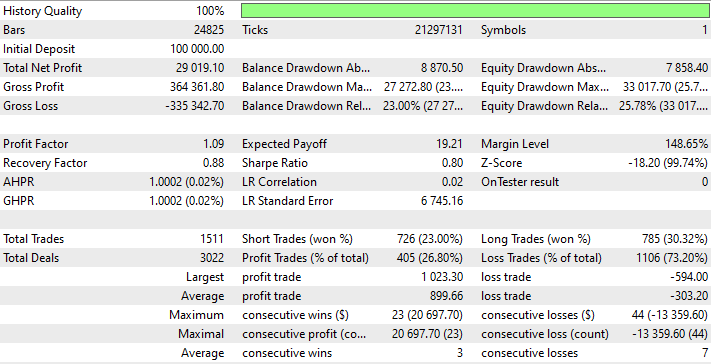
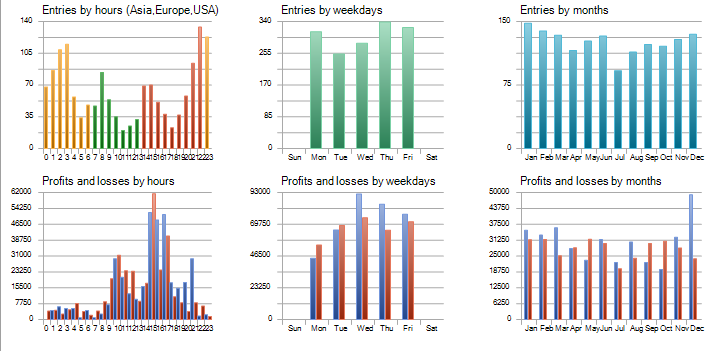
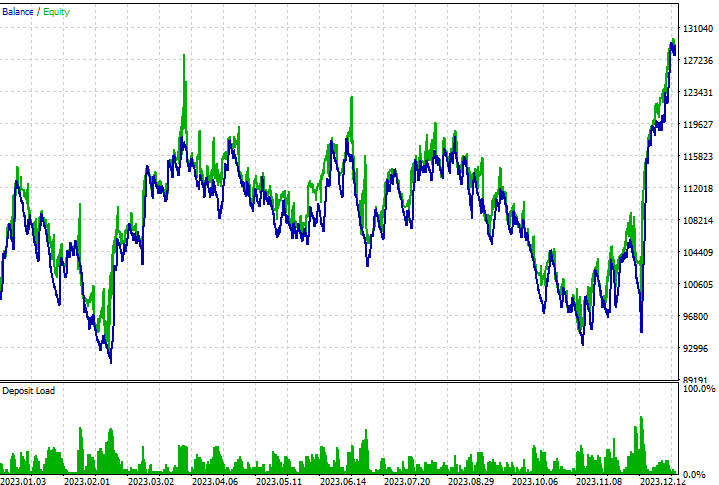
According to the results of the tests of 15 minutes, we can find the following important values for the test numbers:
- Net Profit: 29019.10 USD.
- Balance DD relative: 23%.
- Profit factor: 1.09.
- Expected payoff: 19.21.
- Recovery factor: 0.88.
- Sharpe Ratio: 0.80.
It looks like the strategy can be profitable with the 15-minute time frame, but the drawdown is high, which might increase the risk. So, we'll try another strategy with a different concept: the CMF overbought and oversold.
The CMF overbought and oversold strategy:
As we said, we need to code this strategy to place buy and sell orders based on the approaching areas of overbought and oversold automatically by the EA. The areas we're looking at are 0.20 for oversold and -0.20 for oversold. So, we need the EA to keep an eye on each CMF value and compare it with these areas. If the CMF is equal to or below -0.20, the EA should place a buy order. If the CMF value is equal to or greater than 0.20, the EA should place a sell order.
You can see the steps of creating this strategy or EA in the following full code:
//+------------------------------------------------------------------+
//|                                                 CMF_MA_OB&OS.mq5 |
//+------------------------------------------------------------------+
#include <trade/trade.mqh>
input int                 periods=20; // Periods
input ENUM_APPLIED_VOLUME volumeTypeInp=VOLUME_TICK;  // Volume Type
input double cmfPosLvls = 0.20; // CMF OB Level
input double cmfNegLvls = -0.20; // CMF OS Level
input double      lotSize=1;
input double      slLvl=300;
input double      tpLvl=900;
int cmf;
CTrade trade;
int barsTotal;
int OnInit()
  {
   barsTotal=iBars(_Symbol,PERIOD_CURRENT);
   cmf = iCustom(_Symbol,PERIOD_CURRENT,"Chaikin_Money_Flow",periods,volumeTypeInp);
   return(INIT_SUCCEEDED);
  }
void OnDeinit(const int reason)
  {
   Print("EA is removed");
  }
void OnTick()
  {
   int bars=iBars(_Symbol,PERIOD_CURRENT);
   if(barsTotal != bars)
     {
      barsTotal=bars;
      double cmfInd[];
      CopyBuffer(cmf,0,0,3,cmfInd);
      ArraySetAsSeries(cmfInd,true);
      double cmfVal = NormalizeDouble(cmfInd[0], 5);
      double cmfPreVal = NormalizeDouble(cmfInd[1], 5);
      double ask = SymbolInfoDouble(_Symbol,SYMBOL_ASK);
      double bid = SymbolInfoDouble(_Symbol,SYMBOL_BID);
      if(cmfVal<=cmfNegLvls)
        {
         double slVal=ask - slLvl*_Point;
         double tpVal=ask + tpLvl*_Point;
         trade.Buy(lotSize,_Symbol,ask,slVal,tpVal);
        }
      if(cmfVal>=cmfPosLvls)
        {
         double slVal=bid + slLvl*_Point;
         double tpVal=bid - tpLvl*_Point;
         trade.Sell(lotSize,_Symbol,bid,slVal,tpVal);
        }
     }
  }
//+------------------------------------------------------------------+
The differences in this code will be the same as below:
Set two inputs for the overbought and oversold areas, based on what the user wants. Use the default values (0.20 and -0.20) for now.
input double cmfPosLvls = 0.20; // CMF OB Level
input double cmfNegLvls = -0.20; // CMF OS Level
Conditions of the strategy
Place a buy position when the CMF value is less than or equal the cmfNegLvls
      if(cmfVal<=cmfNegLvls)
        {
         double slVal=ask - slLvl*_Point;
         double tpVal=ask + tpLvl*_Point;
         trade.Buy(lotSize,_Symbol,ask,slVal,tpVal);
        }
Place a sell position when the CMF value is greater than or equal the cmfPosLvls
      if(cmfVal>=cmfPosLvls)
        {
         double slVal=bid + slLvl*_Point;
         double tpVal=bid - tpLvl*_Point;
         trade.Sell(lotSize,_Symbol,bid,slVal,tpVal);
        }
Once we've put this code together and run it through the chart, we can see where the positions are in line with the strategy conditions, just like in the examples from the testing phase.
Buy position:
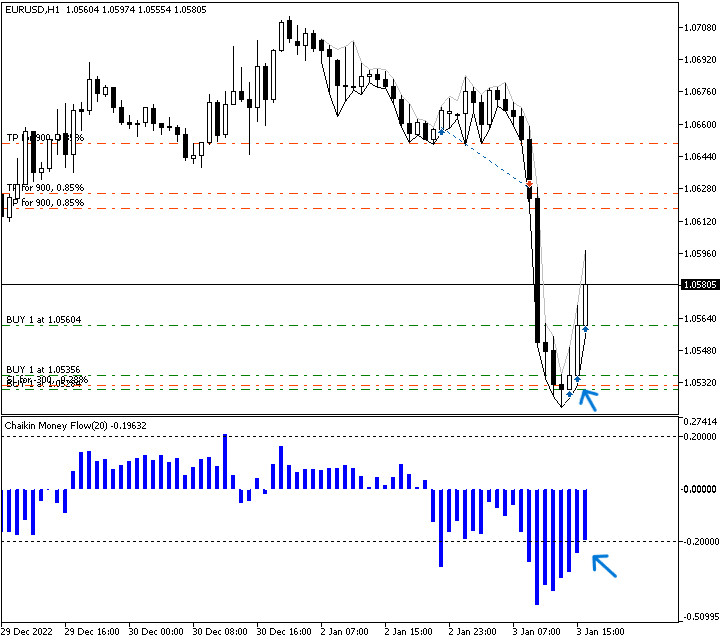
Sell position:
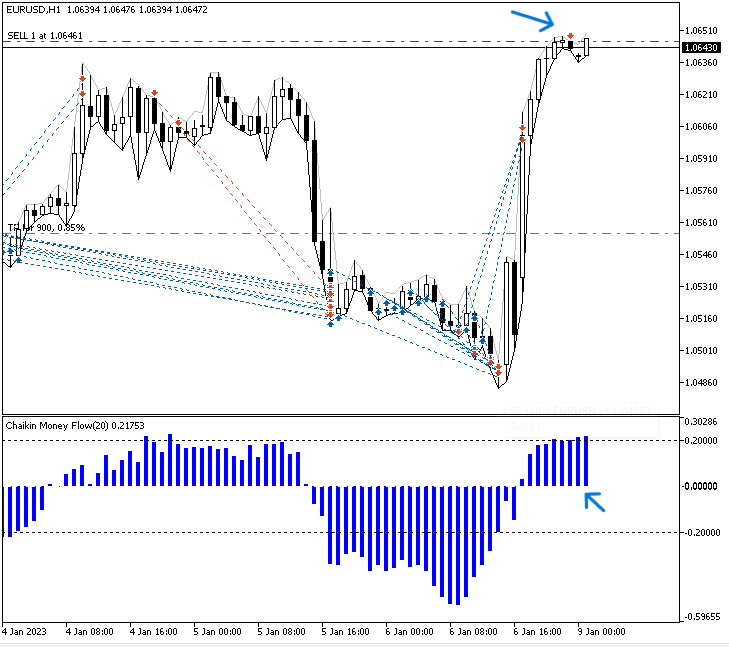
We're going to test this strategy using the same approach we used for the previous testing of the CMF zero crossover strategy. We'll be testing EURUSD from 1/1/2023 to 12/31/2023 on the 15-minute time frame with 300 points for SL and 900 for TP. The following figures show the results of this testing:
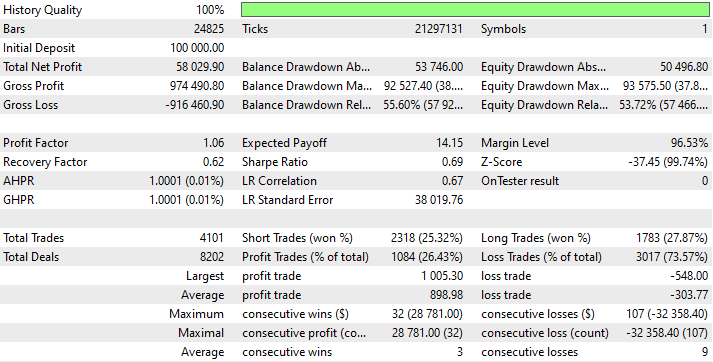
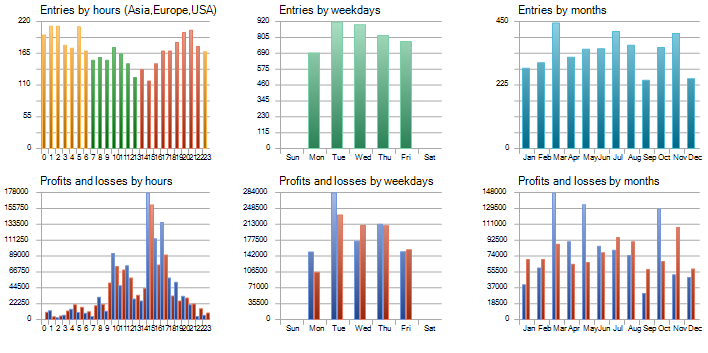
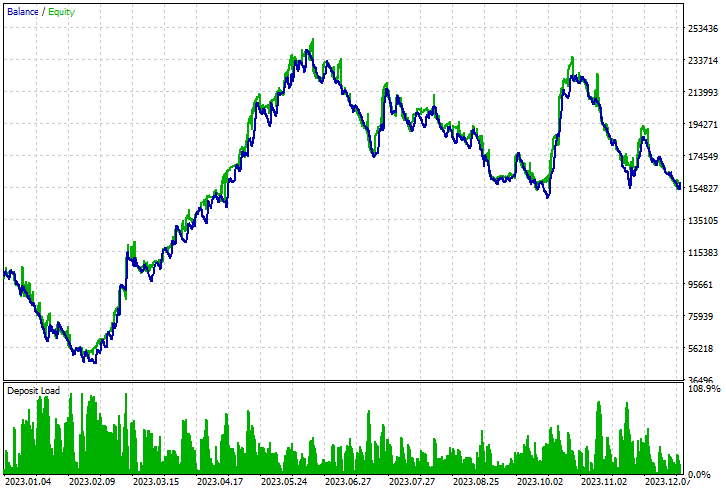
According to the results of the tests of 15 minutes, we can find the following important values for the test numbers:
- Net Profit: 58029.90 USD.
- Balance DD relative: 55.60%.
- Profit factor: 1.06.
- Expected payoff: 14.15.
- Recovery factor: 0.62.
- Sharpe Ratio: 0.69.
Now that we're seeing more profits with a higher drawdown, we're going to try to optimize it by adding or combining another technical indicator with the CMF zero crossover for trend validation, we'll see what happens in the next strategy.
The CMF trend validation strategy:
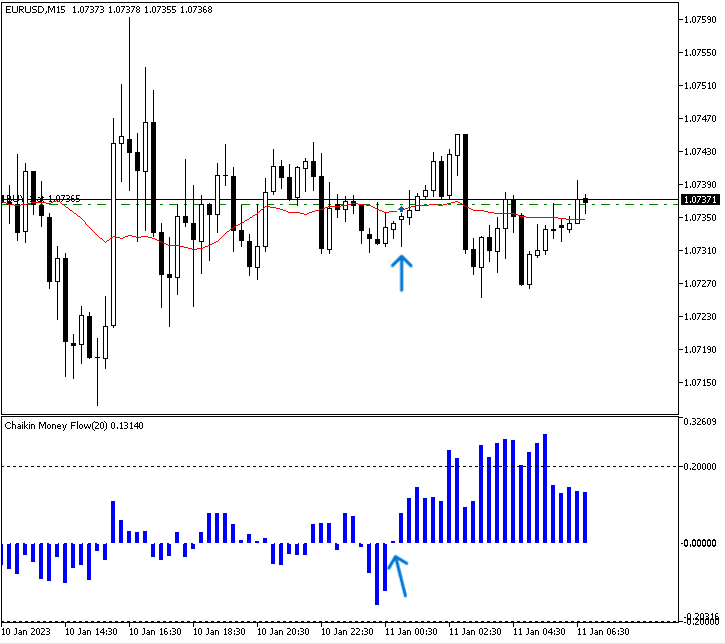
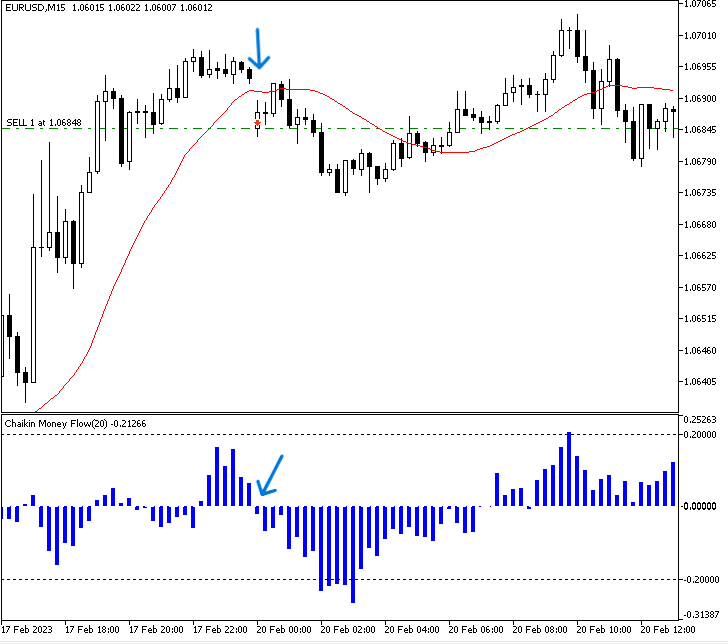
As we said, we need to add or combine another technical indicator, the moving average, with the CMF zero crossover to validate the movement of both directions (up and down). The EA needs to check every closing price, ask, and the CMF. The value is used to decide the position of each relative to the others. When the last closing price is below the last moving average value, the current ask price is above the current moving average, and the CMF value is above zero, we need to place a buy order. On the other hand, when the last closing price is above the last moving average value, the current bid price is below the current moving average, and the CMF value is below zero, we need to place a sell order.
Here's the full code for this EA:
//+------------------------------------------------------------------+
//|                                          CMF_trendValidation.mq5 |
//+------------------------------------------------------------------+
#include <trade/trade.mqh>
input int                 periods=20; // Periods
input ENUM_APPLIED_VOLUME volumeTypeInp=VOLUME_TICK;  // Volume Type
input int maPeriodInp=20; //MA Period
input double      lotSize=1;
input double      slLvl=300;
input double      tpLvl=900;
int cmf;
int ma;
CTrade trade;
int barsTotal;
int OnInit()
  {
   barsTotal=iBars(_Symbol,PERIOD_CURRENT);
   cmf = iCustom(_Symbol,PERIOD_CURRENT,"Chaikin_Money_Flow",periods,volumeTypeInp);
   ma = iMA(_Symbol,PERIOD_CURRENT,maPeriodInp,0,MODE_SMA,PRICE_CLOSE);
   return(INIT_SUCCEEDED);
  }
void OnDeinit(const int reason)
  {
   Print("EA is removed");
  }
void OnTick()
  {
   int bars=iBars(_Symbol,PERIOD_CURRENT);
   if(barsTotal != bars)
     {
      barsTotal=bars;
      double cmfInd[];
      double maInd[];
      CopyBuffer(cmf,0,0,3,cmfInd);
      CopyBuffer(ma,0,0,3,maInd);
      ArraySetAsSeries(cmfInd,true);
      ArraySetAsSeries(maInd,true);
      double cmfVal = NormalizeDouble(cmfInd[0], 5);
      double maVal= NormalizeDouble(maInd[0],5);
      double cmfPreVal = NormalizeDouble(cmfInd[1], 5);
      double maPreVal = NormalizeDouble(maInd[1],5);;
      double ask = SymbolInfoDouble(_Symbol,SYMBOL_ASK);
      double bid = SymbolInfoDouble(_Symbol,SYMBOL_BID);
      double prevClose = iClose(_Symbol,PERIOD_CURRENT,1);
      if(prevClose<maPreVal && ask>maVal)
        {
         if(cmfVal>0)
           {
            double slVal=ask - slLvl*_Point;
            double tpVal=ask + tpLvl*_Point;
            trade.Buy(lotSize,_Symbol,ask,slVal,tpVal);
           }
        }
      if(prevClose>maPreVal && bid<maVal)
        {
         if(cmfVal<0)
           {
            double slVal=bid + slLvl*_Point;
            double tpVal=bid - tpLvl*_Point;
            trade.Sell(lotSize,_Symbol,bid,slVal,tpVal);
           }
        }
     }
  }
//+------------------------------------------------------------------+
The main differences in this code are as follows:
Add another input for the user to determine the period of used moving average
input int maPeriodInp=20; //MA Period
Declaration of an integer variable for the moving average
int ma; Define the ma-created variable using the iMA function, its parameters are:
- symbol: to set the symbol name, it will be (_Symbol) to be applied on the current one.
- period: to set the period of the moving average and it will be (PERIOD_CURRENT) to be applied on the currently used time frame.
- ma_period: to set the averaging period, it will be the user input of (maPeriodInp).
- ma_shift: to set the horizontal shift if needed.
- ma_method: to specify the smoothing type or the moving average type, it will (MODE_SMA) to use the simple MA.
- applied_price: to specify the type of price, it will be (PRICE_CLOSE).
ma = iMA(_Symbol,PERIOD_CURRENT,maPeriodInp,0,MODE_SMA,PRICE_CLOSE);
Declare the maInd[] array
double maInd[]; Get data of a specified buffer of the MA indicator by using the CopyBuffer function.
CopyBuffer(ma,0,0,3,maInd);
Set the AS_SERIES flag to the maInd[] to index element in timeseries.
ArraySetAsSeries(maInd,true);
Define the current and previous MA values
double maVal= NormalizeDouble(maInd[0],5);
double prevClose = iClose(_Symbol,PERIOD_CURRENT,1);
Conditions of the buy position, prevClose<maPreVal, ask>maVal, and cmfVal>0
      if(prevClose<maPreVal && ask>maVal)
        {
         if(cmfVal>0)
           {
            double slVal=ask - slLvl*_Point;
            double tpVal=ask + tpLvl*_Point;
            trade.Buy(lotSize,_Symbol,ask,slVal,tpVal);
           }
        }
Conditions of the sell position, prevClose>maPreVal, bid<maVal, and cmfVal<0
      if(prevClose>maPreVal && bid<maVal)
        {
         if(cmfVal<0)
           {
            double slVal=bid + slLvl*_Point;
            double tpVal=bid - tpLvl*_Point;
            trade.Sell(lotSize,_Symbol,bid,slVal,tpVal);
           }
        }
After executing this EA we can find the placed order as shown in the figures below:
The buy position:
The sell position:
We will test this strategy using the same approach as the previous tests for the CMF zero crossover and the OB and OS strategies, we will test EURUSD from 1/1/2023 - 31/12/2023 on the 15-minute time frame with 300 points for SL and 900 for TP. The following figures are for the result of this test:
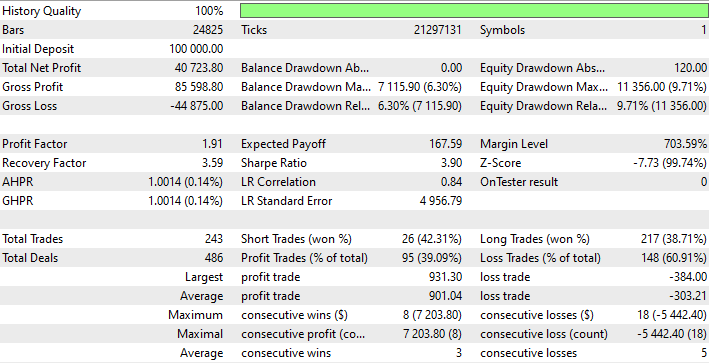
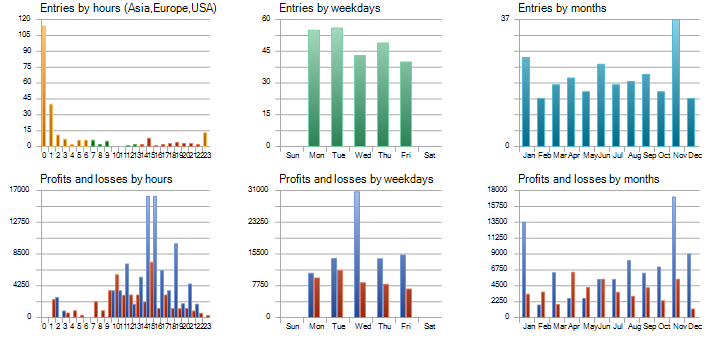
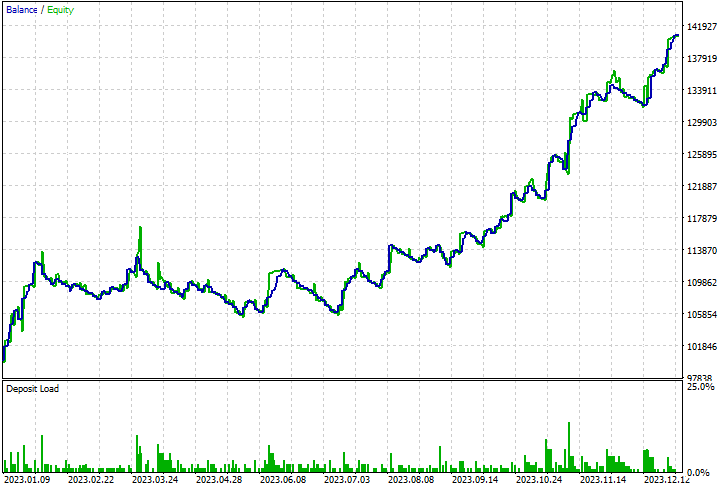
According to the results of the tests of 15 minutes, we can find the following important values for the test numbers:
- Net Profit: 40723.80 USD.
- Balance DD relative: 6.30%.
- Profit factor: 1.91.
- Expected payoff: 167.59.
- Recovery factor: 3.59.
- Sharpe Ratio: 3.90.
Looking at the results of each strategy, it is clear that CMF Trend Validation is the best in terms of key measurements.
Conclusion
As we have seen throughout this article, volume is a very important concept in trading, especially when combined with other important tools, in addition, we have realized that optimization is a very important task when testing any strategy as it can be affected by small changes. I advise you to do your tests by changing different aspects such as timeframe, SL, and TP and adding other tools until you find reasonable results.
It is assumed that you understand how to use the Chaikin Money Flow volume indicator, how to customize and code it, and how to build, optimize, and test EAs based on different simple strategies:
- The CMF zero crossover strategy.
- The CMF OB and OS strategy.
- The CMF Trend Validation strategy.
In addition, you have understood which one is better based on optimization and test results. I hope you found this article useful and if you want to read more articles for me, such as building trading systems based on the most popular technical indicators and others, you can order them through my publication page.
You can find my attached source code files the same as below:
| File Name | Description |
|---|---|
| Chaikin_Money_Flow | It is for our created custom CMF indicator |
| CMF_Zero_Crossover | It is for the EA of CMF with Zero crossover trading strategy |
| CMF_OBOS | It is for the EA of CMF with overbought and oversold trading strategy |
| CMF_trendValidation | It is for the EA of CMF with movement/trend validation trading strategy |
 Integrating MQL5 with data processing packages (Part 4): Big Data Handling
 Automating Trading Strategies in MQL5 (Part 2): The Kumo Breakout System with Ichimoku and Awesome Oscillator
 Mastering File Operations in MQL5: From Basic I/O to Building a Custom CSV Reader
 Build Self Optimizing Expert Advisors in MQL5 (Part 2): USDJPY Scalping Strategy
- Free trading apps
- Over 8,000 signals for copying
- Economic news for exploring financial markets
You agree to website policy and terms of use