DRAW_ARROW Zeichnungstyp in Multi-Symbol-Multi-Perioden-Indikatoren

Inhalt
Einführung
Wir setzen das Thema der Multi-Symbol-Multi-Perioden-Indikatoren fort. Der vorige Artikel dieser Reihe behandelte das Thema der Multi-Symbol-Multi-Perioden-Indikatoren. In diesem Artikel werden wir die Multi-Indikator-Klasse so ändern, dass sie mit Pfeil-Indikatoren arbeiten kann.
Pfeilindikatoren bedeuten, dass nicht immer Daten in ihrem Puffer, der gezeichnet wird, verfügbar sind. Ist ein Wert in dem Puffer vorhanden, wird der Pfeil angezeigt, andernfalls enthält der Puffer den dafür eingestellten leeren Wert. Normalerweise ist dies EMPTY_VALUE, aber es ist möglich, den Puffer auf einen beliebigen Wert zu setzen, der dann für „leer“ steht und nicht im Chart angezeigt wird. Dies wird erreicht durch folgende Funktion:
PlotIndexSetDouble(buffer_index,PLOT_EMPTY_VALUE,empty_value);
wobei buffer_index der Pufferindex des Puffers ist, für den mit empty_value der „Leerwert“ festgelegt wird.
Bei Mehrperioden-Indikatoren, bei denen die Datenpuffer Lücken aufweisen, ist es notwendig, das Vorhandensein von „leeren“ Werten zu berücksichtigen, sodass keine Pfeile gezeichnet werden, und diese „leeren“ Werte nicht in den Balken des Charts erscheinen, in dem bereits ein nicht-leerer Wert geschrieben ist. Andernfalls wird der zuvor platzierte Pfeil durch einen neuen „leeren“ Wert gelöscht. Dies ist der Fall, wenn Daten aus einem Indikator, der in einem niedrigeren Zeitrahmen berechnet wurde, in einen höheren Zeitrahmen kopiert werden.
Lassen Sie mich ein Beispiel nennen. Die М15-Balken werden dem M5-Chart überlagert:
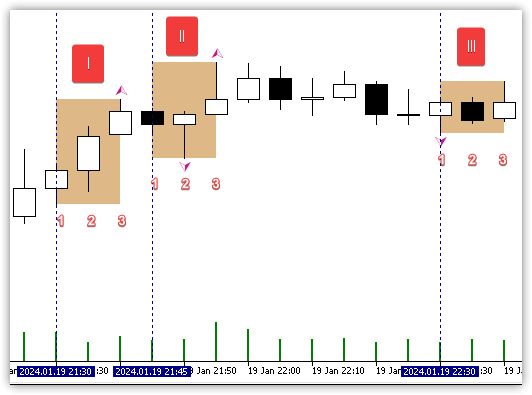
Hier sehen wir die Fraktale des M5-Charts, die auf den Balken des M15-Charts installiert werden müssen.
- Für den ersten Balken M15 (I) müssen wir das obere Fraktal auf Balken 3 zeichnen - dieses Fraktal wird auf jeden Fall auf M15 sichtbar sein, da es das letzte der drei ist.
- Für den zweiten Balken M15 (II) müssen wir ein Fraktal festlegen, das sich auf Balken 2 befindet - dieses Fraktal wird auf M15 nur dann sichtbar sein, wenn wir den leeren Wert von Balken 3 nicht kopieren, da es den Wert des unteren Fraktals ersetzen wird. Der M15-Balken wird zwei Fraktale haben - ein oberes und ein unteres, da es auf dem M5 ein unteres Fraktal auf Balken 2 und ein oberes Fraktal auf Balken 3 gibt.
- Für den dritten M15-Balken (III) müssen wir das obere Fraktal von Balken 1 zeichnen - dieses Fraktal wird auf M15 nur sichtbar, wenn wir keine leeren Werte aus den Balken 2 und 3 kopieren, da diese den Fraktalwert ersetzen würden.
Wir müssen also den Wert auf dem Balken des aktuellen Charts verfolgen, und wenn dieser leer ist, dann können wir einen beliebigen Wert aus dem Puffer des unteren Zeitrahmens kopieren. Wenn der Wert jedoch nicht mehr leer ist, brauchen wir nur den nicht-leeren Wert zu kopieren. In diesem Fall enthält der Chartbalken des höheren Zeitrahmens den Wert des letzten Fraktals aus denjenigen Balken des niedrigeren Zeitrahmens, die Teil des Balkens der höheren Chartperiode sind. Warum gerade der letzte Balken, und nicht der erste? Ich denke, dass der letzte Wert relevanter ist, da er näher an der aktuellen Zeit liegt.
Beim Kopieren von Indikatordaten, die auf einem höheren Zeitrahmen berechnet wurden, in einen Chart mit einem niedrigeren Zeitrahmen ist zu berücksichtigen, dass der Pfeil nicht auf dem Null- oder dem ersten Balken des Charts platziert werden kann, sondern z. B. auf dem zweiten, dritten oder höheren Balken. Wenn wir nur die Daten des ersten und des Null-Balkens kopieren, wie es jetzt in der Multi-Indikatorenklasse der Fall ist, werden keine Pfeile auf dem Chart angezeigt - sie befinden sich einfach auf Balken mit einem höheren Index, und dementsprechend kann der Indikatorberechnungsalgorithmus sie einfach nicht sehen:
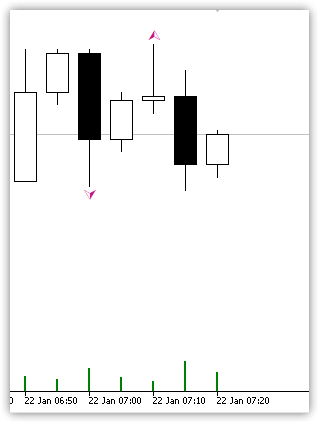
Hier sehen wir, dass das Fraktal auf dem Balken mit dem Index 2 gebildet wird. Wenn wir nur den Null- und den ersten Balken kopieren, wird dieses Fraktal für das Programm nicht sichtbar sein.
Da wir also nicht genau wissen können, welcher Indikator seine Pfeile auf welchem Balken platziert, ist es für die Klasse der Multi-Indikatoren notwendig, eine Variable einzuführen, in der wir explizit angeben, ab welchem Balken die Suche und das Kopieren von Werten beginnt. Im Moment kopiert die Klasse nur den ersten und den Null-Balken des aktuellen Ticks. Dementsprechend kann es keine Fraktale geben - die Werte beginnen bei dem Balken mit dem Index 2 für sie.
Wenn wir einen nutzerdefinierten Indikator als Anfangsindikator verwenden, kann er Pfeile auf jedem anderen Balken platzieren - nicht nur auf dem zweiten, wie der Fractals-Indikator. Wenn es sich beispielsweise um einen Indikator für nutzerdefinierte Fraktale handelt, bei dem Fraktale einer anderen Dimension gesucht werden, z. B. 3-X-3, dann kann der Pfeil auf einem Balken mit dem Index 3 (wenn das Fraktal neu gezeichnet ist) oder 4 (wenn das Fraktal nicht neu gezeichnet ist) platziert werden.
Bei Standardindikatoren wird der Balkenindex explizit angegeben, da er bekannt ist. Für nutzerdefinierte Indikatoren wird es möglich sein, die Startleiste für die Suche in den Parametern des Klassenkonstruktors anzugeben.
Verfeinerung von Multi-Indikator-Klassen
Beim Kopieren von Daten in Klassenmethoden haben wir lokale temporäre Arrays verwendet. Wir sollten sie global machen, damit wir nicht jedes Mal erneut Speicher für diese Arrays zuweisen müssen.
Im privaten Bereich der CIndMSTF-Basisklasse der Multi-Symbol-Multi-Perioden-Indikatoren deklarieren wir neue Arrays, während wir im geschützten Bereich eine Variable deklarieren, in der die Anzahl der Balken für die Berechnung des Indikators zum aktuellen Tick gespeichert wird:
//+------------------------------------------------------------------+
//| Base class of the multi-symbol multi-period indicator            |
//+------------------------------------------------------------------+
class CIndMSTF : public CObject
  {
private:
   ENUM_PROGRAM_TYPE m_program;           // Program type
   ENUM_INDICATOR    m_type;              // Indicator type
   ENUM_TIMEFRAMES   m_timeframe;         // Chart timeframe
   string            m_symbol;            // Chart symbol
   int               m_handle;            // Indicator handle
   int               m_id;                // Identifier
   bool              m_success;           // Successful calculation flag
   ENUM_ERR_TYPE     m_type_err;          // Calculation error type
   string            m_description;       // Custom description of the indicator
   string            m_name;              // Indicator name
   string            m_parameters;        // Description of indicator parameters
   double            m_array_data[];      // Temporary array for copying data
   datetime          m_array_time[];      // Temporary array for copying time

protected:
   ENUM_IND_CATEGORY m_category;          // Indicator category
   MqlParam          m_param[];           // Array of indicator parameters
   string            m_title;             // Title (indicator name + description of parameters)
   SBuffer           m_buffers[];         // Indicator buffers
   int               m_digits;            // Digits in indicator values
   int               m_limit;             // Number of bars required to calculate the indicator on the current tick
   int               m_rates_total;       // Number of available bars for indicator calculation
   int               m_prev_calculated;   // Number of calculated bars on the previous indicator call
   uint              m_bars_to_calculate; // Number of bars required to calculate the indicator on the current tick
Wir schreiben im öffentlichen Teil der Klasse die Methode, die die Anzahl der Balken festlegt, die zur Berechnung des Indikators für den aktuellen Tick erforderlich sind:
//--- Returns amount of calculated data
   int               Calculated(void)                          const { return ::BarsCalculated(this.m_handle); }
//--- Set the number of bars required to calculate the indicator on the current tick
   void              SetBarsToCalculate(const int bars)
                       {
                        this.m_bars_to_calculate=bars;
                        if(this.m_array_data.Size()!=this.m_bars_to_calculate)
                          {
                           ::ArrayResize(this.m_array_data,this.m_bars_to_calculate);
                           ::ArrayResize(this.m_array_time,this.m_bars_to_calculate);
                          }
                       }

//--- Virtual method returning the type of object (indicator)
Die Methode erhält die erforderliche Anzahl von Balken. Der Wert wird für die neue Variable festgelegt, während die Größen der Arrays gleich dem Wert dieser Variablen gesetzt werden.
Wenn also die Größe der Arrays erfolgreich geändert wird, müssen sie bei den Datenkopiermethoden nicht mehr jedes Mal neu installiert werden. Wenn es nicht möglich ist, die Größe der Arrays hier zu ändern, dann versuchen in diesem Fall die Funktionen zum Kopieren von Daten innerhalb der Kopiermethoden, die Größe des Arrays auf den gewünschten Wert zu ändern. Wenn auch dies fehlschlägt, zeigen die Methoden eine Kopierfehlermeldung an.
Daher legen wir die erforderliche Größe für die Arrays einmal fest - entweder im Klassenkonstruktor oder (falls dies nicht gelingt) in den Kopiermethoden. Dann verwenden wir Arrays mit der erforderlichen Größe, was uns die ständige Neuzuweisung von Speicher für die Arrays erspart.
Im Klassenkonstruktor rufen wir die Methode mit dem Standardwert auf, um Daten zu kopieren (erste und null). Bei der überwiegenden Mehrheit der Indikatoren entspricht er zwei Balken:
//+------------------------------------------------------------------+
//| Constructor                                                      |
//+------------------------------------------------------------------+
CIndMSTF::CIndMSTF(const ENUM_INDICATOR type,const uint buffers,const string symbol,const ENUM_TIMEFRAMES timeframe)
  {
//--- Start the timer
   ::ResetLastError();
   if(!::EventSetTimer(1))
      ::PrintFormat("%s: EventSetTimer failed. Error %lu",__FUNCTION__,::GetLastError());
//--- Set properties to the values passed to the constructor or to default values
   this.m_program=(ENUM_PROGRAM_TYPE)::MQLInfoInteger(MQL_PROGRAM_TYPE);
   this.m_type=type;
   this.m_symbol=(symbol==NULL || symbol=="" ? ::Symbol() : symbol);
   this.m_timeframe=(timeframe==PERIOD_CURRENT ? ::Period() : timeframe);
   this.m_handle=INVALID_HANDLE;
   this.m_digits=::Digits();
   this.m_success=true;
   this.m_type_err=ERR_TYPE_NO_ERROR;
//--- Set the size of the buffer structure array to the number of indicator buffers
   ::ResetLastError();
   if(::ArrayResize(this.m_buffers,buffers)!=buffers)
      ::PrintFormat("%s: Buffers ArrayResize failed. Error  %lu"__FUNCTION__,::GetLastError());
//--- Set the "empty" value for each buffer by default (can be changed it later)
   for(int i=0;i<(int)this.m_buffers.Size();i++)
      this.SetBufferInitValue(i,EMPTY_VALUE);
//--- Set initial values of variables involved in resource-efficient calculation of the indicator
   this.m_prev_calculated=0;
   this.m_limit=0;
   this.m_rates_total=::Bars(this.m_symbol,this.m_timeframe);
   this.SetBarsToCalculate(2);
//--- If the indicator is calculated on non-current chart, request data from the required chart
//--- (the first access to data starts data pumping)
   datetime array[];
   if(symbol!=::Symbol() || timeframe!=::Period())
      ::CopyTime(this.m_symbol,this.m_timeframe,0,this.m_rates_total,array);
  }
Im Destruktor der Klasse geben wir den für temporäre Arrays reservierten Speicher frei:
//+------------------------------------------------------------------+
//| Destructor                                                       |
//+------------------------------------------------------------------+
CIndMSTF::~CIndMSTF()
  {
//--- Delete timer
   ::EventKillTimer();
//--- Release handle of the indicator
   ::ResetLastError();
   if(this.m_handle!=INVALID_HANDLE && !::IndicatorRelease(this.m_handle))
      ::PrintFormat("%s: %s, handle %ld IndicatorRelease failed. Error %ld",__FUNCTION__,this.Title(),m_handle,::GetLastError());
//--- Free up the memory of buffer arrays
   for(int i=0;i<(int)this.BuffersTotal();i++)
     {
      ::ArrayFree(this.m_buffers[i].array0);
      ::ArrayFree(this.m_buffers[i].array1);
      ::ArrayFree(this.m_buffers[i].array2);
      ::ArrayFree(this.m_buffers[i].array3);
      ::ArrayFree(this.m_buffers[i].color_indexes);
     }
//--- Free up the memory of temporary arrays
   ::ArrayFree(this.m_array_data);
   ::ArrayFree(this.m_array_time);
  }
Nun überprüfen wir die Menge der kopierten Daten anhand des Wertes, der in der neuen Variablen in der Methode zum Kopieren der Daten des angegebenen Puffer-Arrays festgelegt wurde. Zuvor gab es einen fest kodierten Wert von zwei Balken:
//+------------------------------------------------------------------+
//| Copy data of the specified array of the specified buffer         |
//+------------------------------------------------------------------+
bool CIndMSTF::CopyArray(const uint buff_num,const uint array_num,const int to_copy,double &array[])
  {
   ::ResetLastError();
//--- Copy either the last two bars to 'array' or all available historical data from indicator's calculation part array to buffer array of indicator object
   int copied=0;
   if(to_copy==this.m_bars_to_calculate)
     {
      switch(array_num)
        {
         case 0   :  case 1 : case 2 :
         case 3   :  copied=::CopyBuffer(this.m_handle,this.m_buffers[buff_num].BufferFrom(),  -this.m_buffers[buff_num].Shift(),to_copy,array);   break;
         case 4   :  copied=::CopyBuffer(this.m_handle,this.m_buffers[buff_num].BufferFrom()+1,-this.m_buffers[buff_num].Shift(),to_copy,array);   break;
         default  :  break;
        }
     }
   else
     {
      switch(array_num)
        {
         case 0   :  copied=::CopyBuffer(this.m_handle,this.m_buffers[buff_num].BufferFrom(),  -this.m_buffers[buff_num].Shift(),to_copy,this.m_buffers[buff_num].array0);          break;
         case 1   :  copied=::CopyBuffer(this.m_handle,this.m_buffers[buff_num].BufferFrom(),  -this.m_buffers[buff_num].Shift(),to_copy,this.m_buffers[buff_num].array1);          break;
         case 2   :  copied=::CopyBuffer(this.m_handle,this.m_buffers[buff_num].BufferFrom(),  -this.m_buffers[buff_num].Shift(),to_copy,this.m_buffers[buff_num].array2);          break;
         case 3   :  copied=::CopyBuffer(this.m_handle,this.m_buffers[buff_num].BufferFrom(),  -this.m_buffers[buff_num].Shift(),to_copy,this.m_buffers[buff_num].array3);          break;
         case 4   :  copied=::CopyBuffer(this.m_handle,this.m_buffers[buff_num].BufferFrom()+1,-this.m_buffers[buff_num].Shift(),to_copy,this.m_buffers[buff_num].color_indexes);   break;
         default  :  break;
        }
     }
//--- If copied successfully
   if(copied>0)
      return true;
//--- If not all data is copied
//--- If CopyBuffer returned -1, this means the start of historical data downloading
//--- print a message about this to the log
   if(copied==WRONG_VALUE)
      ::PrintFormat("%s::%s: Start downloading data by %s/%s. Waiting for the next tick...",__FUNCTION__,this.Title(),this.m_symbol,this.TimeframeDescription());
//--- In any other case, not all data has been copied yet
//--- print a message about this to the log
   else
      ::PrintFormat("%s::%s: Not all data was copied. Data available: %lu, total copied: %ld",__FUNCTION__,this.Title(),this.m_rates_total,copied);
   return false;
  }
Bei der Methode des Kopierens der Daten aller Arrays des angegebenen Puffers war das Kopieren von zwei Balken bisher hart kodiert. Außerdem wurden die Quell- und Zielindizes des Pufferarrays explizit gesetzt:
//+------------------------------------------------------------------+
//| Copy data of all arrays of the specified buffer                  |
//+------------------------------------------------------------------+
bool CIndMSTF::CopyArrays(const uint buff_num,const int to_copy)
  {
   bool res=true;
   double array[2];
   if(to_copy==2)
     {

      switch(this.BufferDrawType(buff_num))
        {
         //--- One buffer
         case DRAW_LINE             :
         case DRAW_HISTOGRAM        :
         case DRAW_ARROW            :
         case DRAW_SECTION          :
            res=this.CopyArray(buff_num,0,to_copy,array);
            if(res)
              {
               this.m_buffers[buff_num].array0[this.DataTotal(buff_num,0)-1]=array[1];
               this.m_buffers[buff_num].array0[this.DataTotal(buff_num,0)-2]=array[0];
              }
            return res;
         //--- Two buffers
         case DRAW_HISTOGRAM2       :
         case DRAW_ZIGZAG           :
         case DRAW_FILLING          :
Nun ist die Menge der kopierten Daten nicht im Voraus bekannt. Sie wird mit einer neuen Variablen angegeben. Daher werden wir den Wert der Variablen überprüfen, während die Daten in einer Schleife um die Menge der kopierten Daten kopiert werden.
Wir berechnen die Indizes der Quell- und Ziel-Arrays aus dem Schleifenindex. Gleichzeitig haben wir nun das globale temporäre Array angekündigt, sodass das lokale Array nicht mehr benötigt wird:
//+------------------------------------------------------------------+
//| Copy data of all arrays of the specified buffer                  |
//+------------------------------------------------------------------+
bool CIndMSTF::CopyArrays(const uint buff_num,const int to_copy)
  {
   bool res=true;
   if(to_copy==this.m_bars_to_calculate)

     {
      int total=(int)this.m_array_data.Size();
      switch(this.BufferDrawType(buff_num))
        {
         //--- One buffer
         case DRAW_LINE             :
         case DRAW_HISTOGRAM        :
         case DRAW_ARROW            :
         case DRAW_SECTION          :
            res=this.CopyArray(buff_num,0,to_copy,this.m_array_data);
            if(res)
              {
               for(int i=0;i<total;i++)
                  this.m_buffers[buff_num].array0[this.DataTotal(buff_num,0)-(total-i)]=this.m_array_data[i];
              }
            return res;
         //--- Two buffers
         case DRAW_HISTOGRAM2       :
         case DRAW_ZIGZAG           :
         case DRAW_FILLING          :
            res=this.CopyArray(buff_num,0,to_copy,this.m_array_data);
            if(res)
              {
               for(int i=0;i<total;i++)
                  this.m_buffers[buff_num].array0[this.DataTotal(buff_num,0)-(total-i)]=this.m_array_data[i];
              }
            res &=this.CopyArray(buff_num,1,to_copy,this.m_array_data);
            if(res)
              {
               for(int i=0;i<total;i++)
                  this.m_buffers[buff_num].array1[this.DataTotal(buff_num,1)-(total-i)]=this.m_array_data[i];
              }
            return res;
         //--- Four buffers
         case DRAW_BARS             :
         case DRAW_CANDLES          :
            res=this.CopyArray(buff_num,0,to_copy,this.m_array_data);
            if(res)
              {
               for(int i=0;i<total;i++)
                  this.m_buffers[buff_num].array0[this.DataTotal(buff_num,0)-(total-i)]=this.m_array_data[i];
              }
            res &=this.CopyArray(buff_num,1,to_copy,this.m_array_data);
            if(res)
              {
               for(int i=0;i<total;i++)
                  this.m_buffers[buff_num].array1[this.DataTotal(buff_num,1)-(total-i)]=this.m_array_data[i];
              }
            res &=this.CopyArray(buff_num,2,to_copy,this.m_array_data);
            if(res)
              {
               for(int i=0;i<total;i++)
                  this.m_buffers[buff_num].array2[this.DataTotal(buff_num,2)-(total-i)]=this.m_array_data[i];
              }
            res &=this.CopyArray(buff_num,3,to_copy,this.m_array_data);
            if(res)
              {
               for(int i=0;i<total;i++)
                  this.m_buffers[buff_num].array3[this.DataTotal(buff_num,3)-(total-i)]=this.m_array_data[i];
              }
            return res;
         //--- One buffer + color buffer
         case DRAW_COLOR_LINE       :
         case DRAW_COLOR_HISTOGRAM  :
         case DRAW_COLOR_ARROW      :
         case DRAW_COLOR_SECTION    :
            res=this.CopyArray(buff_num,0,to_copy,this.m_array_data);
            if(res)
              {
               for(int i=0;i<total;i++)
                  this.m_buffers[buff_num].array0[this.DataTotal(buff_num,0)-(total-i)]=this.m_array_data[i];
              }
            res &=this.CopyArray(buff_num,4,to_copy,this.m_array_data);
            if(res)
              {
               for(int i=0;i<total;i++)
                  this.m_buffers[buff_num].color_indexes[this.DataTotal(buff_num,4)-(total-i)]=this.m_array_data[i];
              }
            return res;
         //--- Two buffers + color buffer
         case DRAW_COLOR_HISTOGRAM2 :
         case DRAW_COLOR_ZIGZAG     :
            res=this.CopyArray(buff_num,0,to_copy,this.m_array_data);
            if(res)
              {
               for(int i=0;i<total;i++)
                  this.m_buffers[buff_num].array0[this.DataTotal(buff_num,0)-(total-i)]=this.m_array_data[i];
              }
            res &=this.CopyArray(buff_num,1,to_copy,this.m_array_data);
            if(res)
              {
               for(int i=0;i<total;i++)
                  this.m_buffers[buff_num].array1[this.DataTotal(buff_num,1)-(total-i)]=this.m_array_data[i];
              }
            res &=this.CopyArray(buff_num,4,to_copy,this.m_array_data);
            if(res)
              {
               for(int i=0;i<total;i++)
                  this.m_buffers[buff_num].color_indexes[this.DataTotal(buff_num,4)-(total-i)]=this.m_array_data[i];
              }
            return res;
         //--- Four buffers + color buffer
         case DRAW_COLOR_BARS       :
         case DRAW_COLOR_CANDLES    :
            res=this.CopyArray(buff_num,0,to_copy,this.m_array_data);
            if(res)
              {
               for(int i=0;i<total;i++)
                  this.m_buffers[buff_num].array0[this.DataTotal(buff_num,0)-(total-i)]=this.m_array_data[i];
              }
            res &=this.CopyArray(buff_num,1,to_copy,this.m_array_data);
            if(res)
              {
               for(int i=0;i<total;i++)
                  this.m_buffers[buff_num].array1[this.DataTotal(buff_num,1)-(total-i)]=this.m_array_data[i];
              }
            res &=this.CopyArray(buff_num,2,to_copy,this.m_array_data);
            if(res)
              {
               for(int i=0;i<total;i++)
                  this.m_buffers[buff_num].array2[this.DataTotal(buff_num,2)-(total-i)]=this.m_array_data[i];
              }
            res &=this.CopyArray(buff_num,3,to_copy,this.m_array_data);
            if(res)
              {
               for(int i=0;i<total;i++)
                  this.m_buffers[buff_num].array3[this.DataTotal(buff_num,3)-(total-i)]=this.m_array_data[i];
              }
            res &=this.CopyArray(buff_num,4,to_copy,this.m_array_data);
            if(res)
              {
               for(int i=0;i<total;i++)
                  this.m_buffers[buff_num].color_indexes[this.DataTotal(buff_num,4)-(total-i)]=this.m_array_data[i];
              }
            return res;
         //---DRAW_NONE
         default:
           break;
        }
     }
   else
     {
      switch(this.BufferDrawType(buff_num))
        {
         //--- One buffer
         case DRAW_LINE             :
         case DRAW_HISTOGRAM        :
         case DRAW_ARROW            :
         case DRAW_SECTION          :
            return this.CopyArray(buff_num,0,to_copy,this.m_array_data);
         //--- Two buffers
         case DRAW_HISTOGRAM2       :
         case DRAW_ZIGZAG           :
         case DRAW_FILLING          :
            res  =this.CopyArray(buff_num,0,to_copy,this.m_array_data);
            res &=this.CopyArray(buff_num,1,to_copy,this.m_array_data);
            return res;
         //--- Four buffers
         case DRAW_BARS             :
         case DRAW_CANDLES          :
            res  =this.CopyArray(buff_num,0,to_copy,this.m_array_data);
            res &=this.CopyArray(buff_num,1,to_copy,this.m_array_data);
            res &=this.CopyArray(buff_num,2,to_copy,this.m_array_data);
            res &=this.CopyArray(buff_num,3,to_copy,this.m_array_data);
            return res;
         //--- One buffer + color buffer
         case DRAW_COLOR_LINE       :
         case DRAW_COLOR_HISTOGRAM  :
         case DRAW_COLOR_ARROW      :
         case DRAW_COLOR_SECTION    :
            res  =this.CopyArray(buff_num,0,to_copy,this.m_array_data);
            res &=this.CopyArray(buff_num,4,to_copy,this.m_array_data);
            return res;
         //--- Two buffers + color buffer
         case DRAW_COLOR_HISTOGRAM2 :
         case DRAW_COLOR_ZIGZAG     :
            res  =this.CopyArray(buff_num,0,to_copy,this.m_array_data);
            res &=this.CopyArray(buff_num,1,to_copy,this.m_array_data);
            res &=this.CopyArray(buff_num,4,to_copy,this.m_array_data);
            return res;
         //--- Four buffers + color buffer
         case DRAW_COLOR_BARS       :
         case DRAW_COLOR_CANDLES    :
            res  =this.CopyArray(buff_num,0,to_copy,this.m_array_data);
            res &=this.CopyArray(buff_num,1,to_copy,this.m_array_data);
            res &=this.CopyArray(buff_num,2,to_copy,this.m_array_data);
            res &=this.CopyArray(buff_num,3,to_copy,this.m_array_data);
            res &=this.CopyArray(buff_num,4,to_copy,this.m_array_data);
            return res;
         //---DRAW_NONE
         default:
           break;
        }
     }
   return false;
  }
In der Methode zum Füllen von Objektpuffern mit Daten aus dem Berechnungsteilpuffer im Codeblock, der für die Operation auf dem aktuellen Tick zuständig ist, kopieren wir die in der Variablen m_bars_to_calculate eingestellte Anzahl von Takten anstelle von zwei Balken:
//--- If calculated m_limit is less than or equal to 1, this means either opening of a new bar (m_limit==1) or current tick (m_limit==0)
//--- In this case, it is necessary to calculate the number of bars specified in the m_bars_to_calculate variable - the current one and the rest
   if(this.m_limit<=1)
     {
      //--- In a loop over the number of indicator buffers
      for(int i=0;i<total;i++)
        {
         //--- If this is the opening of a new bar and resizing the indicator buffer failed,
         if(this.m_limit==1 && !this.BufferResize(i,this.m_rates_total))
           {
            //--- add 'false' to the m_success variable and return 'false'
            //--- Here, an error message will be printed to log from the BufferResize method
            this.m_success=false;
            return false;
           }
         //--- If failed to copy bars in the amount of m_bars_to_calculate from the indicator's calculation part buffer,
         ::ResetLastError();
         if(!this.CopyArrays(i,this.m_bars_to_calculate))
           {
            //--- report this via the log, add 'false' to the m_success variable and return 'false'
            ::PrintFormat("%s::%s: CopyBuffer(%lu) failed. Error %lu",__FUNCTION__,this.Title(),i,::GetLastError());
            this.m_success &=false;
           }
        }
      //--- If the loop is followed by errors, return 'false'
      if(!this.m_success)
        {
         this.m_type_err=ERR_TYPE_NO_DATA;
         return false;
        }

      //--- Success
      this.m_type_err=ERR_TYPE_NO_ERROR;
      this.m_success=true;
      return true;
     }
//--- Undefined 'limit' option - return 'false'
   return false;
  }
Die Methode, die das übergebene Array mit Daten aus dem Klassenpuffer füllt, ist nun völlig neu gestaltet. Dabei werden die Nuancen des Kopierens von Daten aus einem niedrigeren Zeitrahmen in einen höheren und von einem höheren in einen niedrigeren sowie die Menge der kopierten Daten des aktuellen Ticks berücksichtigt, die bereits zu Beginn des Artikels erläutert wurden. Die Logik dieser Methode wurde vollständig umgeschrieben und kommentiert:
//+------------------------------------------------------------------+
//| Fills the passed plot array with data from the class buffer      |
//+------------------------------------------------------------------+
bool CIndMSTF::DataToBuffer(const string symbol_to,const ENUM_TIMEFRAMES timeframe_to,const uint buffer_num,const uint array_num,const int limit,double &buffer[])
  {
//--- Set the success flag
   this.m_success=true;
//--- Get the indexing direction of the buffer array passed to the method and,
//--- if non-timeseries indexing, set timeseries indexing
   bool as_series=::ArrayGetAsSeries(buffer);
   if(!as_series)
      ::ArraySetAsSeries(buffer,true);
//--- Set the symbol name and timeframe value passed to the method
   string symbol=(symbol_to=="" || symbol_to==NULL ? ::Symbol() : symbol_to);
   ENUM_TIMEFRAMES timeframe=(timeframe_to==PERIOD_CURRENT ? ::Period() : timeframe_to);

//--- If this is the first launch or history changes, initialize the buffer array passed to the method
   if(limit>1 && this.m_limit>1)
     {
      ::PrintFormat("%s::%s First start, or historical data has been changed. Initialize Buffer(%lu)",__FUNCTION__,this.Title(),buffer_num);
      ::ArrayInitialize(buffer,this.BufferInitValue(buffer_num));
     }

//--- Set the value of the loop counter (no more than the maximum number of bars in the terminal on the chart)
   int count=(limit<=1 ? (int)this.m_bars_to_calculate : ::fmin(::TerminalInfoInteger(TERMINAL_MAXBARS),limit));
//--- In a loop from the zero bar to the value of the loop counter
   for(int i=0;i<count;i++)
     {
      //--- If the chart timeframe matches the class object timeframe, fill the buffer directly from the class object array
      if(timeframe==::Period() && this.m_timeframe==::Period())
         buffer[i]=this.GetData(buffer_num,array_num,i);
      //--- Otherwise, if the chart timeframe is not equal to the timeframe of the class object
      else
        {
         //--- If the chart timeframe is lower than the timeframe of the class object,
         if(timeframe<this.m_timeframe)
           {
            //--- If this is historical data (a bar with an index greater than m_bars_to_calculate-1)
            if(i>(int)this.m_bars_to_calculate-1)
              {
               //--- Find out which time of this class the bar of the current chart timeframe, corresponding to the loop index, belongs to
               ::ResetLastError();
               if(::CopyTime(symbol,timeframe,i,1,this.m_array_time)!=1)
                 {
                  //--- If there is no data in the terminal, move on
                  if(::GetLastError()==4401)
                     continue;
                  //--- Error in obtaining existing data - return false
                  this.m_success &=false;
                  return false;
                 }
               //--- Using time of bar of current chart timeframe, find the corresponding bar index of the chart period in the class object buffer array
               int bar=::iBarShift(this.m_symbol,this.m_timeframe,this.m_array_time[0]);
               if(bar==WRONG_VALUE)
                 {
                  this.m_success &=false;
                  continue;
                 }
               //--- in the indicator buffer at the loop index, write the value obtained from the calculation part buffer
               buffer[i]=this.GetData(buffer_num,array_num,bar);
              }
            //--- If this is the current (zero) bar or a bar with an index less than or equal to m_bars_to_calculate-1
            else
              {
               //--- Get the time of bars by symbol/timeframe of the class object in the amount of m_bars_to_calculate
               if(::CopyTime(this.m_symbol,this.m_timeframe,0,this.m_bars_to_calculate,this.m_array_time)!=this.m_bars_to_calculate)
                 {
                  this.m_success=false;
                  return false;
                 }

               //--- Get the number of bars of the current chart period contained in the chart period of the class object
               int num_bars=::PeriodSeconds(this.m_timeframe)/::PeriodSeconds(timeframe);
               if(num_bars<1)
                  num_bars=1;

               //--- In a loop through the array of received bar times
               for(int j=0;j<(int)this.m_array_time.Size();j++)
                 {
                  //--- Get the corresponding bar on the chart by the time of the bar in the buffer array of the class object
                  int barN=::iBarShift(symbol,timeframe,this.m_array_time[j]);
                  if(barN==WRONG_VALUE)
                    {
                     this.m_success &=false;
                     return false;
                    }
                  //--- Calculate the final bar on the chart to copy data from the buffer of the calculation part of the indicator
                  int end=barN-num_bars;
                  if(end<0)
                     end=-1;
                  //--- In a loop from barN to end, copy data from the buffer array of the calculation part to the indicator buffer being drawn on the chart
                  for(int n=barN;n>end;n--)
                     buffer[n]=this.GetData(buffer_num,array_num,this.m_bars_to_calculate-1-j);
                 }
              }
           }

         //--- If the chart timeframe is higher than the timeframe of the class object,
         else if(timeframe>this.m_timeframe)
           {
            //--- Get the number of bars of the class object chart period contained in the bar of the current chart period
            int num_bars=::PeriodSeconds(timeframe)/::PeriodSeconds(this.m_timeframe);
            //--- Find out which time of this class the bar of the current chart timeframe, corresponding to the loop index, belongs to
            ::ResetLastError();
            if(::CopyTime(symbol,timeframe,i,1,this.m_array_time)!=1)
              {
               //--- If there is no data in the terminal, move on
               if(::GetLastError()==4401)
                  continue;
               //--- Error in obtaining existing data - return false
               this.m_success &=false;
               return false;
              }
            //--- Using time of bar of current chart timeframe, find the corresponding bar index of the chart period in the class object buffer array
            //--- This bar will be the first of several bars of the class object in the amount of num_bars included in the chart bar
            int bar=::iBarShift(this.m_symbol,this.m_timeframe,this.m_array_time[0]);
            if(bar==WRONG_VALUE)
              {
               this.m_success &=false;
               continue;
              }
            //--- Calculate the index of the last bar to copy in the loop
            int end=bar-num_bars;
            if(end<0)
               end=-1;
            //--- In a loop from the first to the last bar included in the bar of the older chart period
            for(int j=bar;j>end;j--)
              {
               //--- Find out which time of this class the bar of the current chart timeframe, corresponding to the loop index, belongs to
               ::ResetLastError();
               if(::CopyTime(this.m_symbol,this.m_timeframe,j,1,this.m_array_time)!=1)
                 {
                  //--- If there is no data in the terminal, move on
                  if(::GetLastError()==4401)
                     continue;
                  //--- Error in obtaining existing data - return false
                  this.m_success &=false;
                  return false;
                 }
               //--- Get the bar number on the chart corresponding to the time of the buffer array of the calculation part by j loop index
               int barN=::iBarShift(symbol,timeframe,this.m_array_time[0]);
               //--- Get the data of the j bar in the buffer array of the calculation part and the data of barN contained in the chart indicator buffer
               double value_data=this.GetData(buffer_num,array_num,j);
               double value_buff=buffer[barN];
               //--- If the bar on the chart has an empty value, then write data from the buffer array of the calculation part into it. Or
               //--- if there is already data on the chart, then we write new data to this bar only if the data contains a non-empty value.
               if(value_buff==this.BufferInitValue(buffer_num) || (value_buff!=this.BufferInitValue(buffer_num) && value_data!=this.BufferInitValue(buffer_num)))
                  buffer[barN]=value_data;
              }
           }
        }
     }
//--- Set initial indexing of the buffer array passed to the method
   ::ArraySetAsSeries(buffer,as_series);
//--- Successful
   return true;
  }
Die Basisobjektklasse des Multi-Symbol-Multi-Perioden-Indikators ist fertig.
Lassen Sie uns nun die abgeleiteten Klassen fertigstellen.
Von allen Standardindikatoren hat nur der Indikator Fractals von Bill Williams eine Zeichnung in Form von Pfeilen mit „Lücken“ (Parabolic SAR wird auch mit Pfeilen gezeichnet, aber immer für jeden Balken auf dem Chart).
Und die Zeichnung des Fractals-Indikators beginnt auf dem Balken mit dem Index 2. Mit anderen Worten: Um den Indikator zu berechnen, müssen wir bei jedem Tick drei Balken aktualisieren: 2, 1 und 0.
Im Konstruktor der Indikatorklasse setzen wir die Anzahl der Berechnungsbalken auf drei:
//+------------------------------------------------------------------+
//| Fractals indicator class                                         |
//+------------------------------------------------------------------+
class CIndFractals : public CIndMSTF
  {
public:
//--- Constructor
   CIndFractals(const string symbol,const ENUM_TIMEFRAMES timeframe) : CIndMSTF(IND_FRACTALS,2,symbol,timeframe)
     {
      // Buffer indexes: 0 - UPPER_LINE, 1 - LOWER_LINE
      //--- Create description of parameters
      //--- If non-current chart symbol or period, their descriptions are added to parameters
      bool current=(this.Symbol()==::Symbol() && this.Timeframe()==::Period());
      string symbol_period=(current ? "" : ::StringFormat("%s,%s",this.Symbol(),this.TimeframeDescription()));
      string param=(current ? "" : StringFormat("(%s)",symbol_period));
      //--- Write description of parameters, indicator name, its description, title and category
      this.SetParameters(param);
      this.SetName("Fractals");
      this.SetDescription("Fractals");
      this.m_title=this.Name()+this.Parameters();
      this.m_category=IND_CATEGORY_WILLIAMS;
      //--- Description of UPPER_LINE and LOWER_LINE line buffers
      this.SetBufferDescription(UPPER_LINE,this.m_title+" Up");
      this.SetBufferDescription(LOWER_LINE,this.m_title+" Down");

      //--- Set drawing style for buffers 0 and 1 and the numbers of calculation part data buffers
      this.SetBufferDrawType(0,DRAW_ARROW,UPPER_LINE);
      this.SetBufferDrawType(1,DRAW_ARROW,LOWER_LINE);

      //--- Set default colors for buffers 0 and 1
      this.SetBufferColorToIndex(UPPER_LINE,0,clrGray);
      this.SetBufferColorToIndex(LOWER_LINE,0,clrGray);

      //--- Set the number of bars required to calculate the indicator on the current tick
      this.SetBarsToCalculate(3);
     }
  };
In der Basisklasse ist dieser Betrag standardmäßig auf zwei Balken festgelegt. Hier wird die Menge auf drei Balken umdefiniert und dementsprechend werden auch die Dimensionen der temporären Arrays auf drei erhöht.
In der nutzerdefinierten Indikatorklasse ist nicht im Voraus bekannt, wie viele Balken zur Berechnung des aktuellen Ticks erforderlich sind. Dies bedeutet, dass wir die erforderliche Anzahl von Balken nicht im Voraus festlegen können, wie dies im Konstruktor der Fraktalindikatorenklasse geschehen ist. Hier müssen wir diese Zahl in den Parametern des Klassenkonstruktors setzen, der sie über die Eingabe übergibt und setzt:
//+------------------------------------------------------------------+ //| Custom indicator class | //+------------------------------------------------------------------+ class CIndCustom : public CIndMSTF { public: //--- Constructor CIndCustom(const string symbol,const ENUM_TIMEFRAMES timeframe, const string path, // path to the indicator (for example, "Examples\\MACD.ex5") const string name, // name of the custom indicator const uint buffers, // number of indicator buffers const uint bars_to_calculate, // number of bars required to calculate the indicator on the current tick const MqlParam ¶m[] // array of custom indicator parameters ) : CIndMSTF(IND_CUSTOM,buffers,symbol,timeframe) { //--- If an empty array of parameters is passed, print this to log int total=(int)param.Size(); if(total==0) ::PrintFormat("%s Error. Passed an empty array",__FUNCTION__); //--- If the array is not empty and its size is increased by 1 (the first string parameter must contain the indicator name) ResetLastError(); if(total>0 && ::ArrayResize(this.m_param,total+1)==total+1) { //--- Reset data in the array and enter name (path to file and name of .ex5 file) ::ZeroMemory(this.m_param); //--- name of the custom indicator this.m_param[0].type=TYPE_STRING; this.m_param[0].string_value=path; //--- fill the array of indicator parameters for(int i=0;i<total;i++) { this.m_param[i+1].type=param[i].type; this.m_param[i+1].double_value=param[i].double_value; this.m_param[i+1].integer_value=param[i].integer_value; this.m_param[i+1].string_value=param[i].string_value; } //--- Create description of parameters //--- If non-current chart symbol or period, their descriptions are added to parameters bool current=(this.Symbol()==::Symbol() && this.Timeframe()==::Period()); string symbol_period=(current ? "" : ::StringFormat("%s,%s",this.Symbol(),this.TimeframeDescription())); string param=(current ? "" : StringFormat("(%s)",symbol_period)); //--- Write description of parameters, indicator name, its description, title and category this.SetParameters(param); this.SetName(name); this.SetDescription(name); this.m_title=this.Name()+this.Parameters(); this.m_category=IND_CATEGORY_CUSTOM; //--- Write a description of the first line buffer this.SetBufferDescription(0,this.m_title); //--- Set the number of bars required to calculate the indicator on the current tick this.SetBarsToCalculate(bars_to_calculate); } } };
In der Methode zur Erstellung eines neuen nutzerdefinierten Indikatorobjekts müssen wir auch die Anzahl der Balken angeben, die für die Berechnung des Indikators in der Indikatorensammlungsklasse benötigt werden:
int AddNewVolumes(const string symbol,const ENUM_TIMEFRAMES timeframe,const ENUM_APPLIED_VOLUME applied_volume=VOLUME_TICK); int AddNewCustom(const string symbol,const ENUM_TIMEFRAMES timeframe,const string path, // path to the indicator (for example, "Examples\\MACD.ex5") const string name, // name of custom indicator (for example, "Custom MACD") const uint buffers, // number of buffers const uint bars_to_calculate,// number of bars required to calculate the indicator on the current tick const MqlParam ¶m[]); // Array of parameters //--- Timer
während wir im Code der Methodenimplementierung den Wert dieser Variablen an den Konstruktor der nutzerdefinierten Indikatorklasse übergeben müssen:
//+------------------------------------------------------------------+ //| Add a custom indicator to the collection | //+------------------------------------------------------------------+ int CMSTFIndicators::AddNewCustom(const string symbol,const ENUM_TIMEFRAMES timeframe,const string path,const string name,const uint buffers,const uint bars_to_calculate,const MqlParam ¶m[]) { //--- Create a new indicator object. If there is an error, add a journal message and return INVALID_HANDLE CIndCustom *ind_obj=new CIndCustom(symbol,timeframe,path,name,buffers,bars_to_calculate,param); if(ind_obj==NULL) { ::PrintFormat("%s: Error. Failed to create %s custom indicator object",__FUNCTION__,name); return INVALID_HANDLE; } //--- Return the result of adding the created indicator object to the collection list return this.AddNewIndicator(ind_obj,__FUNCTION__); }
Jetzt sollten die Klassen der Multi-Symbol-Multi-Perioden-Indikatoren mit den Pfeil-Indikatoren und den Indikatoren, die Daten mit Lücken im Puffer enthalten, funktionieren - Indikatoren der Zeichenstile DRAW_ARROW, DRAW_COLOR_ARROW, DRAW_SECTION, DRAW_ZIGZAG, DRAW_COLOR_SECTION und DRAW_COLOR_ZIGZAG.
Test
Um den Test durchzuführen, kann ich jeden beliebigen Indikator aus den zuvor erstellten Indikatoren verwenden, z. B. Parabolis SAR, da er auch Pfeile anzeigt. Er hat einen gezeichneten Puffer, während der fraktale Indikator zwei hat. Ein Puffer wird zum Zeichnen der oberen Fraktale verwendet, der zweite zum Zeichnen der unteren Fraktale. Ändern wir den Code des Indikators so, dass er Pfeile in zwei Puffern zeichnet, und speichern wir ihn unter dem Namen TestMSTFFractals.mq5.
Der Indikator zeigt Daten von zwei Fraktal-Indikatoren gleichzeitig auf dem Chart an - einer zeichnet Fraktale aus der aktuellen Chart-Periode und der zweite zeichnet Fraktale aus dem Fraktal-Indikator, der auf dem Symbol und der Chart-Periode berechnet wurde, die in den Einstellungen angegeben sind. Zur Anzeige von Daten aus fraktalen Indikatoren werden wir das Datenpanel in allen Indikatoren in den Artikeln dieser Reihe verwenden:
//+------------------------------------------------------------------+
//|                                             TestMSTFFractals.mq5 |
//|                                  Copyright 2023, MetaQuotes Ltd. |
//|                                             https://www.mql5.com |
//+------------------------------------------------------------------+
#property copyright "Copyright 2023, MetaQuotes Ltd."
#property link      "https://www.mql5.com"
#property version   "1.00"
#property indicator_chart_window
#property indicator_buffers 4
#property indicator_plots   4
//--- enums

//--- plot FractalsUp1
#property indicator_label1  "FractalsUp1"
#property indicator_type1   DRAW_ARROW
#property indicator_color1  clrGray
#property indicator_width1  1

//--- plot FractalsDown1
#property indicator_label2  "FractalsDown1"
#property indicator_type2   DRAW_ARROW
#property indicator_color2  clrGray
#property indicator_width2  1

//--- plot FractalsUp2
#property indicator_label3  "FractalsUp2"
#property indicator_type3   DRAW_ARROW
#property indicator_color3  clrDodgerBlue
#property indicator_width3  1

//--- plot FractalsDown2
#property indicator_label4  "FractalsDown2"
#property indicator_type4   DRAW_ARROW
#property indicator_color4  clrDodgerBlue
#property indicator_width4  1

//--- includes
#include <IndMSTF\IndMSTF.mqh>
#include <Dashboard\Dashboard.mqh>
//--- input parameters
input string               InpSymbol      =  NULL;             /* Symbol                     */ // Moving average symbol
input ENUM_TIMEFRAMES      InpTimeframe   =  PERIOD_CURRENT;   /* Timeframe                  */ // Moving average timeframe
input uchar                InpArrowShift1 =  10;               /* Senior period Arrow VShift */ // Shift the arrows vertically for the higher period
input uchar                InpArrowShift2 =  10;               /* Junior period Arrow VShift */ // Shift the arrows vertically for the lower period
input bool                 InpAsSeries    =  true;             /* As Series flag             */ // Timeseries flag of indicator buffer arrays

//--- indicator buffers
double         BufferFractalsUp1[];
double         BufferFractalsDn1[];
double         BufferFractalsUp2[];
double         BufferFractalsDn2[];
//--- global variables
int handle_fractals1;
int handle_fractals2;
CMSTFIndicators indicators;      // An instance of the indicator collection object
//--- variables for the panel
CDashboard *panel=NULL;          // Pointer to the panel object
int         mouse_bar_index;     // Index of the bar the data is taken from
//+------------------------------------------------------------------+
//| Custom indicator initialization function                         |
//+------------------------------------------------------------------+
int OnInit()
  {
//--- Set a timer with an interval of 1 second
   EventSetTimer(1);
//--- Assign the BufferFractalsUp1 and BufferFractalsDn1 arrays to the plot buffers 0 and 1, respectively
   SetIndexBuffer(0,BufferFractalsUp1,INDICATOR_DATA);
   SetIndexBuffer(1,BufferFractalsDn1,INDICATOR_DATA);
//--- Assign the BufferFractalsUp2 and BufferFractalsDn2 arrays to the plot buffers 2 and 3, respectively
   SetIndexBuffer(2,BufferFractalsUp2,INDICATOR_DATA);
   SetIndexBuffer(3,BufferFractalsDn2,INDICATOR_DATA);
//--- Define the symbol code from the Wingdings font to draw in PLOT_ARROW
   PlotIndexSetInteger(0,PLOT_ARROW,217);
   PlotIndexSetInteger(1,PLOT_ARROW,218);
   PlotIndexSetInteger(2,PLOT_ARROW,217);
   PlotIndexSetInteger(3,PLOT_ARROW,218);
//--- Set the vertical shift of the arrows
   PlotIndexSetInteger(0,PLOT_ARROW_SHIFT,-InpArrowShift1);
   PlotIndexSetInteger(1,PLOT_ARROW_SHIFT, InpArrowShift1);
   PlotIndexSetInteger(2,PLOT_ARROW_SHIFT,-InpArrowShift2);
   PlotIndexSetInteger(3,PLOT_ARROW_SHIFT, InpArrowShift2);
//--- Set the timeseries flags for the indicator buffer arrays (for testing, to see that there is no difference)
   ArraySetAsSeries(BufferFractalsUp1,InpAsSeries);
   ArraySetAsSeries(BufferFractalsDn1,InpAsSeries);
   ArraySetAsSeries(BufferFractalsUp2,InpAsSeries);
   ArraySetAsSeries(BufferFractalsDn2,InpAsSeries);

//--- Create two indicators of the same type
//--- The first one is calculated on the current chart symbol/period, the second - on those specified in the settings
   handle_fractals1=indicators.AddNewFractals(NULL,PERIOD_CURRENT);
   handle_fractals2=indicators.AddNewFractals(InpSymbol,InpTimeframe);

//--- If failed to create indicator handles, return initialization error
   if(handle_fractals1==INVALID_HANDLE || handle_fractals2==INVALID_HANDLE)
      return INIT_FAILED;
//--- Set descriptions for indicator lines from buffer descriptions of calculation part of created indicators
   indicators.SetPlotLabelFromBuffer(0,handle_fractals1,0);
   indicators.SetPlotLabelFromBuffer(1,handle_fractals1,1);
   indicators.SetPlotLabelFromBuffer(2,handle_fractals2,0);
   indicators.SetPlotLabelFromBuffer(3,handle_fractals2,1);

//--- Dashboard
//--- Create the panel
   int width=311;
   panel=new CDashboard(1,20,20,width,264);
   if(panel==NULL)
     {
      Print("Error. Failed to create panel object");
      return INIT_FAILED;
     }
//--- Set font parameters
   panel.SetFontParams("Calibri",9);
//--- Display the panel with the "Symbol, Timeframe description" header text
   panel.View(Symbol()+", "+StringSubstr(EnumToString(Period()),7));

//--- Create a table with ID 0 to display bar data in it
   panel.CreateNewTable(0);
//--- Draw a table with ID 0 on the panel background
   panel.DrawGrid(0,2,20,6,2,18,width/2-2);

//--- Create a table with ID 1 to display the data of indicator 1
   panel.CreateNewTable(1);
//--- Get the Y2 table coordinate with ID 0 and
//--- set the Y1 coordinate for the table with ID 1
   int y1=panel.TableY2(0)+22;
//--- Draw a table with ID 1 on the panel background
   panel.DrawGrid(1,2,y1,2,2,18,width/2-2);

//--- Create a table with ID 2 to display the data of indicator 2
   panel.CreateNewTable(2);
//--- Get the Y2 coordinate of the table with ID 1 and
//--- set the Y1 coordinate for the table with ID 2
   int y2=panel.TableY2(1)+3;
//--- Draw a table with ID 2 on the background of the dashboard
   panel.DrawGrid(2,2,y2,3,2,18,width/2-2);

//--- Initialize the variable with the index of the mouse cursor bar
   mouse_bar_index=0;
//--- Display the data of the current bar on the panel
   DrawData(mouse_bar_index,TimeCurrent());

//--- Successful initialization
   return(INIT_SUCCEEDED);
  }
//+------------------------------------------------------------------+
//| Custom indicator deinitialization function                       |
//+------------------------------------------------------------------+
void OnDeinit(const int reason)
  {
//--- Delete the timer
   EventKillTimer();
//--- If the panel object exists, delete it
   if(panel!=NULL)
      delete panel;
//--- Delete all comments
   Comment("");
  }
//+------------------------------------------------------------------+
//| Custom indicator iteration function                              |
//+------------------------------------------------------------------+
int OnCalculate(const int rates_total,
                const int prev_calculated,
                const datetime &time[],
                const double &open[],
                const double &high[],
                const double &low[],
                const double &close[],
                const long &tick_volume[],
                const long &volume[],
                const int &spread[])
  {
//--- Number of bars for calculation
   int limit=rates_total-prev_calculated;
//--- If limit > 1, then this is the first calculation or change in the history
   if(limit>1)
     {
      //--- specify all the available history for calculation
      limit=rates_total-1;
      /*
      // If the indicator has any buffers that display other calculations (not multi-indicators),
      // initialize them here with the "empty" value set for these buffers
      */
     }
//--- Calculate all created multi-symbol multi-period indicators
   if(!indicators.Calculate())
      return 0;

//--- Display the bar data under cursor (or current bar if cursor is outside the chart) on the dashboard
   DrawData(mouse_bar_index,time[mouse_bar_index]);

//--- From buffers of calculated indicators, output data to indicator buffers
   if(!indicators.DataToBuffer(NULL,PERIOD_CURRENT,handle_fractals1,0,0,limit,BufferFractalsUp1))
      return 0;
   if(!indicators.DataToBuffer(NULL,PERIOD_CURRENT,handle_fractals1,1,0,limit,BufferFractalsDn1))
      return 0;
   if(!indicators.DataToBuffer(NULL,PERIOD_CURRENT,handle_fractals2,0,0,limit,BufferFractalsUp2))
      return 0;
   if(!indicators.DataToBuffer(NULL,PERIOD_CURRENT,handle_fractals2,1,0,limit,BufferFractalsDn2))
      return 0;

//--- return value of prev_calculated for the next call
   return(rates_total);
  }
//+------------------------------------------------------------------+
//| Timer function                                                   |
//+------------------------------------------------------------------+
void OnTimer()
  {
//--- Call the indicator collection timer
   indicators.OnTimer();
  }
//+------------------------------------------------------------------+
//| ChartEvent function                                              |
//+------------------------------------------------------------------+
void OnChartEvent(const int id,
                  const long &lparam,
                  const double &dparam,
                  const string &sparam)
  {
//--- Handling the panel
//--- Call the panel event handler
   panel.OnChartEvent(id,lparam,dparam,sparam);

//--- If the cursor moves or a click is made on the chart
   if(id==CHARTEVENT_MOUSE_MOVE || id==CHARTEVENT_CLICK)
     {
      //--- Declare the variables to record time and price coordinates in them
      datetime time=0;
      double price=0;
      int wnd=0;
      //--- If the cursor coordinates are converted to date and time
      if(ChartXYToTimePrice(ChartID(),(int)lparam,(int)dparam,wnd,time,price))
        {
         //--- write the bar index where the cursor is located to a global variable
         mouse_bar_index=iBarShift(Symbol(),PERIOD_CURRENT,time);
         //--- Display the bar data under the cursor on the panel
         DrawData(mouse_bar_index,time);
        }
     }

//--- If we received a custom event, display the appropriate message in the journal
   if(id>CHARTEVENT_CUSTOM)
     {
      //--- Here we can implement handling a click on the close button on the panel
      PrintFormat("%s: Event id=%ld, object id (lparam): %lu, event message (sparam): %s",__FUNCTION__,id,lparam,sparam);
     }
  }
//+------------------------------------------------------------------+
//| Display data from the specified timeseries index to the panel    |
//+------------------------------------------------------------------+
void DrawData(const int index,const datetime time)
  {
//--- Declare the variables to receive data in them
   MqlRates rates[1];

//--- Exit if unable to get the bar data by the specified index
   if(CopyRates(Symbol(),PERIOD_CURRENT,index,1,rates)!=1)
      return;

//--- Set font parameters for bar and indicator data headers
   int  size=0;
   uint flags=0;
   uint angle=0;
   string name=panel.FontParams(size,flags,angle);
   panel.SetFontParams(name,9,FW_BOLD);
   panel.DrawText("Bar data ["+(string)index+"]",3,panel.TableY1(0)-16,clrMaroon,panel.Width()-6);
   panel.DrawText("Indicators data ["+(string)index+"]",3,panel.TableY1(1)-16,clrGreen,panel.Width()-6);
//--- Set font parameters for bar and indicator data
   panel.SetFontParams(name,9);

//--- Display the data of the specified bar in table 0 on the panel
   panel.DrawText("Date",  panel.CellX(0,0,0)+2, panel.CellY(0,0,0)+2); panel.DrawText(TimeToString(  rates[0].time,TIME_DATE),     panel.CellX(0,0,1)+2, panel.CellY(0,0,1)+2,clrNONE,90);
   panel.DrawText("Time",  panel.CellX(0,1,0)+2, panel.CellY(0,1,0)+2); panel.DrawText(TimeToString(  rates[0].time,TIME_MINUTES),  panel.CellX(0,1,1)+2, panel.CellY(0,1,1)+2,clrNONE,90);
   panel.DrawText("Open",  panel.CellX(0,2,0)+2, panel.CellY(0,2,0)+2); panel.DrawText(DoubleToString(rates[0].open,Digits()),      panel.CellX(0,2,1)+2, panel.CellY(0,2,1)+2,clrNONE,90);
   panel.DrawText("High",  panel.CellX(0,3,0)+2, panel.CellY(0,3,0)+2); panel.DrawText(DoubleToString(rates[0].high,Digits()),      panel.CellX(0,3,1)+2, panel.CellY(0,3,1)+2,clrNONE,90);
   panel.DrawText("Low",   panel.CellX(0,4,0)+2, panel.CellY(0,4,0)+2); panel.DrawText(DoubleToString(rates[0].low,Digits()),       panel.CellX(0,4,1)+2, panel.CellY(0,4,1)+2,clrNONE,90);
   panel.DrawText("Close", panel.CellX(0,5,0)+2, panel.CellY(0,5,0)+2); panel.DrawText(DoubleToString(rates[0].close,Digits()),     panel.CellX(0,5,1)+2, panel.CellY(0,5,1)+2,clrNONE,90);

//--- Output the data of buffer 0 of indicator 1 from the specified bar into table 1
   panel.DrawText(indicators.Title(handle_fractals1)+" Up", panel.CellX(1,0,0)+2, panel.CellY(1,0,0)+2);
   double value10=indicators.GetData(handle_fractals1,0,0,index);
   string value_str10=(value10!=EMPTY_VALUE ? DoubleToString(value10,indicators.Digits(handle_fractals1)) : " ");
   panel.DrawText(value_str10,panel.CellX(1,0,1)+2,panel.CellY(1,0,1)+2,clrNONE,110);

//--- Output the data of buffer 1 of indicator 1 from the specified bar into table 1
   panel.DrawText(indicators.Title(handle_fractals1)+" Down", panel.CellX(1,1,0)+2, panel.CellY(1,1,0)+2);
   double value11=indicators.GetData(handle_fractals1,1,0,index);
   string value_str11=(value11!=EMPTY_VALUE ? DoubleToString(value11,indicators.Digits(handle_fractals1)) : " ");
   panel.DrawText(value_str11,panel.CellX(1,1,1)+2,panel.CellY(1,1,1)+2,clrNONE,110);

//--- Output the data of buffer 0 of indicator 2 from the specified bar into table 2
   panel.DrawText(indicators.Title(handle_fractals2)+" Up", panel.CellX(2,0,0)+2, panel.CellY(2,0,0)+2);
   double value20=indicators.GetDataTo(Symbol(),PERIOD_CURRENT,handle_fractals2,0,0,index);
   string value_str20=(value20!=EMPTY_VALUE ? DoubleToString(value20,indicators.Digits(handle_fractals2)) : " ");
   panel.DrawText(value_str20,panel.CellX(2,0,1)+2,panel.CellY(2,0,1)+2,clrNONE,110);

//--- Output the data of buffer 1 of indicator 2 from the specified bar into table 2
   panel.DrawText(indicators.Title(handle_fractals2)+" Down", panel.CellX(2,1,0)+2, panel.CellY(2,1,0)+2);
   double value21=indicators.GetDataTo(Symbol(),PERIOD_CURRENT,handle_fractals2,1,0,index);
   string value_str21=(value21!=EMPTY_VALUE ? DoubleToString(value21,indicators.Digits(handle_fractals2)) : " ");
   panel.DrawText(value_str21,panel.CellX(2,1,1)+2,panel.CellY(2,1,1)+2,clrNONE,110);

//--- Redraw the chart to immediately display all changes on the panel
   ChartRedraw(ChartID());
  }
//+------------------------------------------------------------------+
Kompilieren Sie den Indikator und starten Sie ihn auf dem M1-Chart, wechseln Sie dann die Chart-Periode auf M5 und M15:
Wir sehen, wie die Indikatorpuffer auf dem M1-Chart mit Daten aus dem Indikator für M5 gefüllt werden.
Gleichzeitig sehen wir beim Wechsel zu M15, wie alle Fraktale des Indikators, der für M5 entwickelt wurde, auf M15-Balken gezeichnet werden. Gleichzeitig sollten sie nicht auf jedem Balken des M15-Charts zu sehen sein. Dies ist jedoch nicht der Fall. In jedem Balken des M15-Charts befinden sich drei Balken des M5-Charts, die die Fraktale enthalten. Diese Fraktale werden auf den Balken des M15-Charts angezeigt, denn dafür wurde der Indikator entwickelt - als Multi-Symbol-Multi-Perioden-Indikator.
Schlussfolgerung
In diesem Artikel haben wir die Funktionsweise von Klassen von Multi-Symbol-Multi-Perioden-Indikatoren mit dem Zeichenstil DRAW_ARROW erstellt und getestet. In den folgenden Artikeln werden wir uns auf die übrigen Zeichenstile konzentrieren, die Datenumbrüche im Chart beinhalten. Außerdem werden wir die verbleibenden Standardindikatoren vervollständigen, die noch nicht berücksichtigt wurden, um das Thema der Multi-Symbol-Multi-Perioden-Indikatoren abzuschließen.
Alle im Artikel verwendeten Dateien (die Multi-Indikator-Klassen, die Panel-Klasse und die Indikator-Datei) sind dem Artikel beigefügt und können unabhängig getestet und verwendet werden.
Übersetzt aus dem Russischen von MetaQuotes Ltd.
Originalartikel: https://www.mql5.com/ru/articles/14105
- Freie Handelsapplikationen
- Über 8.000 Signale zum Kopieren
- Wirtschaftsnachrichten für die Lage an den Finanzmärkte
Sie stimmen der Website-Richtlinie und den Nutzungsbedingungen zu.