适用于MetaTrader 4的付费技术指标 - 99

In Forex trading, understanding support and resistance is crucial. Virtually every trading strategy incorporates these levels.
MetaTrader lacks built-in support and resistance calculation features, but there's a solution— the Support and Resistance Lines indicator.
This powerful MetaTrader indicator automatically calculates and displays support and resistance levels for any chosen currency pair or trading instrument.
Benefits of the Support and Resistance Lines indicator:
1. Identify better
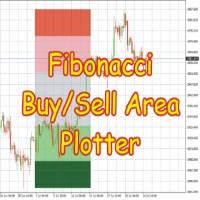
This Indicator is based on Fibonacci levels and draws Buy & Sell Areas. Buy areas are defined in green color (light green & dark green) while Sell areas are defined in red color (light red pink and darker color) Rectangles to easily know that whether price is in buy area or sell area. If price is in gray area, wait for price to come in to your desired area. You can use on any Forex Pairs.
This indicator calculates on the basis of h4 timeframe no matter what time frame you have selected, its calc

All Symbols AND All Time frames Scan
Document Introduction
The ABCD is a basic harmonic pattern. The ABCD pattern is a visual, geometric chart pattern comprised of three consecutive price swings. It looks like a diagonal lightning bolt and can indicate an upcoming trading opportu
使用该工具快速分析市场结构,并利用重要的价格水平。
市场结构
该自定义指标绘制重要价位,可用作进场点或盈利目标。
确定交易范围
利用该指标,根据市场转折点进行剥头皮。
突破交易机会
使用该指标发现突破机会。这种交易策略具有极佳的风险回报比。
自定义警报
当价格突破特定交易区间时,您可以在手机上收到通知或电子邮件。如果您觉得需要根据自己的交易策略定制这些警报,请随时给我发信息。
智能资金概念
该指标是与自营交易商合作开发的,以遵循他们的智能资金理念。
设计简单
我们没有在图表上绘制所有可能的区域,而是决定只绘制我们认为需要关注的主要水平。因此,该指标非常简单,也是初学者的好工具
开放式支持
我们愿意根据您的交易需求定制该指标。如果您有任何建议或需求,请随时给我发消息。
输入: 警报: 信号形成时发送警报--启用后,每次指标形成新的支撑/阻力区时都会收到警报。
突破时发送警报 - 启用后,每当蜡烛收盘突破支撑/阻力区时,都会收到警报。
允许每个信号发出多个警报--发生突破警报时,如果打开此设置,当价格收盘回到突破区域上方时,警报将被重置。允许每个

Multicurrency indicator in table format. Signals appear with confirmation, do not redraw. The indicator works on the current (open) timeframe. Notifications come for an open instrument. The strategy includes: price touching the moving average in the direction of the trend, as well as an extraordinary recalculation of the classic ADX indicator to determine the trend as an additional filtering of entries. Entries are displayed on the chart as arrows and, as mentioned above, the arrows are not redr

The indicator shows the Buy/Sell direction. The calculations use the opening prices and their rate of change for the billing period - "Calculation period" MTF indicator - "Calculation timeframe", no repaint - NRP. Two display types: "Chart default" или "Chart color" For "Chart color" color customization available : "Bar color" Two types stop levels: "Simple stop level" or "Dynamic stop level " Color settings: "Stop level color" Alerts available: "Chart message", "Push message", "Email message" F

配备胜率计算系统的指标 【指标特点】 该指标可以让您直观、轻松地通过信号信号确认常规技术分析。 此外,它可以检查当前参数的胜率,并包括自动胜率确定系统,避免在胜率较低时发出信号。 这减少了不必要的入场,并允许您仅在胜率较高时进行交易。
[重要笔记] ・没有重新涂装。 它可以在 1 分钟到每周的时间范围内使用。 ・没有货币限制。 它可以与所有货币对一起使用。 ・可以计算胜率。 ・仅当达到或超过预定义的胜率时才会生成信号。 ・实现轻负载! 适合长期使用和9种货币对同时使用。 ・由于它是众所周知的指标,因此您可以在观察信号的同时进行学习。 ・调试已完成(由调试器验证是否存在任何问题)。
【MACD箭头信号解释】 MACD(移动平均趋同分歧)箭头信号指标对于交易者来说是非常有用的工具。 它衡量市场动力和趋势强度,从而能够识别进入点和退出点。
[特征] 通过观察移动平均线(短期 EMA 和长期 EMA)的交叉,它表明市场方向的变化并指示进入点。 直方图代表市场动量,使您可以评估趋势市场的强度。 箭头信号直观地提供了进入点和退出点。
[优点] ・对市场转折点敏感并确认强劲趋势。 ・初

配备胜率计算系统的指标 【指标特点】 该指标可以通过信号信号直观、轻松地确认常规技术分析。 此外,它可以通过验证胜率来检查当前参数的适当性,并包括自动胜率确定系统,当胜率较低时不会生成信号。 这减少了不必要的入场,并仅在高胜率期间进行交易。
[重要笔记] ・不重新涂漆。 它可以在 1 分钟到每周的时间范围内使用。 ・没有货币限制。 它可以与所有货币对一起使用。 ・可以计算胜率。 ・仅当达到或超过预定义的胜率时才会生成信号。 ・减轻负载的设计! 适合长期使用和9种货币对同时使用。 ・由于它是众所周知的指标,因此您可以在观察信号的同时进行学习。 ・调试已完成(由调试器验证是否存在任何问题)。
【布林线箭头信号说明】 布林线箭头信号指标对于交易者来说是一个非常有用的工具。 它衡量市场波动性并帮助确定进入和退出点。
[功能] 使用布林线来指示市场波动性。 通过箭头信号直观地提供进入和退出点。
[优点] ・轻松捕捉市场波动(价格波动)。 ・易于识别趋势市场和区间市场之间的转变。
[注意事项] ・在极度波动的市场条件下难以应对。 ・带宽过大时请注意。
通过使用这个简单且高度可靠的

配备胜率计算系统的指标 【指标特点】 该指标可以通过信号信号直观、轻松地确认常规技术分析。 此外,它可以通过验证胜率来检查当前参数的适当性,并包括自动胜率确定系统,当胜率较低时不会生成信号。 这减少了不必要的入场,并仅在高胜率期间进行交易。
[重要笔记] ・不重新涂漆。 它可以在 1 分钟到每周的时间范围内使用。 ・没有货币限制。 它可以与所有货币对一起使用。 ・可以计算胜率。 ・仅当达到或超过预定义的胜率时才会生成信号。 ・减轻负载的设计! 适合长期使用和9种货币对同时使用。 ・由于它是众所周知的指标,因此您可以在观察信号的同时进行学习。 ・调试已完成(由调试器验证是否存在任何问题)。
[一目均衡表箭头信号的说明] Ichimoku 箭头信号指标对于交易者来说是一个非常有用的工具。 它衡量市场趋势状况和强度,帮助识别进入和退出点。
【指标】 组合五个指标:Tenkan-sen、Kijun-sen、Chikou Span、Senkou Span A 和 Senkou Span B。 这可以衡量市场趋势条件和强度,提供对切入点的见解。
[优点] ・突破Leading Spa

配备胜率计算系统的指标 【指标特点】 该指标可以通过信号信号直观、轻松地确认常规技术分析。 此外,它可以通过验证胜率来检查当前参数的适当性,并包括自动胜率确定系统,当胜率较低时不会生成信号。 这减少了不必要的入场,并仅在高胜率期间进行交易。
[重要笔记] ・不重新涂漆。 它可以在 1 分钟到每周的时间范围内使用。 ・没有货币限制。 它可以与所有货币对一起使用。 ・可以计算胜率。 ・仅当达到或超过预定义的胜率时才会生成信号。 ・减轻负载的设计! 适合长期使用和9种货币对同时使用。 ・由于它是众所周知的指标,因此您可以在观察信号的同时进行学习。 ・调试已完成(由调试器验证是否存在任何问题)。
【抛物线指标说明】 抛物线指标是一种显示趋势方向和潜在反转点的技术工具。 它可视化价格上涨和下跌的趋势,表明潜在的趋势逆转。 当价格与抛物线点相交时,表明潜在的反转点。
抛物线箭头信号指标提供基于抛物线指标指示趋势反转的箭头信号。 交易者可以使用该指标根据箭头信号确定入场点。
特征: ・将趋势的方向可视化。 ・预测趋势反转点。 ・使用方便,可靠性高。
通过使用抛物线指标,交易者可以掌握

配备胜率计算系统的指标 【指标特点】 该指标可以通过信号信号直观、轻松地确认常规技术分析。 此外,它可以通过验证胜率来检查当前参数的适当性,并包括自动胜率确定系统,当胜率较低时不会生成信号。 这减少了不必要的入场,并仅在高胜率期间进行交易。
[重要笔记] ・不重新涂漆。 它可以在 1 分钟到每周的时间范围内使用。 ・没有货币限制。 它可以与所有货币对一起使用。 ・可以计算胜率。 ・仅当达到或超过预定义的胜率时才会生成信号。 ・减轻负载的设计! 适合长期使用和9种货币对同时使用。 ・由于它是众所周知的指标,因此您可以在观察信号的同时进行学习。 ・调试已完成(由调试器验证是否存在任何问题)。
【随机指标解释】 随机指标是显示市场趋势反转点的技术指标。 它确定价格是否超买或超卖并预测趋势反转。 它以 0 到 100 的范围表示,读数高于 80 被视为超买,读数低于 20 被视为超卖。
随机指标箭头信号指标提供基于随机指标指示趋势反转的箭头信号。 交易者可以使用该指标根据箭头信号确定入场点。
特征: ・可视化超买和超卖的市场状况。 ・预测趋势反转点。 ・使用方便,可靠性高。
通

配备胜率计算系统的指标 【指标特点】 该指标可以通过信号信号直观、轻松地确认常规技术分析。 此外,它可以通过验证胜率来检查当前参数的适当性,并包括自动胜率确定系统,当胜率较低时不会生成信号。 这减少了不必要的入场,并仅在高胜率期间进行交易。
[重要笔记] ・不重新涂漆。 它可以在 1 分钟到每周的时间范围内使用。 ・没有货币限制。 它可以与所有货币对一起使用。 ・可以计算胜率。 ・仅当达到或超过预定义的胜率时才会生成信号。 ・减轻负载的设计! 适合长期使用和9种货币对同时使用。 ・由于它是众所周知的指标,因此您可以在观察信号的同时进行学习。 ・调试已完成(由调试器验证是否存在任何问题)。
【RSI(相对强弱指数)箭头信号说明】 RSI 是一项技术指标,指示超买和超卖市场状况并衡量趋势市场的强度。 箭头信号指标提供趋势市场变化的警告信号,并帮助确定入场点。 它是一种易于使用、可靠性高的工具,甚至适合初学者。
[优点] ・建议趋势反转点并确定超买和超卖条件。 ・遵循箭头信号寻找与市场趋势一致的切入点。
[警告] ・区间市场中的有效震荡指标。 ・在趋势市场中可能效果不佳。
【

带有胜率计算系统的指标 【指标特点】 该指标可以通过信号信号直观、清晰地确认常规技术分析。 此外,它可以通过检查胜率来验证当前参数的适当性,并且它包括一个自动胜率确定系统,当胜率较低时不会生成信号。 这减少了不必要的输入,并且仅在高获胜率期间允许输入。
【重要说明】 ・不可重新涂漆。 可用于从 1 分钟到每周的时间范围。 ・无货币限制。 可与所有货币对一起使用。 ・可以计算胜率。 ・仅当达到预定胜率或更高时才会生成信号。 ・采取减轻负荷措施的设计! 适合长期使用和9种货币对同时使用。 ・作为众所周知的指标,可以一边观察信号一边进行学习。 ・由调试器进行调试和验证以解决任何问题。
【CCI(商品通道指数)箭头信号说明】 CCI是衡量市场趋势强度并检测市场波动性的技术指标。 CCI 代表超买状况的正值和超卖状况的负值。
[优点] ・建议潜在的趋势反转点。 ・根据箭头信号确定进入点。
[特征] ・与其他振荡型指标不同,它不会粘在天花板或底部。 ・以响应速度快而闻名,并以百分比形式表示。
通过利用这一易于使用、高度可靠的指标,交易者可以快速响应市场波动并实现盈利交易。 获取这款

带有胜率计算系统的指标 【指标特点】 该指标可以让交易者通过符号信号直观、清晰地确认常规技术分析。 此外,它可以通过检查胜率来验证当前参数是否合适,并且它包括一个自动胜率确定系统,当胜率较低时不会生成信号。 这减少了不必要的输入,并且仅在高获胜率期间允许输入。
【重要说明】 ・不可重新涂漆。 可用于从 1 分钟到每周的时间范围。 ・无货币限制。 可与所有货币对一起使用。 ・可以计算胜率。 ・仅当达到预定胜率或更高时才会生成信号。 ・采取减轻负荷措施的设计! 适合长期使用和9种货币对同时使用。 ・作为众所周知的指标,可以一边观察信号一边进行学习。 ・由调试器进行调试和验证以解决任何问题。
[Heikin Ashi 箭头信号的说明] Heikin Ashi 是一种蜡烛图,用作可视化市场趋势状况的指标。 通过处理市场价格数据并创建Heikin Ashi图表,交易者可以直观地掌握市场趋势。
[优点] ・直观地显示市场趋势,对于趋势跟踪交易者很有用。 ・反映市场波动性,在强劲的市场条件下形成较大的蜡烛。
[特征] ・确认价格反转并允许交易者驾驭趋势。 ・易于使用且适合初学者。 ・不

带有胜率计算系统的指标 【指标特点】 该指标可以让交易者通过符号信号直观、清晰地确认常规技术分析。 此外,它可以通过检查胜率来验证当前参数是否合适,并且它包括一个自动胜率确定系统,当胜率较低时不会生成信号。 这减少了不必要的输入,并且仅在高获胜率期间允许输入。
【重要说明】 ・不可重新涂漆。 可用于从 1 分钟到每周的时间范围。 ・无货币限制。 可与所有货币对一起使用。 ・可以计算胜率。 ・仅当达到预定胜率或更高时才会生成信号。 ・采取减轻负荷措施的设计! 适合长期使用和9种货币对同时使用。 ・作为众所周知的指标,可以一边观察信号一边进行学习。 ・由调试器进行调试和验证以解决任何问题。
[令人敬畏的振荡器箭头信号的解释] 动量震荡指标是一种用于衡量市场趋势状况及其强度的技术指标。 根据市场趋势的强度,会显示正柱或负柱。
[优点] ・可视化市场波动并警告市场趋势的变化。 ・初学者容易理解,可靠性高。
[特征] ・与移动平均线组合使用时,可靠性会提高。 ・买入信号:当其穿过零线上方时触发。 ・卖出信号:当其穿过零线下方时触发。
通过使用这种先进的交易工具,交易者可以应对市场

带有胜率计算系统的指标 【指标特点】 该指标可以让交易者通过符号信号直观、清晰地确认常规技术分析。 此外,它可以通过检查胜率来验证当前参数是否合适,并且它包括一个自动胜率确定系统,当胜率较低时不会生成信号。 这减少了不必要的输入,并且仅在高获胜率期间允许输入。
【重要说明】 ・不可重新涂漆。 可用于从 1 分钟到每周的时间范围。 ・无货币限制。 可与所有货币对一起使用。 ・可以计算胜率。 ・仅当达到预定胜率或更高时才会生成信号。 ・采取减轻负荷措施的设计! 适合长期使用和9种货币对同时使用。 ・作为众所周知的指标,可以一边观察信号一边进行学习。 ・由调试器进行调试和验证以解决任何问题。
【加速振荡器箭头信号说明】 加速振荡器是用于衡量市场趋势状况及其强度的指标,以振荡器格式显示以代表市场波动。
[优点] ・可视化市场波动并警告市场趋势的变化。 ・初学者容易理解,可靠性高。 ・因其高可靠性而受到许多交易者的好评。
[特征] ・监控市场动能,适合长期交易。 ・了解市场流向并顺着趋势方向进入至关重要。
[入场信号] ・买入信号:当0线有强劲上涨动力时买入。 ・卖出信号:当0线

配备胜率计算系统的指标 【指标特点】 该指标可以让您通过信号标志直观、清晰地确认正常的技术分析。 此外,它还具有自动胜率确定系统,可以检查当前参数是否合适,并避免在胜率较低时发出信号。 这减少了不必要的入场,并允许您仅在胜率较高时进行交易。
【重要说明】 ・不可重新涂装。 可使用从 1 分钟到每周的图表。 ・无货币限制。 适用于所有货币对。 ・计算胜率的能力。 ・仅当达到预定胜率或更高时才会产生信号。 ・优化减轻负载! 适合长期操作和9种货币对同时使用。 ・作为众所周知的指标,它允许在跟踪信号的同时进行学习。 ・调试器已支持并验证调试以解决任何问题。
【价格范围标志说明】 PRICE RANGE是显示价格范围的指标,即价格的上限和下限。 它由 Evesense 开发,根据某些价格变动提供指示“何时出售”和“何时购买”的箭头符号。 它以简单而有效的方式根据历史数据计算“平均值”,非常适合 1 分钟和 5 分钟图表。 它也是一种多功能工具,能够处理突然的市场变化和意外的新闻。
【指标亮点】 ・在波动和快速变化的市场条件下表现强劲。 ・不适合持续波动的市场。
【入场信号】 ・买

包含 12 种技术分析! 配备胜率计算系统的指标 【指标特点】 该指标可以让您通过信号标志直观、清晰地确认12种正常的技术分析。 此外,它还具有自动胜率确定系统,可以检查当前参数是否合适,并避免在胜率较低时发出信号。 这减少了不必要的入场,并允许您仅在胜率较高时进行交易。
【重要说明】 ・不可重新涂装。 可使用从 1 分钟到每周的图表。 ・无货币限制。 适用于所有货币对。 ・计算胜率的能力。 ・仅当达到预定胜率或更高时才会产生信号。 ・优化减轻负载! 适合长期操作和9种货币对同时使用。 ・作为众所周知的指标,它允许在跟踪信号的同时进行学习。 ・调试器已支持并验证调试以解决任何问题。
【ECHIDNA箭头符号说明】 ECHIDNA箭头指标是一种方便的工具,通过“箭头指标”提供全球著名的12种技术分析。 它的设计易于使用,允许单独的参数设置和删除不必要的指示器。 它根据您认为重要的技术方面使用箭头符号来指导您。
特征: ・通过“箭头符号”提供12种指标分析。 ・检查胜率并仅在达到预定胜率或更高时显示信号。 ・优化减轻负载,实现长期使用。
支持的指标: 01-MACD(移动平均

Indicator UU Bands สำหรับเทรดเดอร์ ที่ต้องการความแม่นยำ ในการเข้าเทรด หรือ หาจังหวะในการเข้าเทรด
ใช้ได้กับทุก ทามเฟรม
ข้อมูลของ อินดิเคเตอร์ 1. มี แบนด์ ด้วยกันทั้งหมด 7 เส้น 2. เส้น 3 เส้น ด้านบน เป็นแนวต้าน เคลื่อนที่ แนวต้านที่1 แนวต้านที่ 2 แนวต้านที่3 3. เส้น 3 เส้น ด้านล่าง เป็นแนวรับ เคลื่อนที่ แนวรับที่ 1 แนวรับที่ 2 แนวรับที่ 3 4. เส้นตรงกลาง เป็นเส้นแบ่ง เทรน สีเขียว หมายถึง แนวโน้มขึ้น สีแดง หมายถึง แนวโน้มลง 5. สัญลักษณ์ ลูกศร สามารถนำไปอ้างอิง เป็นจุดเข้าเทรดได้
คำแนะสำหรับการเท

MT5 Version GaussChannelPro is a powerful and innovative trading indicator designed to enhance your trading strategy with the precision of Gaussian-based channels. Leveraging the principles of Gaussian (normal) distribution, this indicator creates a unique channel on your price chart, offering valuable insights into market trends and potential turning points. Utilizing advanced statistical analysis, GaussChannelPro calculates the optimal channel boundaries based on historical price data, present


在二元期权交易的世界中,精确的市场分析和战略决策至关重要,寻找一种能够开启盈利机会的卓越交易指标的追求永无止境。进入秘密指标的世界——这是一款非凡的MT4二元期权交易工具,以其卓越性能在同类产品中赢得了声誉。
秘密指标是由一群经验丰富的交易员和专业程序员经过多年精心研究、开发和测试而推出的。其独特的算法和先进的数学模型经过精确调校,为交易员在快节奏的二元期权世界中提供了无与伦比的优势。
秘密指标的独特之处在于其惊人的准确性,能够精准地发现有利可图的交易机会。它的信号是由强大的技术指标、价格行动分析和市场情绪评估相结合得出的。这种多方面的方法确保了秘密指标捕捉到短期波动和长期趋势,为交易员提供全面的市场视角。
秘密指标的一个显著特点是其灵活性。无论您是新手交易员还是经验丰富的专业人士,该指标都可以根据您独特的交易风格和偏好进行定制。其用户友好的界面可轻松安装并与流行的MetaTrader 4(MT4)平台集成,使广大交易员能够使用。
秘密指标赋予交易员及时准确的信号,确保他们能够做出明智的交易决策。通过接收实时警报,交易员可以精确进入和退出交易,最大限度地发挥利润潜力,同时有效
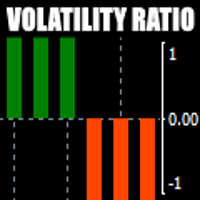
There is always a need to measure if the market is "quiet" or it is volatile. One of the possible way is to use standard deviations, but the issue is simple : We do not have some levels that could help us find out if the market is in a state of lower or higher volatility.
This indicator is attempting to do that : • values above level 0 are indicating state of higher volatility (=GREEN buffer) • values below level 0 are indicating state of lower volatility (=RED buffer)

隆重推出 PivotXpert ,这是一种先进的 多图表 指标,旨在增强您的枢轴点策略。直观的界面让枢轴交易变得轻而易举,轻松释放其潜力。
PivotXpert 的多图表模式通过在所有打开的图表上绘制枢轴线来简化您的交易。使用CalculatePips 功能轻松计算每个级别的剩余点数,轻松微调您的策略。
使用枢轴时间范围定制您的方法,使您的策略与您首选的时间范围保持一致。通过 ATR 参数更深入地了解市场波动性,叠加 ATR 水平以获得更清晰的视图。
使用警报过滤器保持警惕,确保您不会错过任何机会。 PivotXpert 使您能够优化策略并保持领先趋势。使用 PivotXpert 提升您的枢轴交易。
参数 模式 - 在多图表和单图表使用之间进行选择。 枢轴点参数 - 针对特定条件自定义枢轴点指示器。 ATR 参数 - 针对特定条件自定义 ATR 指标。 警报过滤器 - 自定义特定条件的警报。 图形参数 - 自定义视觉外观和颜色。

Индикатор показывает точки входа. Индикатор не перерисовывает и не исчезает в истории. Индикатор может служить дополнением вашей торговой стратегии. При желание можно настроить индикатор как на агрессивную торговлю( но в этом случае будет много ложных сигналов) так же на пассивную торговлю. Хорошие показатели индикатор показывает сигналы на валютной паре GBPUSD на минутном таймфрейме.

Strength of 8 popular currencies (EUR, GBP, USD, CAD, AUD, NZD, CHF, JPY) is calculated from 28 pairs of Forex market following a Moving Average with custom period and method. You can use it by adding 2 indicators to the chart of Forex pair based on the pair currencies and use it as a confirmation on your strategies.
Currencies: EUR, GBP, USD, CAD, AUD, NZD, CHF, JPY
Inputs: Currency: 1 of the 8 currencies MA Period: Period of Moving Average MA Method: Method of Moving Average (SMA, EMA, SMMA

Channel Vertex is a price action pattern formed by price Chanel and a triangle pattern . Price channels basically indicates possible support and resistance zones around a price movement and retracement or breakout at these levels can indicate possible trend continuation or reversal .
Majority of the times price fluctuations forms triangle patterns defined by 3 vertexes , these triangle patterns most times defines a trend continuation. A triangle pattern is a trend continuation pattern that
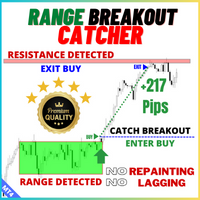
Description: The Range Breakout Catcher Indicator is a powerful tool known for its non-repainting, non-redrawing, and non-lagging capabilities, making it suitable for both manual and robot trading. This indicator utilizes a smart algorithm to calculate ranges and generate early signals for Buy and Sell positions at the breakout of these ranges, facilitating the capture of trends during ranging consolidations. The range calculation involves a comprehensive system based on various elements, prov

完整的 STO 指标(包括三个 STO 指标的所有版本:高级版、黄金版、白银版) - STABLE TRADE OPTION 专为自动二元期权交易而设计。 请仔细阅读!!!!!
重要事项 在一个终端中创建两个不同到期时间的模板,一个为 18:01、18:02,到期时间为 1 至 15 分钟的模板,另一个为 22:00,到期时间为 10 至 20 分钟的模板。 胜率:过去 5 年为 71
资金管理:存款的 0.3
此版本的指标仅用于莫斯科时间 18:01、18:02、22:00 的交易,白银和黄金的到期时间为 1 至 15 分钟,高级版本的到期时间为 10 至 20 分钟。信号出现在蜡烛内部并立即打开交易,如果您使用连接器,则在蜡烛内部打开一个标记。
该指标配置齐全,您无需自行更改。安装并交易
请勿在未经任何检查和测试的情况下购买该指标,我花了两年多时间在真实账户上检查所有版本的sto并查看结果。经过多年测试,我们选择了最佳参数。
应用算法 1. 将指标安装到信号顾问中,信号顾问会自动向经纪商平台发送信号。
- mt2trading.com 平台将为此提供帮助

This is an advanced index algorithm, it provides a very accurate top-bottom signal, it will not frequently appear the wrong signal during the trend, this index does not have any redrawing, drift, or lag behavior. When this signal appears on the chart, it means that the market is about to reverse, or that a period of trend market is over, and then the market will be transformed into a consolidation market, and this indicator does not need to adjust the parameters. It applies to any currency pai

This indicator is very advanced. I dare say that there is no second indicator in the world that describes false breakthroughs so accurately. When the market hits a certain level three times in a row, the market will first break through this level and then return to the inside of the horizontal line. At this time, our indicator will send a signal to alarm that this is a standard fake breakthrough, the index has not been redrawn, the signal has not been delayed, and everything is true and reliable
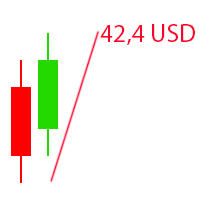
The Visual Result Calculator Indicator is a powerful tool designed to enhance your trading experience on the MetaTrader platform. This intuitive and user-friendly indicator allows you to visualize potential profits or losses on a trading chart, helping you make better-informed decisions and manage your trades with precision. The Indicator displays a dynamic line on the trading chart, representing the potential profit or loss of a trade based on the start and end of the line. Simply click and d

PowerXXX measures the power of the current candlestick and displays it in numerical format and colors. The indicator can cover multiple timeframes and can be placed on the main chart or on the charts of the underlying indicators. The number of timeframes is selectable, as well as the color levels according to the power expressed. In the latest version, the power can be expressed as a function of the opening of the candle itself or as a function of the opening of the total candles before. There

介绍二元智能系统:您的终极交易伴侣 二元智能系统不仅仅是一个指标,它是一个精心设计的复杂交易工具,为交易者提供精确的交易信号和市场洞察。该系统建立在先进的算法和广泛的技术指标基础上,是您解锁交易成功的关键。 指标组件: 移动平均百分比(MAP): 该组件计算多个移动平均线的加权平均值,为趋势识别提供强大的基础。MAP会根据市场条件动态调整,提供有关当前趋势方向的见解。 商品通道指标(CCI): CCI通过分析价格偏离平均值来衡量超买和超卖情况。二元智能系统的CCI集成确保了从整体上识别潜在的反转点。 移动平均线收敛/发散(MACD): 系统中的MACD组件超越了简单的价格交叉。它评估MACD线和信号线的收敛和发散,揭示隐藏的交易机会并确认趋势强度。 平均方向指数(ADX): 使用ADX,二元智能系统量化趋势动量。它可以准确地识别强劲的趋势并帮助您避免弱势、不确定的市场阶段,从而增强您的交易决策。 多空力量: 通过这些指标,可以利用多空情绪的综合力量。这对市场情绪的全面了解有助于进行明智的交易入场。 随机指标: 二元智能系统中的随机指标有助于识别超买和超卖情况,并
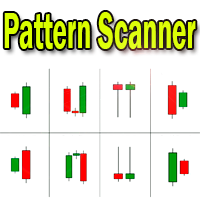
Candlestick pattern indicator - display found candlestick patterns on the chart. MT5-version: https://www.mql5.com/en/market/product/103134 Bearish patterns: Bearish Pattern Designations Pattern name SS
Shooting Star STR(S) Evening Star DJ(E) Evening Doji Star DC Dark Cloud Veil BEP Bearish Engulfing Bullish patterns: Designation of bullish patterns Pattern name HMR
Hammer pattern
STR(M) Morning Star DJ(M) Morning Doji Star PRL Piercing Line BEP Bullish

Using Standard Deviation but not sure if the Standard Deviation is high or low?
eRSD or Easy Relative Standard Deviation comes to your help. Using this you can get a ratio of Standard Deviation to Moving Average and make a good judgement about whether the Standard Deviation is useful or not.
Just add it to the chart and use it away - it supports all periods and moving average calculation methods through the input parameters.

"无重绘"指标旨在分析市场动态并确定潜在的交易信号时机。该指标的主要特点是信号不会重绘,从而有助于更准确可靠地预测市场价格的变动。
操作机制: "无重绘"指标使用多种类型的图形元素来表示交易信号: 上箭头和下箭头:指标用上箭头和下箭头标记可能的市场入场点。上箭头表示可能开设多头头寸的可能性,而下箭头表示空头头寸。 线条:该指标还在图表上绘制线条,表示从上一个箭头到当前箭头的点数距离。这有助于评估价格运动的强度和交易的潜在盈利能力。
交易建议: "无重绘"指标可用于基于以下原则确定市场入场点: 上箭头和下箭头:出现上箭头可能表示可能开设多头头寸的可能性,建议通过其他技术指标或趋势分析来确认信号。同样,下箭头可能表示可能开设空头头寸的可能性。 线条:分析从上一个箭头到当前箭头的点数距离有助于评估价格运动的强度和交易的潜在盈利能力。箭头之间的显著距离可能表示强劲的运动,需要更谨慎的入场。
设置: Wavelength :该参数确定计算指标敏感性的波长。默认值为25。

Hello Dear Trader, Today Im Telling You About The "Golden Scalp System V1 " Metatrader4 Golden Scalp System
Scalper with EMA This is a Scalper strategy based on ( Exponential moving average) EMA . Time frame: H1 Pair: EUR/USD, GBP/USD,AUD/USD XAU/USD
Platform Mt4 Indicators for Scalper with Ema: 300 EMA (Exponential Moving Average) ; 500 EMA (Expontial Moving Average); Stochastic (5,3,3) Long Entry
1) 300 EMA > 500 EMA .
2) Find significant levels of support.
3) Wait for the c

The ICT Silver Bullet indicator is inspired from the lectures of "The Inner Circle Trader" (ICT) and highlights the Silver Bullet (SB) window which is a specific 1-hour interval where a Fair Value Gap (FVG) pattern can be formed. A detail document about ICT Silver Bullet here . There are 3 different Silver Bullet windows (New York local time):
The London Open Silver Bullet (3 AM — 4 AM ~ 03:00 — 04:00)
The AM Session Silver Bullet (10 AM — 11 AM ~ 10:00 — 11:00)
The PM Session Silver Bullet (2

Introducing the POWER TRADE indicator created by a small group of traders with a few years trading trading the financial market profitably . This is a plug and play indicator that provides you with POWERFUL Entry signals with Profit Taking and rebound zones. The indicator Works with all MT4 trading instruments. The indicator uses previous chart data as receipt to speculate on future market moves.
The Power signals occurs on all timeframes. Though the signals occur more often on smaller timef
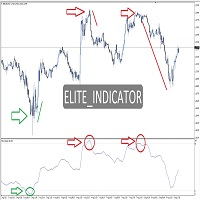
ELT Reversal MT4 (Elite_Indicator) is an indicator for the MetaTrader 4 terminal. . This indicator is based on the Counter-Trend strategy, but also uses Volatility. It is based on showing possible liquidity in the financial market, thus helping traders in their trading. ELT Reversal MT4 (Elite_Indicator) is a visual tool, intuitive, and easy to understand and use.
Recommended time frame for Scalping Trade : M1 M5 M15 Recommended time frame for Swing Trade : M30 upward Better precision:

This is a combination of multiple oscillators into a single divergence system that creates the impression of a more reliable divergence indicator. It is multi-currency based and works best on 15 minutes timeframe and above. Every time a signal is generated, it shows an alert to the user. It is more ideal if combined with other price action indicators or trading systems.

Hidden Gap by MMD Hidden Gap by MMD is a unique indicator that detects hidden gaps between three consecutive candles. This observation isn't my own, but in the MMD methodology, it has its application alongside other original indicators. You can apply this indicator to the chart multiple times and set the interval from which you want to see the hidden gaps. You can show or hide these gaps as needed. For example, you can view the chart at an M5 interval and see hidden gaps from an M15 chart, etc.

MOST 指标是其他平台上非常流行的指标,尤其是股票和指数。基础是移动平均线和高低位。对于股票和指数,使用百分比输入 2,对于外汇工具,使用 1 - 1.5 可能是合适的。您可以对每种乐器进行自己的调整。它是一个易于使用、简单明了的指标。多见于1小时图和日线图。目前我只针对MT4平台进行编辑,如果有MT5平台的需求,我会在以后发布。 MOST 指标是其他平台上非常流行的指标,尤其是股票和指数。基础是移动平均线和高低位。对于股票和指数,使用百分比输入 2,对于外汇工具,使用 1 - 1.5 可能是合适的。您可以对每种乐器进行自己的调整。它是一个易于使用、简单明了的指标。多见于1小时图和日线图。目前我只针对MT4平台进行编辑,如果有MT5平台的需求,我会在以后发布。
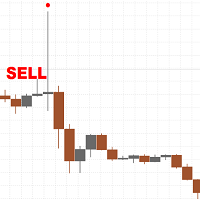
There are only a limited number of copies left, priced at 390 USD . After that, the price will be raised to 450 USD. I develop honest Indicators and know what can work in the market in the long term and what cannot. The classic and most powerful price action pattern is called the pin bar. This pattern works well after the release of fundamental news on M15, M30 and H1 timeframes, but can also be used on other timeframes such as M5 or D1. By default, the settings are set for the H1 timeframe,

Hey traders, it's easy for you to find when to buy or sell signals. Can be used for all forex pairs including gold. How to use this indicator on the M30 or H1 timeframe, for a buy signal, wait until an up arrow appears and for a sell signal, wait for a down arrow, place a stop loss 5-10 points below the arrow. Better trading time on the London and New York sessions and avoid trading when there is news. Happy Trading
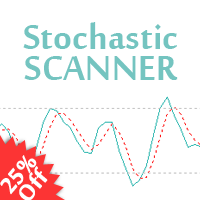
25% off. Original price: $40 Stochastic Scanner is a multi symbol multi timeframe Stochastic dashboard that monitors the indicator for price entering and exiting overbought and oversold in up to 28 symbols and 9 timeframes.
Download Demo here (Scans only M1 and M5) Settings description here MT5 version here
Stochastic Scanner features: Signals price entering and exiting the overbought and oversold zones. Monitors up to 28 customizable instruments and 9 timeframes at the same time. You ca
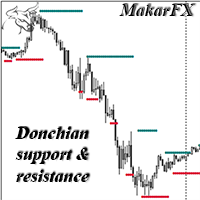
Support and resistance level indicator based on the Donchian channel. The most famous example of trading through the Donchian channel is an experiment with a group of turtles, who earned one hundred and twenty-five million dollars in five years. This indicator can be used as a standalone tool, as well as an additional confirmation. There is MTF, NRP. There are color and thickness settings.

This is a dashboard indicator that displays the auto-calculated risk lot, with the given risk percentage & risk points (Stop Loss) and others. The main function of this indicator is to help you calculate your exact scalping risk lots and swing risk lots. Also it displays the active trades of each pair you've executed with the following: type of trade, lot size, symbol, & equity(+/-). Also displays the bar counter set in every 5-minute bar timer. (whichever time frame you're active, the bar time

Простой и удобный индикатор, указывающий зоны стандартных индикаторов в различных таймфреймах, при необходимости можете в настройках изменить параметры RSI- Relative strength index. Стрелка вверх- если сигнальная линия ниже уровня 300, стрелка вниз- если сигнальная линия выше уровня 70 STOCH- Stochastic. Стрелка вверх- если сигнальная линия ниже уровня 20, стрелка вниз- если сигнальная линия выше уровня 80 ENVELOPE - Envelopes. Стрелка вверх- если свеча открылась ниже красной линии индика

This indicator shows when user set sessions are active and returns various tools + metrics using the closing price within active sessions as an input. Users have the option to change up to 4 session times.
The indicator will increasingly lack accuracy when the chart timeframe is higher than 1 hour.
Settings
Sessions
Enable Session: Allows to enable or disable all associated elements with a specific user set session.
Session Time: Opening and closing times of the user set session in the

This is a dashboard indicator that displays the Average Level of each selected currency pairs that filters and gives us a signal for overbought (>=90%) or if price at extreme peak above 90, and/or oversold (<=10%) or if price at extreme peak below 10.
The calculation is using Relative Strength Index default periods (2 & 9) applied to three different higher time frames H4,D1,&W1.
This won't change or altered even if you change symbol or switch to lower time frames or even in monthly and year
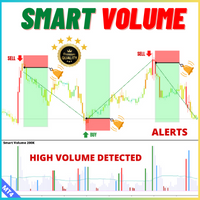
Description: For a comprehensive understanding of our indicators, we invite you to explore the entire Q&A section within this MQL5 blog post here . Technical indicators are crucial tools for analyzing market trends. Smart Volume, can help traders understand price movements and market strength. This indicator utilizes tick volume and price action to identify market trends and reversals. The Smart Volume indicator displays volume bars in blue, yellow, green, red, and white, each signifying dis
---> 价格上涨后,接下来的 5 位买家可享受 10% 折扣 <---
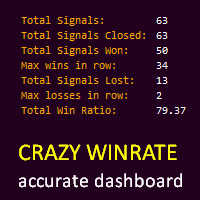
Binary Stalker 是一个基于 adx 的指标,可为任何到期的二元期权经纪商提供看涨期权和看跌期权信号,该指标不可重新绘制,并且附带一个仪表板,显示以下内容:1-胜率 - 2-赢家 - 3- 输家 - 4 - 获胜者排 - 5. 输家排 ,
建议时间范围:任意
调用:绿点出现在新开盘蜡烛上,到期日为该蜡烛结束时
put : 橙色点出现在新开盘蜡烛上,到期日为该蜡烛结束时 请注意,在某些情况下,信号会在高波动期间延迟,因为 adx 交叉可能会在蜡烛期间稍后发生,请跳过这些信号。
===================================================== =====================================================

Automatically detect bullish or bearish order blocks to optimize your trade entries with our powerful indicator. Ideal for traders following ICT (The Inner Circle Trader). Works with any asset type, including cryptocurrencies, stocks, and forex. Displays order blocks on multiple timeframes, from M2 to W1. Alerts you when an order block is detected, migrated, or a higher timeframe order block is created/migrated. Perfect for both scalping and swing trading in Smart Money Concepts. Enhanced by st

The Donchian Scanner Signals Indicator with is a powerful tool designed for traders operating in the financial market using the Metatrader 4 platform. This indicator combines the popular Donchian Channels strategy with advanced signalization and real-time alert features, providing a clear view of potential entry and exit points in a financial asset. Key Features: Donchian Channels Visualization: The indicator graphically displays Donchian Channels on the price chart. These channels are formed us
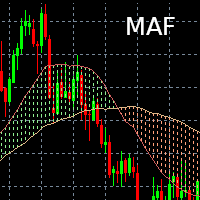
Indicateur Moving Average Filling Affiche deux moyennes mobiles (une courte et une longue) dont la durée et le type (Simple, exponentielle) est paramétrable. L'espace entre les deux moyennes mobiles est alors colorié (rempli) :
- Vert si courte > longue
- Rouge si courte < longue Il est possible de changer les couleurs selon les préférences de chacun / chacune.
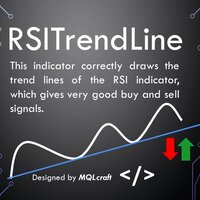
RSI Trend Lines Indicator - Identify Optimal Buying and Selling Opportunities Introduction :
The RSI Trend Lines Indicator is a powerful tool designed to assist traders in identifying optimal buying and selling opportunities based on the Relative Strength Index (RSI) oscillator. This advanced indicator draws trend lines on the RSI chart using multiple points, providing valuable insights into potential market trends and reversals. By leveraging the RSI Trend Lines Indicator, traders can enhance t

Perfect for one minutes high trading and scalping. This indicator is very effective for trading on one minutes, in the hour. A combination of moving averages and STOCHASTICS calculation to produce a very convincing signal every hour. Blue colour signals a buy opportunity. Follow the X signs for possible buy points. The Blue average line serves as possible trend direction and support. Red colour signals a sell opportunity. Follow the X signs for possible sell points. The Red average line serves a

欢迎来到使用 FxBears 超级交易指标的高级交易世界。 这一创新工具专为 MT4 平台设计,结合了艾略特波浪、供需区域和内部指标的强大功能,为交易者提供高质量的信号,以做出明智的交易决策。 FxBears Super 拥有超过 90% 的成功率记录,为您的交易策略带来了新的精确度和盈利水平。 科西嘉岛没有重画,也没有重画。
艾略特波浪分析: FxBears Super 利用艾略特波浪的预测潜力,识别市场周期和趋势。 通过分析特征五浪脉冲和三浪调整形态,准确提取潜在的转折点和延续形态。
供需区: 认识到供需区域的重要性,FxBears Super 在图表上精确指出了关键支撑位和阻力位。 这些市场情绪发生变化的区域为潜在的价格逆转和突破提供了宝贵的见解。
内部指标: FxBears Super 集成了一套内部指标,进一步提高其准确性:
**RSI(相对强弱指数):衡量超买和超卖状况,有助于发现潜在的趋势逆转。
**移动平均线:识别短期和长期趋势,而交叉线则提供潜在进入和退出点的信号。
**MACD(移动平均收敛分歧)

Market Profile Heat indicator — is a classic Market Profile implementation that can show the price density over time, outlining the most important price levels, value area, and control value of a given trading session.
This indicator can be attached to timeframes between M1 and D1 and will show the Market Profile for daily, weekly, monthly, or even intraday sessions. Lower timeframes offer higher precision. Higher timeframes are recommended for better visibility. It is also possible to use a fr

Rapid Trend is a technical analysis indicator that determines the direction and strength of a trend, and also signals a trend change. Allows you to determine the current trend. With the help of its algorithm, you can quickly understand what kind of trend is currently developing in the market. Rapid Trend can be used along with oscillators as filters. Setting up the Rapid Trend forex indicator allows you to receive more accurate signals for opening positions. Uses only one parameter for settings.
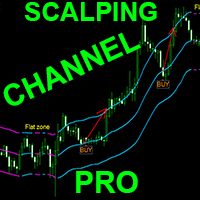
Crypto_Forex 指标“Scalping Channel Pro”适用于 MT4。
- Scalping Channel Pro 具有基于 ATR 的波动边界。 - 非常适合用于剥头皮交易: - 通过安排中线的限价挂单进行交易。 - 当绿色稳定上行通道出现且至少有 1 根蜡烛在顶部边界上方关闭时,考虑看涨入场(见图片)。 - 当红色稳定下行通道出现且至少有 1 根蜡烛在底部边界下方关闭时,考虑看跌入场(见图片)。 - 它具有信息价差掉期显示 - 它显示所附外汇对的当前价差和掉期。 - 显示还显示账户余额、净值和保证金。 - 可以将信息价差掉期显示定位在图表的任何角落: 0 - 左上角,1 - 右上角,2 - 左下角,3 - 右下角。
// 出色的交易机器人和指标可在此处获得: https://www.mql5.com/en/users/def1380/seller 这是仅在此 MQL5 网站上提供的原创产品。

Gann 方块指标是一种强大的市场分析工具,基于 W.D. Gann 在其“市场预测数学公式”一文中介绍的数学概念。该指标融合了与平方数(如 144、90 和 52)有关的 Gann 技术,以及平方 9。此外,它还融入了 关于如何将平方 9 与通道和星形图案结合使用的方法。 用户手册和使用方式: 在使用该指标之前,我们建议您阅读用户手册,并与我们联系以获得任何澄清。您可以在我们的网站上找到完整的用户手册。 该指标提供了 MT5 的完整版本供购买,也提供了 MT4 的免费版本供测试。提供了两个版本的链接供您方便使用。 主要特点和功能: Gann 方块指标为您的交易环境提供了全套工具,使您能够基于几何图案和 Gann 的概念做出明智的决策。以下是主要特点: 平方 9 分析: 该指标可以绘制与平方 9 有关的各种元素,包括水平线、星形图案、网格、Gann 扇形等。这在您的图表上提供了 Gann 的几何概念的视觉表示。 Gann 方块: 该指标绘制了 Gann 方块 52、90 和 144,使您能够可视化和分析它们与价格走势的关系。 自由 Gann 星形图案: 该指标使您能够直接在图表上绘制

The Wamek Support and Resistant (WSR) Indicator is a remarkable tool that stands out in the world of technical analysis. It sets itself apart by cleverly combining price action and leading indicators to delineate support and resistance levels with a high degree of accuracy. Its unique feature is its adaptability; users can fine-tune the indicator by adjusting input parameters, enabling them to create customized support and resistance levels that suit their trading strategies. Notably, one of WSR

目前价格仅限10本,之后价格为90美元
基于包络线和带有箭头的 tma,波段狙击指标是一种多用途指标,因为它显示动态支撑和阻力,还提供买入和卖出箭头等入场信号。
默认设置基于 1 小时时间范围,购买后请联系以获取完整指南。
参赛规则:
买入:1.蜡烛收盘价低于两条频带
2.蜡烛收盘价回到 2 个带内,带有 2 个向上箭头(金色箭头和橙色箭头)
卖出 : 1.蜡烛收于两条带之上
2.蜡烛收盘价回到 2 个带内,带有 2 个向下箭头(金色箭头和橙色箭头)
TP 1 : 中带线
TP 2 :相反波段
SL 箭头下方的几个点
建议的时间范围是:15M 及以上 =====================================================

Binary Lines is a technical analysis indicator for currencies, commodities, cryptocurrencies, stocks, indices and any financial instruments. Can be used for binary options or Forex scalping. Shows entry and exit points at fixed intervals and provides traders the necessary information about the results of possible transactions. Entry points are formed at the very beginning of the candle, in the direction of the MA line, duration
trades in bars can be adjusted manually and adjusted to any financia

The liquidity swings indicator highlights swing areas with existent trading activity. The number of times price revisited a swing area is highlighted by a zone delimiting the swing areas. Additionally, the accumulated volume within swing areas is highlighted by labels on the chart. An option to filter out swing areas with volume/counts not reaching a user-set threshold is also included.
This indicator by its very nature is not real-time and is meant for descriptive analysis alongside other com

This indicator is based on the classical indicator Stochastic and will be helpful for those who love and know how to use not a visual but digital representation of the indicator. All TimeFrames RSI MT4 indicator shows values from each timeframe. You will be able to change the main input parameters for each RSI for every TF. Example for M1: sTF1_____ = "M1"; kPeriod1 = 5; dPeriod1 = 3; Slowing1 = 3; stMethod1 = MODE_SMA; Price_Field1 = MODE_MAIN; stMode1 = 0;
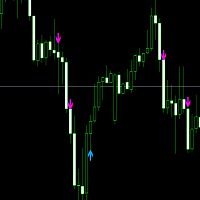
This offer is limited to a temporary period. Entry signal :follow the blue arrow for a buy trade and the Pink for a sell. Buy Trade: When the blue arrow appears, you wait until the candle completely finishes. Then you enter into a Buy Trade as soon as the next candle appears. Now wait until you hit TP1 from the Buy Goals box, then close the trade with a profit. Sell Trade: When the Pink arrow appears, you wait until the candle completely finishes Then you enter into a Buy Trade as soon as the
MetaTrader市场是一个简单方便的网站,在这里开发者可以出售自己的交易应用程序。
我们将帮助您发布您的产品,并向您解释如何为市场准备您的产品描述。市场上所有的应用程序都是加密保护并且只能在买家的电脑上运行。非法拷贝是不可能的。
您错过了交易机会:
- 免费交易应用程序
- 8,000+信号可供复制
- 探索金融市场的经济新闻
注册
登录