Regardez les tutoriels vidéo de Market sur YouTube
Comment acheter un robot de trading ou un indicateur
Exécutez votre EA sur
hébergement virtuel
hébergement virtuel
Test un indicateur/robot de trading avant d'acheter
Vous voulez gagner de l'argent sur Market ?
Comment présenter un produit pour qu'il se vende bien
Indicateurs techniques payants pour MetaTrader 4 - 99
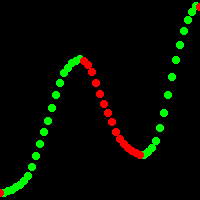
Doesn't redraw!
"Xhmaster formula forex indicator" - a new oscillator indicator with regression mathematical modeling of free numerical series. This indicator is 60% more accurate in identifying price reversal points compared to the standard "Xmaster formula" indicator, and it is less sensitive to small price fluctuations. "Xhmaster formula forex indicator" is a unique and advanced tool designed specifically for traders in the Forex market. It provides traders with excellent opportunities for s

here is a link to back test results
https://youtu.be/9BYDwS9aaqM
https://youtu.be/iLxh43HV91Y
However, the difficult task here for traders is to understand and select the indicator or tool that can help them with their trading plan and benefit their trading style. Traders want a tool that requires minimal effort and provides as much support as it can.
There are multiple reasons for which traders need an indicator. One such reason is to determine the buy-sell signals in the market. The
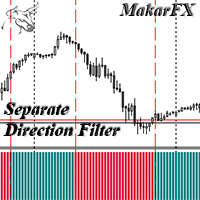
The indicator shows the Buy/Sell direction. The calculations use the opening prices and their rate of change for the billing period - "Calculation period" MTF indicator - "Calculation timeframe", no repaint - NRP. Two display types: "Simple histogram" or "Histogram level crossing" Alerts available: "Chart message", "Push message", "Email message" Two types of signals: "Change direction" or "Crossing level" Level settings: "Crossing UP level" and "Crossing DN level" Color settings. For EA: iCusto

Présentation de notre indicateur révolutionnaire - "TrendStoch Channel Pro" ! Cet outil puissant permet aux traders d'obtenir une vue complète du marché en combinant de manière transparente deux fonctionnalités essentielles - l'observation des tendances temporelles plus larges et le canal stochastique - directement sur votre graphique.
Avec "TrendStoch Channel Pro", vous découvrirez un nouveau niveau de précision de trading. La capacité de l'indicateur à afficher des tendances temporelles

In Forex trading, understanding support and resistance is crucial. Virtually every trading strategy incorporates these levels.
MetaTrader lacks built-in support and resistance calculation features, but there's a solution— the Support and Resistance Lines indicator.
This powerful MetaTrader indicator automatically calculates and displays support and resistance levels for any chosen currency pair or trading instrument.
Benefits of the Support and Resistance Lines indicator:
1. Identify be
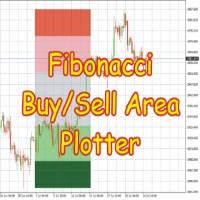
This Indicator is based on Fibonacci levels and draws Buy & Sell Areas. Buy areas are defined in green color (light green & dark green) while Sell areas are defined in red color (light red pink and darker color) Rectangles to easily know that whether price is in buy area or sell area. If price is in gray area, wait for price to come in to your desired area. You can use on any Forex Pairs.
This indicator calculates on the basis of h4 timeframe no matter what time frame you have selected, its cal
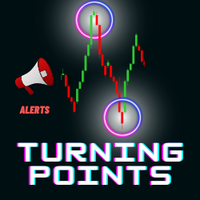
Cet outil permet d'analyser rapidement la structure du marché et de tirer parti des niveaux de prix importants.
Structure du marché Cet indicateur personnalisé trace les niveaux de prix importants, qui peuvent être utilisés comme points d'entrée ou comme objectifs de profit.
Identifiez votre fourchette de trading Cet indicateur vous permet d'identifier votre fourchette de trading en respectant les points de retournement du marché.
Opportunités de trading de rupture Utilisez cet indi

Multicurrency indicator in table format. Signals appear with confirmation, do not redraw. The indicator works on the current (open) timeframe. Notifications come for an open instrument. The strategy includes: price touching the moving average in the direction of the trend, as well as an extraordinary recalculation of the classic ADX indicator to determine the trend as an additional filtering of entries. Entries are displayed on the chart as arrows and, as mentioned above, the arrows are not redr

The indicator shows the Buy/Sell direction. The calculations use the opening prices and their rate of change for the billing period - "Calculation period" MTF indicator - "Calculation timeframe", no repaint - NRP. Two display types: "Chart default" или "Chart color" For "Chart color" color customization available : "Bar color" Two types stop levels: "Simple stop level" or "Dynamic stop level " Color settings: "Stop level color" Alerts available: "Chart message", "Push message", "Email message" F

Indicateur équipé d'un système de calcul du taux de gain [Caractéristiques de l'indicateur] Cet indicateur vous permet de confirmer intuitivement et facilement une analyse technique régulière avec des signaux de signalisation. De plus, il peut vérifier le taux de gain des paramètres actuels et comprend un système de détermination automatique du taux de gain qui évite de donner des signaux lorsque le taux de gain est faible. Cela réduit les entrées inutiles et vous permet de saisir des transac
Candle Scanner Dashboard is an incredibly powerful tool in the financial markets. It excels at detecting market reversals, trend changes, and retracements. The dashboard displays patterns as they are identified, and with a simple click on each pattern, you can view them on their dedicated charts to precisely locate their occurrences. With its capability to detect 11 popular bullish and 11 bearish patterns, you can trust the dashboard to handle pattern identification effortlessly. It provides an

Indicateur équipé d'un système de calcul du taux de gain [Caractéristiques de l'indicateur] Cet indicateur permet une confirmation intuitive et facile de l'analyse technique régulière par le biais de signaux de signalisation. De plus, il peut vérifier la pertinence des paramètres actuels en vérifiant le taux de gain et comprend un système de détermination automatique du taux de gain qui s'abstient de générer des signaux lorsque le taux de gain est faible. Cela réduit les entrées inutiles et p

Indicateur équipé d'un système de calcul du taux de gain [Caractéristiques de l'indicateur] Cet indicateur permet une confirmation intuitive et facile de l'analyse technique régulière par le biais de signaux de signalisation. De plus, il peut vérifier la pertinence des paramètres actuels en vérifiant le taux de gain et comprend un système de détermination automatique du taux de gain qui s'abstient de générer des signaux lorsque le taux de gain est faible. Cela réduit les entrées inutiles et p

Indicateur équipé d'un système de calcul du taux de gain [Caractéristiques de l'indicateur] Cet indicateur permet une confirmation intuitive et facile de l'analyse technique régulière par le biais de signaux de signalisation. De plus, il peut vérifier la pertinence des paramètres actuels en vérifiant le taux de gain et comprend un système de détermination automatique du taux de gain qui s'abstient de générer des signaux lorsque le taux de gain est faible. Cela réduit les entrées inutiles et p

Indicateur équipé d'un système de calcul du taux de gain [Caractéristiques de l'indicateur] Cet indicateur permet une confirmation intuitive et facile de l'analyse technique régulière par le biais de signaux de signalisation. De plus, il peut vérifier la pertinence des paramètres actuels en vérifiant le taux de gain et comprend un système de détermination automatique du taux de gain qui s'abstient de générer des signaux lorsque le taux de gain est faible. Cela réduit les entrées inutiles et p

Indicateur équipé d'un système de calcul du taux de gain [Caractéristiques de l'indicateur] Cet indicateur permet une confirmation intuitive et facile de l'analyse technique régulière par le biais de signaux de signalisation. De plus, il peut vérifier la pertinence des paramètres actuels en vérifiant le taux de gain et comprend un système de détermination automatique du taux de gain qui s'abstient de générer des signaux lorsque le taux de gain est faible. Cela réduit les entrées inutiles et p

Indicateur équipé d'un système de calcul du taux de gain [Caractéristiques de l'indicateur] Cet indicateur permet une confirmation intuitive et facile de l'analyse technique régulière par le biais de signaux de signalisation. De plus, il peut vérifier la pertinence des paramètres actuels en vérifiant le taux de gain et comprend un système de détermination automatique du taux de gain qui s'abstient de générer des signaux lorsque le taux de gain est faible. Cela réduit les entrées inutiles et p

Indicateur avec système de calcul du taux de victoire [Caractéristiques de l'indicateur] Cet indicateur permet une confirmation intuitive et claire de l'analyse technique régulière par le biais de signaux de signalisation. De plus, il peut vérifier la pertinence des paramètres actuels en vérifiant le taux de gain, et il comprend un système de détermination automatique du taux de gain qui s'abstient de générer des signaux lorsque le taux de gain est faible. Cela réduit les entrées inutiles et

Indicateur avec système de calcul du taux de victoire [Caractéristiques de l'indicateur] Cet indicateur permet aux traders de confirmer intuitivement et clairement l'analyse technique régulière par le biais de signaux de signalisation. De plus, il peut vérifier si les paramètres actuels sont appropriés en vérifiant le taux de gain, et il comprend un système de détermination automatique du taux de gain qui s'abstient de générer des signaux lorsque le taux de gain est faible. Cela réduit les en

Indicateur avec système de calcul du taux de victoire [Caractéristiques de l'indicateur] Cet indicateur permet aux traders de confirmer intuitivement et clairement l'analyse technique régulière par le biais de signaux de signalisation. De plus, il peut vérifier si les paramètres actuels sont appropriés en vérifiant le taux de gain, et il comprend un système de détermination automatique du taux de gain qui s'abstient de générer des signaux lorsque le taux de gain est faible. Cela réduit les en

Indicateur avec système de calcul du taux de victoire [Caractéristiques de l'indicateur] Cet indicateur permet aux traders de confirmer intuitivement et clairement l'analyse technique régulière par le biais de signaux de signalisation. De plus, il peut vérifier si les paramètres actuels sont appropriés en vérifiant le taux de gain, et il comprend un système de détermination automatique du taux de gain qui s'abstient de générer des signaux lorsque le taux de gain est faible. Cela réduit les en

Indicateur équipé d'un système de calcul du taux de victoire 【Caractéristiques de l'indicateur】 Cet indicateur vous permet de confirmer intuitivement et clairement l'analyse technique normale à l'aide de signaux de signalisation. De plus, il dispose d'un système de détermination automatique du taux de gain qui vérifie si les paramètres actuels sont adaptés et évite d'émettre des signaux lorsque le taux de gain est faible. Cela réduit les entrées inutiles et vous permet de saisir des transacti

12 types d'analyse technique inclus ! Indicateur équipé d'un système de calcul du taux de victoire 【Caractéristiques de l'indicateur】 Cet indicateur vous permet de confirmer intuitivement et clairement 12 types d'analyses techniques normales grâce à des signaux de signalisation. De plus, il dispose d'un système de détermination automatique du taux de gain qui vérifie si les paramètres actuels sont adaptés et évite d'émettre des signaux lorsque le taux de gain est faible. Cela réduit les entré

VWAP Scanner is a multi-timeframe and multi-symbol dashboard and alert that checks all timeframes and symbols to find trading Opportunities based on Vwap Indicator
How to USE VWAP Scanner
First make a text file with name of Symbols Under Terminal\MQL4\Files
Write the name of symbols as its on mt4 with (,) to separate
Example :
EURUSD,USDJPY,USDCAD,GBPUSD,MCRO,MGLD,NIFTY Note- Its works in all Market And save this text file
Inputs of scanner
NameOfSymbolsTextFile = "Symbols

Indicator UU Bands สำหรับเทรดเดอร์ ที่ต้องการความแม่นยำ ในการเข้าเทรด หรือ หาจังหวะในการเข้าเทรด
ใช้ได้กับทุก ทามเฟรม
ข้อมูลของ อินดิเคเตอร์ 1. มี แบนด์ ด้วยกันทั้งหมด 7 เส้น 2. เส้น 3 เส้น ด้านบน เป็นแนวต้าน เคลื่อนที่ แนวต้านที่1 แนวต้านที่ 2 แนวต้านที่3 3. เส้น 3 เส้น ด้านล่าง เป็นแนวรับ เคลื่อนที่ แนวรับที่ 1 แนวรับที่ 2 แนวรับที่ 3 4. เส้นตรงกลาง เป็นเส้นแบ่ง เทรน สีเขียว หมายถึง แนวโน้มขึ้น สีแดง หมายถึง แนวโน้มลง 5. สัญลักษณ์ ลูกศร สามารถนำไปอ้างอิง เป็นจุดเข้าเทรดได้
คำแนะสำหรับกา
MT5 Version GaussChannelPro is a powerful and innovative trading indicator designed to enhance your trading strategy with the precision of Gaussian-based channels. Leveraging the principles of Gaussian (normal) distribution, this indicator creates a unique channel on your price chart, offering valuable insights into market trends and potential turning points. Utilizing advanced statistical analysis, GaussChannelPro calculates the optimal channel boundaries based on historical price data, present

Global Trend Lines
The Buy/Sell Zone Indicator possesses several features that can be used to improve your trading strategy. This indicator helps you identify buy zones and sell zones on the chart. The main features of this indicator are as follows: Identifying Trend Levels: The indicator has algorithms used to identify trend levels. This helps you determine the direction and strength of the trend. Marking Buy and Sell Zones: The indicator marks buy zones and sell zones on the chart. This ass

Dans le monde du trading d'options binaires, où l'analyse précise du marché et la prise de décisions stratégiques sont primordiales, la quête d'un indicateur de trading exceptionnel capable de débloquer des opportunités rentables est sans fin. Entrez dans le Secret Indicator - un remarquable outil de trading d'options binaires MT4 qui a acquis sa réputation en tant que meilleur et plus performant de sa catégorie.
Le Secret Indicator est le fruit de plusieurs années de recherche minutieuse, de
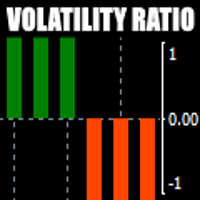
There is always a need to measure if the market is "quiet" or it is volatile. One of the possible way is to use standard deviations, but the issue is simple : We do not have some levels that could help us find out if the market is in a state of lower or higher volatility.
This indicator is attempting to do that : • values above level 0 are indicating state of higher volatility (=GREEN buffer) • values below level 0 are indicating state of lower volatility (=RED buffer)
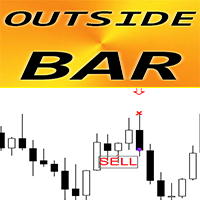
Forex Indicator OUTSIDE Bar Pattern for MT4 Indicator " OUTSIDE Bar " is very powerful indicator for Price Action trading : No repaint, No delays; Indicator detects OUTSIDE Bar patterns on chart: Bullish OUTSIDE Bar - Blue arrow signal on chart (see pictures) Bearish OUTSIDE Bar - Red arrow signal on chart (see pictures) P C, Mobile & Email alerts are included Indicator " OUTSIDE Bar Pattern " is excellent to combine with Support/Resistance Levels: https://www.mql5.com/

Présentation de PivotXpert , un indicateur multigraphique avancé conçu pour améliorer votre stratégie de points pivots. Libérez son potentiel sans effort, avec une interface intuitive qui facilite le trading pivot.
Le mode Multichart de PivotXpert simplifie votre trading en dessinant des lignes de pivot sur tous les graphiques ouverts. Calculez les pips restants à chaque niveau sans effort à l'aide de la fonction CalculatePips, en affinant facilement votre stratégie.
Personnalisez v

Индикатор показывает точки входа. Индикатор не перерисовывает и не исчезает в истории. Индикатор может служить дополнением вашей торговой стратегии. При желание можно настроить индикатор как на агрессивную торговлю( но в этом случае будет много ложных сигналов) так же на пассивную торговлю. Хорошие показатели индикатор показывает сигналы на валютной паре GBPUSD на минутном таймфрейме.

Strength of 8 popular currencies (EUR, GBP, USD, CAD, AUD, NZD, CHF, JPY) is calculated from 28 pairs of Forex market following a Moving Average with custom period and method. You can use it by adding 2 indicators to the chart of Forex pair based on the pair currencies and use it as a confirmation on your strategies.
Currencies: EUR, GBP, USD, CAD, AUD, NZD, CHF, JPY
Inputs: Currency: 1 of the 8 currencies MA Period: Period of Moving Average MA Method: Method of Moving Average (SMA, EMA, S

Channel Vertex is a price action pattern formed by price Chanel and a triangle pattern . Price channels basically indicates possible support and resistance zones around a price movement and retracement or breakout at these levels can indicate possible trend continuation or reversal .
Majority of the times price fluctuations forms triangle patterns defined by 3 vertexes , these triangle patterns most times defines a trend continuation. A triangle pattern is a trend continuation pattern tha

Indicateur "Ultimate Non Repaint Smart" - Un système de trading intelligent sans redessin.
Aperçu du produit :
L'indicateur "Ultimate Non Repaint Smart" est un outil puissant conçu pour les traders sur la plateforme MT4, qui aide à optimiser l'analyse du marché et la prise de décisions commerciales. Grâce à la combinaison de différents indicateurs et systèmes intelligents, cet indicateur permet non seulement d'identifier les points d'achat et de vente potentiels, mais fournit également des

This is an advanced index algorithm, it provides a very accurate top-bottom signal, it will not frequently appear the wrong signal during the trend, this index does not have any redrawing, drift, or lag behavior. When this signal appears on the chart, it means that the market is about to reverse, or that a period of trend market is over, and then the market will be transformed into a consolidation market, and this indicator does not need to adjust the parameters. It applies to any currency pai

This indicator is very advanced. I dare say that there is no second indicator in the world that describes false breakthroughs so accurately. When the market hits a certain level three times in a row, the market will first break through this level and then return to the inside of the horizontal line. At this time, our indicator will send a signal to alarm that this is a standard fake breakthrough, the index has not been redrawn, the signal has not been delayed, and everything is true and reliable
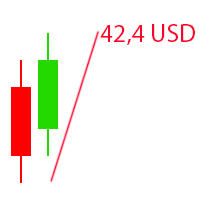
The Visual Result Calculator Indicator is a powerful tool designed to enhance your trading experience on the MetaTrader platform. This intuitive and user-friendly indicator allows you to visualize potential profits or losses on a trading chart, helping you make better-informed decisions and manage your trades with precision. The Indicator displays a dynamic line on the trading chart, representing the potential profit or loss of a trade based on the start and end of the line. Simply click and d

PowerXXX measures the power of the current candlestick and displays it in numerical format and colors. The indicator can cover multiple timeframes and can be placed on the main chart or on the charts of the underlying indicators. The number of timeframes is selectable, as well as the color levels according to the power expressed. In the latest version, the power can be expressed as a function of the opening of the candle itself or as a function of the opening of the total candles before. There

**Découvrez le Système Intelligent Binaire : Votre Compagnon de Trading Ultime**
Le Système Intelligent Binaire n'est pas simplement un indicateur ; c'est un outil de trading sophistiqué conçu méticuleusement pour doter les traders d'une précision exceptionnelle et des signaux opportuns sur divers marchés. Construit sur une base d'algorithmes de pointe et une collection exhaustive d'indicateurs techniques, ce système est la clé pour débloquer le succès en trading.
**Composants de l'Indicate
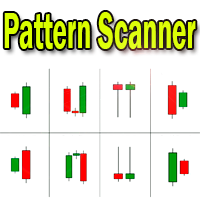
Candlestick pattern indicator - display found candlestick patterns on the chart. MT5-version: https://www.mql5.com/en/market/product/103134 Bearish patterns: Bearish Pattern Designations Pattern name SS
Shooting Star STR(S) Evening Star DJ(E) Evening Doji Star DC Dark Cloud Veil BEP Bearish Engulfing Bullish patterns: Designation of bullish patterns Pattern name HMR
Hammer pattern
STR(M) Morning Star DJ(M) Morning Doji Star PRL Piercing Line BEP Bulli
Using Standard Deviation but not sure if the Standard Deviation is high or low?
eRSD or Easy Relative Standard Deviation comes to your help. Using this you can get a ratio of Standard Deviation to Moving Average and make a good judgement about whether the Standard Deviation is useful or not.
Just add it to the chart and use it away - it supports all periods and moving average calculation methods through the input parameters.

The "No repaint" indicator is designed for analyzing market dynamics and determining potential trading signal moments. The main feature of this indicator is the absence of signal repainting, which contributes to more accurate and reliable forecasting of price movements in the market.
Mechanism of Operation: The "No repaint" indicator uses several types of graphical elements to indicate trading signals: Up and Down Arrows: The indicator marks possible market entry points with up and down arrow

Hello Dear Trader, Today Im Telling You About The "Golden Scalp System V1 " Metatrader4 Golden Scalp System
Scalper with EMA This is a Scalper strategy based on ( Exponential moving average) EMA . Time frame: H1 Pair: EUR/USD, GBP/USD,AUD/USD XAU/USD
Platform Mt4 Indicators for Scalper with Ema: 300 EMA (Exponential Moving Average) ; 500 EMA (Expontial Moving Average); Stochastic (5,3,3) Long Entry
1) 300 EMA > 500 EMA .
2) Find significant levels of support.
3) Wait for

Introducing the POWER TRADE indicator created by a small group of traders with a few years trading trading the financial market profitably . This is a plug and play indicator that provides you with POWERFUL Entry signals with Profit Taking and rebound zones. The indicator Works with all MT4 trading instruments. The indicator uses previous chart data as receipt to speculate on future market moves.
The Power signals occurs on all timeframes. Though the signals occur more often on smaller tim
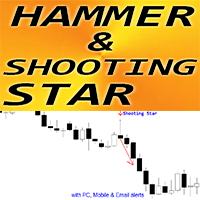
Forex Indicator " Hammer and Shooting Star pattern" for MT4 Indicator " Hammer and Shooting Star pattern " is very powerful indicator for Price Action trading : No repaint, No delays; Indicator detects bullish Hammer and bearish Shooting Star patterns on chart: Bullish Hammer - Blue arrow signal on chart (see pictures) Bearish Shooting Star - Red arrow signal on chart (see pictures) P C, Mobile & Email alerts are included Indicator " Hammer and Shooting Star pattern" is excel

Révélez les Astuces de Trading avec les VWAPs Ancrés Automatiques : Les VWAPs Ancrés Automatiques sont vos compagnons de trading. Ces indicateurs repèrent les points de retournement clés du marché et les illustrent sur votre graphique à l'aide des lignes VWAP. Ceci est une révolution pour les traders qui utilisent des stratégies basées sur les VWAP ancrés. Comment Ça Marche ? Identification des Points Hauts : Si le prix le plus élevé de la bougie actuelle est inférieur au prix le plus élevé de l

**"Support and Resistance Breakout" Indicator for MetaTrader 4 (MT4)**
Hello traders and investors on the MetaTrader 4 (MT4) platform,
We are excited to introduce to you the "Support and Resistance Breakout" indicator - a powerful tool designed for MT4 that helps you capitalize on trading opportunities involving support and resistance breakouts effectively and confidently.
**Overview:**
The "Support and Resistance Breakout" indicator is a custom tool built on the MetaTrader 4 platform,

Welcome to the "Keltner Amplified Breakout" Indicator Are you searching for a powerful and effective trading tool on the MT4 platform? Let us introduce you to the "Keltner Amplified Breakout" Indicator. Designed to help you capture potential trading opportunities, this indicator offers the perfect blend of high performance and user-friendliness. Key Advantages: Identify Strong Trends: This indicator utilizes Keltner channels and fractal signals to identify robust upward or downward trends in
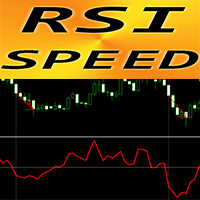
Forex Indicator "RSI SPEED" for MT4 - great predictive tool! The calculation of this indicator is based on equations from physics . RSI SPEED is the 1st derivative of RSI itself RSI SPEED is good for scalping entries into the direction of main trend Use it in combination with suitable trend indicator , for example HTF MA (as on pictures) RSI SPEED indicator shows how fast RSI itself changes its direction - it is very sensitive It is recommended to use RSI SPEED indicator fo

Il s'agit d'une combinaison de plusieurs oscillateurs en un seul système de divergence qui donne l'impression d'un indicateur de divergence plus fiable. Il est basé sur plusieurs devises et fonctionne mieux sur une période de 15 minutes et plus. Chaque fois qu'un signal est généré, il affiche une alerte à l'utilisateur. Il est plus idéal s'il est combiné avec d'autres indicateurs d'action des prix ou systèmes de négociation.

Hidden Gap by MMD Hidden Gap by MMD is a unique indicator that detects hidden gaps between three consecutive candles. This observation isn't my own, but in the MMD methodology, it has its application alongside other original indicators. You can apply this indicator to the chart multiple times and set the interval from which you want to see the hidden gaps. You can show or hide these gaps as needed. For example, you can view the chart at an M5 interval and see hidden gaps from an M15 chart, etc.

Bonjour,
Êtes-vous à la recherche d'une solution optimale pour générer des profits sur le marché financier via la plateforme MetaTrader 4 (MT4) ? Nous vous présentons "Sonic R Non Repaint Smart" - un système de trading intelligent qui apporte précision et efficacité aux traders.
Présentation de "Sonic R Non Repaint Smart" :
"Sonic R Non Repaint Smart" est un solide indicateur de trading construit sur la très estimée stratégie de trading Sonic R. Nous sommes fiers de proposer une solution

L'indicateur MOST est un indicateur très populaire utilisé sur d'autres plateformes, notamment pour les actions et les indices. La base est constituée de moyennes mobiles et de niveaux haut-bas. Il peut être approprié d'utiliser le pourcentage saisi comme 2 pour les actions et les indices, et entre 1 et 1,5 pour les instruments de change. Vous pouvez effectuer votre propre réglage pour chaque instrument. C’est un indicateur facile à utiliser, simple et clair. Il est plus courant dans les graphiq
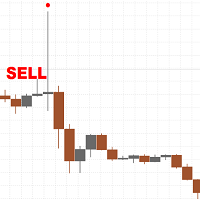
There are only a limited number of copies left, priced at 390 USD . After that, the price will be raised to 450 USD. I develop honest Indicators and know what can work in the market in the long term and what cannot. The classic and most powerful price action pattern is called the pin bar. This pattern works well after the release of fundamental news on M15, M30 and H1 timeframes, but can also be used on other timeframes such as M5 or D1. By default, the settings are set for the H1 timeframe,

Hey traders, it's easy for you to find when to buy or sell signals. Can be used for all forex pairs including gold. How to use this indicator on the M30 or H1 timeframe, for a buy signal, wait until an up arrow appears and for a sell signal, wait for a down arrow, place a stop loss 5-10 points below the arrow. Better trading time on the London and New York sessions and avoid trading when there is news. Happy Trading
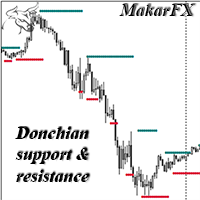
Support and resistance level indicator based on the Donchian channel. The most famous example of trading through the Donchian channel is an experiment with a group of turtles, who earned one hundred and twenty-five million dollars in five years. This indicator can be used as a standalone tool, as well as an additional confirmation. There is MTF, NRP. There are color and thickness settings.

This is a dashboard indicator that displays the auto-calculated risk lot, with the given risk percentage & risk points (Stop Loss) and others. The main function of this indicator is to help you calculate your exact scalping risk lots and swing risk lots. Also it displays the active trades of each pair you've executed with the following: type of trade, lot size, symbol, & equity(+/-). Also displays the bar counter set in every 5-minute bar timer. (whichever time frame you're active, the bar time

Простой и удобный индикатор, указывающий зоны стандартных индикаторов в различных таймфреймах, при необходимости можете в настройках изменить параметры RSI- Relative strength index. Стрелка вверх- если сигнальная линия ниже уровня 300, стрелка вниз- если сигнальная линия выше уровня 70 STOCH- Stochastic. Стрелка вверх- если сигнальная линия ниже уровня 20, стрелка вниз- если сигнальная линия выше уровня 80 ENVELOPE - Envelopes. Стрелка вверх- если свеча открылась ниже красной линии индика

This indicator shows when user set sessions are active and returns various tools + metrics using the closing price within active sessions as an input. Users have the option to change up to 4 session times.
The indicator will increasingly lack accuracy when the chart timeframe is higher than 1 hour.
Settings
Sessions
Enable Session: Allows to enable or disable all associated elements with a specific user set session.
Session Time: Opening and closing times of the user set session
Introduction:
La "Turning Zone" est un indicateur MT4 sophistiqué et innovant conçu pour fournir aux traders un outil puissant pour détecter les inversions de tendance potentielles sur les marchés financiers. En utilisant le concept intemporel de l'analyse de la fourche, l'indicateur Turning Zone identifie les principales zones d'inversion où le sentiment du marché est susceptible de changer, offrant aux traders des informations précieuses pour prendre des décisions éclairées.
Version MT5

This is a dashboard indicator that displays the Average Level of each selected currency pairs that filters and gives us a signal for overbought (>=90%) or if price at extreme peak above 90, and/or oversold (<=10%) or if price at extreme peak below 10.
The calculation is using Relative Strength Index default periods (2 & 9) applied to three different higher time frames H4,D1,&W1.
This won't change or altered even if you change symbol or switch to lower time frames or even in monthly and y

The Donchian Scanner Signals Indicator with is a powerful tool designed for traders operating in the financial market using the Metatrader 4 platform. This indicator combines the popular Donchian Channels strategy with advanced signalization and real-time alert features, providing a clear view of potential entry and exit points in a financial asset. Key Features: Donchian Channels Visualization: The indicator graphically displays Donchian Channels on the price chart. These channels are formed us
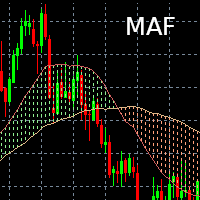
Indicateur Moving Average Filling Affiche deux moyennes mobiles (une courte et une longue) dont la durée et le type (Simple, exponentielle) est paramétrable. L'espace entre les deux moyennes mobiles est alors colorié (rempli) :
- Vert si courte > longue
- Rouge si courte < longue Il est possible de changer les couleurs selon les préférences de chacun / chacune.
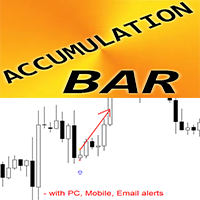
Forex Indicator Accumulation Bar Pattern for MT4 Indicator " Accumulation Bar " is very powerful breakout-focused indicator for Price Action trading Indicator detects price accumulation in narrow area during 1 bar and shows: Breakout direction, Pending order and SL locations Bullish Accumulation Bar - Blue arrow signal on chart (see pictures) Bearish Accumulation Bar - Red arrow signal on chart (see pictures) No repaint; No delays; High R/R ratio (reward/risk); I ndicator has adjustab

**Indicateur Breakout Box pour MT4 - Découvrez des opportunités de trading efficaces**
Salutations, chers traders,
Nous sommes ravis de vous présenter l'indicateur Breakout Box version 2.0 - un outil de trading puissant et précis créé par KPRO. Il s'agit d'un actif précieux qui vous aide à repérer des opportunités de trading sur le marché Forex, en optimisant vos profits tout en minimisant les risques.
**Caractéristiques principales :**
1. **Trading de Breakouts efficace :** L'indicateu
Please feel free to contact me if you need any further information.
Please let me know if you have any questions.
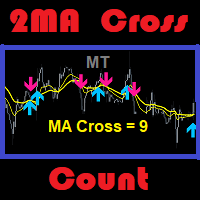
I hope the above is useful to you. MT 2ma Cross Count : is a moving average with 2 lines crossing but the strategy is to focus on the desired number of history bars and count signals that occur. Suitable for traders specialize in martingale strategy or traders specialize in technical ... etc. Traders with the ability to do fundamental analysis have an advantage. Because it will ma
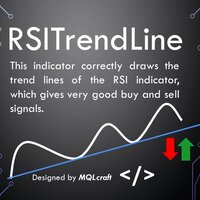
RSI Trend Lines Indicator - Identify Optimal Buying and Selling Opportunities Introduction :
The RSI Trend Lines Indicator is a powerful tool designed to assist traders in identifying optimal buying and selling opportunities based on the Relative Strength Index (RSI) oscillator. This advanced indicator draws trend lines on the RSI chart using multiple points, providing valuable insights into potential market trends and reversals. By leveraging the RSI Trend Lines Indicator, traders can enhance

Perfect for one minutes high trading and scalping. This indicator is very effective for trading on one minutes, in the hour. A combination of moving averages and STOCHASTICS calculation to produce a very convincing signal every hour. Blue colour signals a buy opportunity. Follow the X signs for possible buy points. The Blue average line serves as possible trend direction and support. Red colour signals a sell opportunity. Follow the X signs for possible sell points. The Red average line serves a
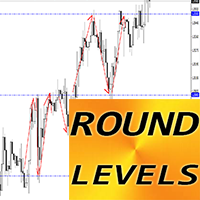
Forex Indicator "Round Levels" for MT4 Indicator "Round Levels" is must have auxiliary indicator for traders who take support/resistance into consideration Round Levels are respected by the price very much - price rebounds from round levels very often Use 1000 points Step for H4, D1 time frames U se 500 points Step for H1 and lower time frames (for intraday trading) Also Round levels are good to allocate Take Profits (in front of round level) and SL (behind the round level) These levels are ver
Le MetaTrader Market est un site simple et pratique où les développeurs peuvent vendre leurs applications de trading.
Nous vous aiderons à publier votre produit et vous expliquerons comment préparer la description de votre produit pour le marché. Toutes les applications de Market sont protégées par un cryptage et ne peuvent être exécutées que sur l'ordinateur de l'acheteur. La copie illégale est impossible.
Vous manquez des opportunités de trading :
- Applications de trading gratuites
- Plus de 8 000 signaux à copier
- Actualités économiques pour explorer les marchés financiers
Inscription
Se connecter
Si vous n'avez pas de compte, veuillez vous inscrire
Autorisez l'utilisation de cookies pour vous connecter au site Web MQL5.com.
Veuillez activer les paramètres nécessaires dans votre navigateur, sinon vous ne pourrez pas vous connecter.