MetaTrader 4용 유료 기술 지표 - 99

승률 계산 시스템이 적용된 지표 [인디케이터 기능] 이 지표는 트레이더가 기호 신호를 통해 정기적인 기술 분석을 직관적이고 명확하게 확인할 수 있도록 합니다. 또한 승률을 확인하여 현재 파라미터가 적절한지 확인할 수 있으며 승률이 낮을 때 신호를 생성하지 않는 자동 승률 결정 시스템이 포함되어 있습니다. 이는 불필요한 응모를 줄이고 승률이 높은 기간에만 응모할 수 있도록 합니다.
[중요 설명] ・다시 칠하지 않습니다. 1분에서 매주까지의 시간대에 사용할 수 있습니다. ・통화 제한이 없습니다. 모든 통화 쌍에 사용할 수 있습니다. ・승률을 계산할 수 있습니다. ・미리 정의된 승률 이상이 충족될 때만 신호가 생성됩니다. ・부하 경감 대책으로 설계! 9개의 통화쌍으로 장기간 사용 및 동시 사용에 적합합니다. ・잘 알려진 지표로 신호를 관찰하면서 공부할 수 있습니다. ・모든 문제를 해결하기 위해 디버거에 의해 디버깅 및 검증되었습니다.
[Accelerator Oscillator

승률 계산 시스템이 탑재된 지표 【지시등 기능】 정상적인 기술적 분석을 시그널 사인을 통해 직관적이고 명확하게 확인할 수 있는 지표입니다. 또한 현재 매개변수가 적합한지 확인하고 승률이 낮을 때 신호를 보내는 것을 방지하는 자동 승률 결정 시스템이 있습니다. 이를 통해 불필요한 입력을 줄이고 승률이 높을 때만 거래를 입력할 수 있습니다.
【중요 설명】 ・다시 칠하지 않습니다. 1분부터 주간 차트까지 사용 가능합니다. ・통화 제한이 없습니다. 모든 통화 쌍에 사용할 수 있습니다. ・승률 계산 기능. ・정해진 승률 이상에 도달했을 때만 신호가 발생합니다. ・부하 감소에 최적화! 9개의 통화쌍으로 장기 운용 및 동시 사용에 적합합니다. ・잘 알려진 지표이기 때문에 신호를 따라가면서 공부할 수 있습니다. ・문제를 해결하기 위해 디버거에서 디버깅을 지원하고 검증했습니다.
【가격대 표시 설명】 PRICE RANGE는 가격 범위, 즉 가격의 상한과 하한을 나타내는 지표입니다. Eve

기술적 분석 12종 포함! 승률 계산 시스템을 갖춘 지표 【지시등 기능】 정상적인 기술적 분석 12가지를 시그널 사인을 통해 직관적이고 명확하게 확인할 수 있는 지표입니다. 또한 현재 매개변수가 적합한지 확인하고 승률이 낮을 때 신호를 보내는 것을 방지하는 자동 승률 결정 시스템이 있습니다. 이를 통해 불필요한 입력을 줄이고 승률이 높을 때만 거래를 입력할 수 있습니다.
【중요 설명】 ・다시 칠하지 않습니다. 1분부터 주간 차트까지 사용 가능합니다. ・통화 제한이 없습니다. 모든 통화 쌍에 사용할 수 있습니다. ・승률 계산 기능. ・정해진 승률 이상에 도달했을 때만 신호가 발생합니다. ・부하 감소에 최적화! 9개의 통화쌍으로 장기 운용 및 동시 사용에 적합합니다. ・잘 알려진 지표이기 때문에 신호를 따라가면서 공부할 수 있습니다. ・문제를 해결하기 위해 디버거에서 디버깅을 지원하고 검증했습니다.
【ECHIDNA 화살표 기호 설명】 ECHIDNA Arrow Sign Ind

VWAP Scanner is a multi-timeframe and multi-symbol dashboard and alert that checks all timeframes and symbols to find trading Opportunities based on Vwap Indicator
How to USE VWAP Scanner
First make a text file with name of Symbols Under Terminal\MQL4\Files
Write the name of symbols as its on mt4 with (,) to separate
Example :
EURUSD,USDJPY,USDCAD,GBPUSD,MCRO,MGLD,NIFTY Note- Its works in all Market And save this text file
Inputs of scanner
NameOfSymbolsTextFile = "Symbols

Indicator UU Bands สำหรับเทรดเดอร์ ที่ต้องการความแม่นยำ ในการเข้าเทรด หรือ หาจังหวะในการเข้าเทรด
ใช้ได้กับทุก ทามเฟรม
ข้อมูลของ อินดิเคเตอร์ 1. มี แบนด์ ด้วยกันทั้งหมด 7 เส้น 2. เส้น 3 เส้น ด้านบน เป็นแนวต้าน เคลื่อนที่ แนวต้านที่1 แนวต้านที่ 2 แนวต้านที่3 3. เส้น 3 เส้น ด้านล่าง เป็นแนวรับ เคลื่อนที่ แนวรับที่ 1 แนวรับที่ 2 แนวรับที่ 3 4. เส้นตรงกลาง เป็นเส้นแบ่ง เทรน สีเขียว หมายถึง แนวโน้มขึ้น สีแดง หมายถึง แนวโน้มลง 5. สัญลักษณ์ ลูกศร สามารถนำไปอ้างอิง เป็นจุดเข้าเทรดได้
คำแนะสำหรับกา
MT5 Version GaussChannelPro is a powerful and innovative trading indicator designed to enhance your trading strategy with the precision of Gaussian-based channels. Leveraging the principles of Gaussian (normal) distribution, this indicator creates a unique channel on your price chart, offering valuable insights into market trends and potential turning points. Utilizing advanced statistical analysis, GaussChannelPro calculates the optimal channel boundaries based on historical price data, present

Global Trend Lines
The Buy/Sell Zone Indicator possesses several features that can be used to improve your trading strategy. This indicator helps you identify buy zones and sell zones on the chart. The main features of this indicator are as follows: Identifying Trend Levels: The indicator has algorithms used to identify trend levels. This helps you determine the direction and strength of the trend. Marking Buy and Sell Zones: The indicator marks buy zones and sell zones on the chart. This ass

세계적인 바이너리 옵션 거래에서는 정확한 시장 분석과 전략적인 의사 결정이 핵심입니다. 수익성 있는 기회를 찾아내는 뛰어난 거래 지표를 찾는 여정은 끝이 없습니다. 비밀 지표(Secret Indicator)가 등장합니다 - 최고이며 강력한 MT4 바이너리 옵션 거래 도구로서의 명성을 얻은 주목할 만한 도구입니다.
비밀 지표는 경험있는 트레이더와 전문 프로그래머들로 구성된 팀에 의해 수년간의 세심한 연구, 개발 및 테스트를 통해 만들어졌습니다. 독특한 알고리즘과 고급 수학적 모델은 바이너리 옵션의 빠른 속도로 변동하는 세계에서 트레이더에게 무적의 이점을 제공하기 위해 정교하게 조정되었습니다.
비밀 지표를 다른 거래 지표와 구분 짓는 특징은 놀라운 정확도로 수익성 있는 거래 기회를 발견하는 능력입니다. 이 신호는 강력한 기술적 지표, 가격 행동 분석 및 시장 감성 평가의 조합에서 유도됩니다. 이 다각적 접근법은 비밀 지표가 단기 변동과 장기 추세 모두를 포착하여 트레이더에게 시
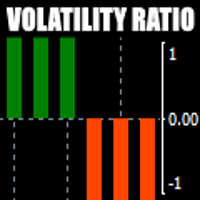
There is always a need to measure if the market is "quiet" or it is volatile. One of the possible way is to use standard deviations, but the issue is simple : We do not have some levels that could help us find out if the market is in a state of lower or higher volatility.
This indicator is attempting to do that : • values above level 0 are indicating state of higher volatility (=GREEN buffer) • values below level 0 are indicating state of lower volatility (=RED buffer)
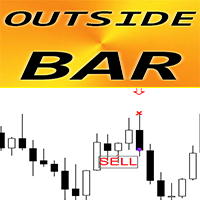
MT4용 외환 표시기 외부 바 패턴
표시기 "OUTSIDE Bar"는 가격 조치 거래에 대한 매우 강력한 표시기입니다. 다시 칠하지 않고 지연도 없습니다. 표시기는 차트에서 외부 막대 패턴을 감지합니다. Bullish OUTSIDE Bar - 차트의 파란색 화살표 신호(그림 참조) Bearish OUTSIDE Bar - 차트의 빨간색 화살표 신호(그림 참조) PC, 모바일 및 이메일 알림이 포함되어 있습니다. 표시기 "OUTSIDE Bar Pattern"은 지원/저항 수준과 결합하는 데 탁월합니다: https://www.mql5.com/en/market/product/100903
// 더 훌륭한 전문가 자문 및 지표는 여기에서 확인할 수 있습니다: https://www.mql5.com/en/users/def1380/seller // 또한 수익성 있고 안정적이며 신뢰할 수 있는 신호 https://www.mql5.com/en/signals/1887493에 참여하실 수 있습니다

피벗 포인트 전략을 향상시키도록 설계된 고급 멀티차트 지표인 PivotXpert를 소개합니다. 피벗 거래를 쉽게 만들어주는 직관적인 인터페이스로 잠재력을 쉽게 발휘하세요.
PivotXpert의 멀티차트 모드는 열려 있는 모든 차트에 피벗 라인을 그려 거래를 단순화합니다. CalculatePips 기능을 사용하여 쉽게 각 레벨에 남은 핍을 계산하여 전략을 쉽게 미세 조정하십시오.
Pivot Timeframe을 사용하여 접근 방식을 사용자 지정하여 원하는 기간에 전략을 맞춥니다. ATR 매개변수를 사용하여 시장 변동성에 대한 더 깊은 통찰력을 얻고 ATR 수준을 더 명확하게 볼 수 있습니다.
기회를 놓치지 않도록 경고 필터로 경계를 유지하십시오. PivotXpert를 사용하면 전략을 최적화하고 추세를 앞서갈 수 있습니다. PivotXpert로 피벗 거래를 향상시키십시오.
매개변수 모드 - 멀티차트와 단일 차트 사용 중에서 선택합니다. 피벗 포

Индикатор показывает точки входа. Индикатор не перерисовывает и не исчезает в истории. Индикатор может служить дополнением вашей торговой стратегии. При желание можно настроить индикатор как на агрессивную торговлю( но в этом случае будет много ложных сигналов) так же на пассивную торговлю. Хорошие показатели индикатор показывает сигналы на валютной паре GBPUSD на минутном таймфрейме.

Strength of 8 popular currencies (EUR, GBP, USD, CAD, AUD, NZD, CHF, JPY) is calculated from 28 pairs of Forex market following a Moving Average with custom period and method. You can use it by adding 2 indicators to the chart of Forex pair based on the pair currencies and use it as a confirmation on your strategies.
Currencies: EUR, GBP, USD, CAD, AUD, NZD, CHF, JPY
Inputs: Currency: 1 of the 8 currencies MA Period: Period of Moving Average MA Method: Method of Moving Average (SMA, EMA, S

"얼티밋 논리페인트 스마트" 지표 - 리페인트 없는 스마트한 트레이딩 시스템.
제품 개요:
"얼티밋 논리페인트 스마트" 지표는 MT4 플랫폼의 트레이더를 위해 설계된 강력한 도구로, 시장 분석과 거래 결정을 최적화하는 데 도움을 줍니다. 다양한 지표와 스마트 시스템의 결합으로 이 지표는 잠재적인 매수와 매도 포인트를 파악하는 데 도움을 주며 신뢰할 수 있는 거래 신호를 제공합니다.
주요 특징:
논리페인트 없는 시스템: 이 지표의 주요 장점 중 하나는 논리페인트 기능이며, 차트에 표시된 거래 신호가 나타난 후 변경되지 않도록 보장합니다. 이는 신호에 대한 신뢰성을 높이고 정확한 거래 결정을 가능하게 합니다.
다양한 기술적 지표: "얼티밋 논리페인트 스마트" 지표는 이동 평균, RSI, 볼린저 밴드, 불스 파워, 베어스 파워 등 다양한 주요 기술적 지표들을 결합합니다. 이러한 지표들의 스마트한 결합으로 시장의 종합적인 전망을 제공하며 성공적인 거래 기회를 높입니다.

This is an advanced index algorithm, it provides a very accurate top-bottom signal, it will not frequently appear the wrong signal during the trend, this index does not have any redrawing, drift, or lag behavior. When this signal appears on the chart, it means that the market is about to reverse, or that a period of trend market is over, and then the market will be transformed into a consolidation market, and this indicator does not need to adjust the parameters. It applies to any currency pai

This indicator is very advanced. I dare say that there is no second indicator in the world that describes false breakthroughs so accurately. When the market hits a certain level three times in a row, the market will first break through this level and then return to the inside of the horizontal line. At this time, our indicator will send a signal to alarm that this is a standard fake breakthrough, the index has not been redrawn, the signal has not been delayed, and everything is true and reliable
The Visual Result Calculator Indicator is a powerful tool designed to enhance your trading experience on the MetaTrader platform. This intuitive and user-friendly indicator allows you to visualize potential profits or losses on a trading chart, helping you make better-informed decisions and manage your trades with precision. The Indicator displays a dynamic line on the trading chart, representing the potential profit or loss of a trade based on the start and end of the line. Simply click and d

PowerXXX measures the power of the current candlestick and displays it in numerical format and colors. The indicator can cover multiple timeframes and can be placed on the main chart or on the charts of the underlying indicators. The number of timeframes is selectable, as well as the color levels according to the power expressed. In the latest version, the power can be expressed as a function of the opening of the candle itself or as a function of the opening of the total candles before. There

**바이너리 스마트 시스템 소개: 귀하의 궁극적인 트레이딩 파트너**
바이너리 스마트 시스템은 단순히 인디케이터가 아닙니다. 이는 정교한 트레이딩 도구로, 다양한 시장에서 핀포인트 정확도와 적시의 신호를 제공하여 트레이더에게 성공을 이끌어주는 데 주안점을 둔 것입니다. 혁신적인 알고리즘과 다양한 기술적 지표의 철저한 컬렉션을 기반으로 구축된 이 시스템은 트레이딩 성공을 얻기 위한 열쇠입니다.
**인디케이터 구성 요소:**
1. **이동 평균 비율 (MAP):** 이 구성 요소는 다양한 이동 평균의 가중 평균을 계산하여 추세 식별을 위한 강력한 기준을 형성합니다. MAP은 시장 상황에 동적으로 적응하여 현재 추세 방향을 파악하는 정보를 제공합니다.
2. **상품 채널 지수 (CCI):** 평균 가격으로부터의 편차를 분석함으로써 CCI는 과매수 및 과매도 조건을 판단합니다. 바이너리 스마트 시스템의 CCI 통합은 잠재적인 반전 지점을 식별하는 종합적인 접근을 보장합니다.
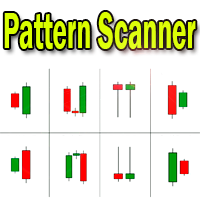
Candlestick pattern indicator - display found candlestick patterns on the chart. MT5-version: https://www.mql5.com/en/market/product/103134 Bearish patterns: Bearish Pattern Designations Pattern name SS
Shooting Star STR(S) Evening Star DJ(E) Evening Doji Star DC Dark Cloud Veil BEP Bearish Engulfing Bullish patterns: Designation of bullish patterns Pattern name HMR
Hammer pattern
STR(M) Morning Star DJ(M) Morning Doji Star PRL Piercing Line BEP Bulli
Using Standard Deviation but not sure if the Standard Deviation is high or low?
eRSD or Easy Relative Standard Deviation comes to your help. Using this you can get a ratio of Standard Deviation to Moving Average and make a good judgement about whether the Standard Deviation is useful or not.
Just add it to the chart and use it away - it supports all periods and moving average calculation methods through the input parameters.

The "No repaint" indicator is designed for analyzing market dynamics and determining potential trading signal moments. The main feature of this indicator is the absence of signal repainting, which contributes to more accurate and reliable forecasting of price movements in the market.
Mechanism of Operation: The "No repaint" indicator uses several types of graphical elements to indicate trading signals: Up and Down Arrows: The indicator marks possible market entry points with up and down arrow

Hello Dear Trader, Today Im Telling You About The "Golden Scalp System V1 " Metatrader4 Golden Scalp System
Scalper with EMA This is a Scalper strategy based on ( Exponential moving average) EMA . Time frame: H1 Pair: EUR/USD, GBP/USD,AUD/USD XAU/USD
Platform Mt4 Indicators for Scalper with Ema: 300 EMA (Exponential Moving Average) ; 500 EMA (Expontial Moving Average); Stochastic (5,3,3) Long Entry
1) 300 EMA > 500 EMA .
2) Find significant levels of support.
3) Wait for

Introducing the POWER TRADE indicator created by a small group of traders with a few years trading trading the financial market profitably . This is a plug and play indicator that provides you with POWERFUL Entry signals with Profit Taking and rebound zones. The indicator Works with all MT4 trading instruments. The indicator uses previous chart data as receipt to speculate on future market moves.
The Power signals occurs on all timeframes. Though the signals occur more often on smaller tim
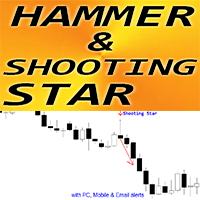
MT4용 외환 지표 "해머 및 슈팅 스타 패턴"
지표 "해머 및 슈팅 스타 패턴"은 가격 행동 거래에 대한 매우 강력한 지표입니다. 다시 칠하지 않고 지연도 없습니다. 표시기는 차트에서 강세 망치 패턴과 약세 슈팅 스타 패턴을 감지합니다. Bullish Hammer - 차트의 파란색 화살표 신호(그림 참조) Bearish Shooting Star - 차트의 빨간색 화살표 신호(사진 참조) PC, 모바일 및 이메일 알림이 포함되어 있습니다. 표시기 "해머 및 슈팅 스타 패턴"은 지원/저항 수준과 결합하는 데 탁월합니다: https://www.mql5.com/en/market/product/100903
// 더 훌륭한 전문가 자문 및 지표는 여기에서 확인할 수 있습니다: https://www.mql5.com/en/users/def1380/seller // 또한 수익성 있고 안정적이며 신뢰할 수 있는 신호 https://www.mql5.com/en/signals/1887493에

**"Support and Resistance Breakout" Indicator for MetaTrader 4 (MT4)**
Hello traders and investors on the MetaTrader 4 (MT4) platform,
We are excited to introduce to you the "Support and Resistance Breakout" indicator - a powerful tool designed for MT4 that helps you capitalize on trading opportunities involving support and resistance breakouts effectively and confidently.
**Overview:**
The "Support and Resistance Breakout" indicator is a custom tool built on the MetaTrader 4 platform,

Welcome to the "Keltner Amplified Breakout" Indicator Are you searching for a powerful and effective trading tool on the MT4 platform? Let us introduce you to the "Keltner Amplified Breakout" Indicator. Designed to help you capture potential trading opportunities, this indicator offers the perfect blend of high performance and user-friendliness. Key Advantages: Identify Strong Trends: This indicator utilizes Keltner channels and fractal signals to identify robust upward or downward trends in
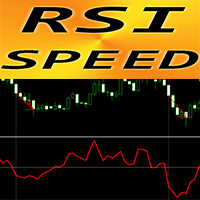
MT4용 외환 지표 "RSI SPEED" - 훌륭한 예측 도구입니다!
이 지표의 계산은 물리학의 방정식을 기반으로 합니다. RSI SPEED는 RSI 자체의 첫 번째 파생물입니다. RSI SPEED는 주요 추세 방향으로 진입하는 데 좋습니다. 예를 들어 HTF MA(그림 참조)와 같은 적합한 추세 표시기와 함께 사용하십시오. RSI SPEED 표시기는 RSI 자체가 방향을 얼마나 빨리 바꾸는지 보여줍니다. 이는 매우 민감합니다. RSI SPEED 지표의 값이 < 0인 경우 모멘텀 거래 전략에 RSI SPEED 지표를 사용하는 것이 좋습니다. 가격 모멘텀이 하락합니다. RSI SPEED 지표의 값이 0보다 큰 경우: 가격 모멘텀이 상승합니다. 표시기에는 모바일 및 PC 알림이 내장되어 있습니다.
// 더 훌륭한 전문가 자문 및 지표는 여기에서 확인할 수 있습니다: https://www.mql5.com/en/users/def1380/seller // 또한 수익성 있고 안정적이며

This is a combination of multiple oscillators into a single divergence system that creates the impression of a more reliable divergence indicator. It is multi-currency based and works best on 15 minutes timeframe and above. Every time a signal is generated, it shows an alert to the user. It is more ideal if combined with other price action indicators or trading systems.

Hidden Gap by MMD Hidden Gap by MMD is a unique indicator that detects hidden gaps between three consecutive candles. This observation isn't my own, but in the MMD methodology, it has its application alongside other original indicators. You can apply this indicator to the chart multiple times and set the interval from which you want to see the hidden gaps. You can show or hide these gaps as needed. For example, you can view the chart at an M5 interval and see hidden gaps from an M15 chart, etc.

안녕하세요,
MetaTrader 4 (MT4) 플랫폼에서 금융 시장에서 수익을 창출하는 최적의 솔루션을 찾고 계신가요? "Sonic R Non Repaint Smart"를 소개합니다 - 정확성과 효율성을 트레이더에게 제공하는 스마트한 거래 시스템입니다.
"Sonic R Non Repaint Smart" 소개:
"Sonic R Non Repaint Smart"는 높이 평가받는 Sonic R 거래 전략을 기반으로 한 견고한 거래 지표입니다. 우리는 시장 트렌드를 정확하게 식별하는 데 도움을 주는데 그치지 않고 거래 과정을 자동화하는 솔루션을 자랑스럽게 제공합니다.
주요 기능:
재페인 없음, 높은 정확도: "Sonic R Non Repaint Smart"를 사용하면 결코 변경되지 않는 정확한 거래 신호를 받게 됩니다. 이로써 거래 결정에 대한 신뢰감을 높일 수 있습니다.
자동 거래: 시스템은 자동으로 시장을 분석하고 Sonic R 전략을 기반으로 매수 및 매도 신호

MOST 지표는 다른 플랫폼, 특히 주식 및 지수에 사용되는 매우 인기 있는 지표입니다. 기본은 이동 평균과 고저 수준입니다. 주식과 지수의 경우 백분율 입력을 2로 사용하고 외환 상품의 경우 1 - 1.5로 사용하는 것이 적절할 수 있습니다. 각 악기에 대해 직접 조정할 수 있습니다. 사용하기 쉽고 간단하며 단순한 표시기입니다. 1시간 및 일일 차트에서 더 일반적입니다. 지금은 MT4 플랫폼에 대해서만 편집했는데, 앞으로 MT5에 대한 요청이 있으면 게시하겠습니다. MOST 지표는 다른 플랫폼, 특히 주식 및 지수에 사용되는 매우 인기 있는 지표입니다. 기본은 이동 평균과 고저 수준입니다. 주식과 지수의 경우 백분율 입력을 2로 사용하고 외환 상품의 경우 1 - 1.5로 사용하는 것이 적절할 수 있습니다. 각 악기에 대해 직접 조정할 수 있습니다. 사용하기 쉽고 간단하며 단순한 표시기입니다. 1시간 및 일일 차트에서 더 일반적입니다. 지금은 MT4 플랫폼에 대해서만 편집했는데, 앞
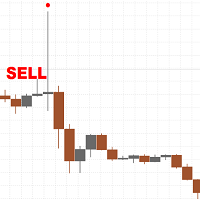
There are only a limited number of copies left, priced at 390 USD . After that, the price will be raised to 450 USD. I develop honest Indicators and know what can work in the market in the long term and what cannot. The classic and most powerful price action pattern is called the pin bar. This pattern works well after the release of fundamental news on M15, M30 and H1 timeframes, but can also be used on other timeframes such as M5 or D1. By default, the settings are set for the H1 timeframe,

Hey traders, it's easy for you to find when to buy or sell signals. Can be used for all forex pairs including gold. How to use this indicator on the M30 or H1 timeframe, for a buy signal, wait until an up arrow appears and for a sell signal, wait for a down arrow, place a stop loss 5-10 points below the arrow. Better trading time on the London and New York sessions and avoid trading when there is news. Happy Trading
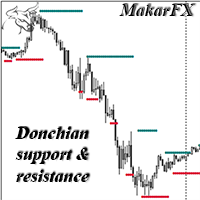
Support and resistance level indicator based on the Donchian channel. The most famous example of trading through the Donchian channel is an experiment with a group of turtles, who earned one hundred and twenty-five million dollars in five years. This indicator can be used as a standalone tool, as well as an additional confirmation. There is MTF, NRP. There are color and thickness settings.

This is a dashboard indicator that displays the auto-calculated risk lot, with the given risk percentage & risk points (Stop Loss) and others. The main function of this indicator is to help you calculate your exact scalping risk lots and swing risk lots. Also it displays the active trades of each pair you've executed with the following: type of trade, lot size, symbol, & equity(+/-). Also displays the bar counter set in every 5-minute bar timer. (whichever time frame you're active, the bar time

Простой и удобный индикатор, указывающий зоны стандартных индикаторов в различных таймфреймах, при необходимости можете в настройках изменить параметры RSI- Relative strength index. Стрелка вверх- если сигнальная линия ниже уровня 300, стрелка вниз- если сигнальная линия выше уровня 70 STOCH- Stochastic. Стрелка вверх- если сигнальная линия ниже уровня 20, стрелка вниз- если сигнальная линия выше уровня 80 ENVELOPE - Envelopes. Стрелка вверх- если свеча открылась ниже красной линии индика

This indicator shows when user set sessions are active and returns various tools + metrics using the closing price within active sessions as an input. Users have the option to change up to 4 session times.
The indicator will increasingly lack accuracy when the chart timeframe is higher than 1 hour.
Settings
Sessions
Enable Session: Allows to enable or disable all associated elements with a specific user set session.
Session Time: Opening and closing times of the user set session
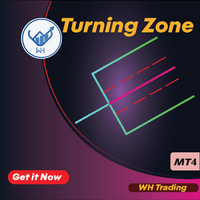
소개:
"Turning Zone"은 거래자에게 금융 시장 내에서 잠재적인 추세 반전을 감지할 수 있는 강력한 도구를 제공하도록 설계된 정교하고 혁신적인 MT4 지표입니다. 시대를 초월한 갈퀴 분석 개념을 활용함으로써 Turning Zone 지표는 시장 정서가 바뀔 가능성이 있는 주요 반전 영역을 식별하여 거래자에게 정보에 입각한 결정을 내릴 수 있는 귀중한 통찰력을 제공합니다. MT5 버전 : WH Turning Zone MT5
관련상품 : WH Trend Continuation MT4
주요 특징들:
갈퀴 분석. 반전 확률. 시각적 선명도. 사용자 지정 옵션. 실시간 알림.
사용하는 방법 :
옵션 1: 가격이 터닝 존에 도달할 때까지 기다렸다가 존 위/아래에서 고유한 진입 규칙, 정류장 및 타겟을 사용합니다.
옵션 2: 내 진입 규칙이 형성될 때까지 기다리십시오(빨간색/파란색 화살표로 표시). 중지되고 대상이 차트에 나타납니다.
정확한 추세

This is a dashboard indicator that displays the Average Level of each selected currency pairs that filters and gives us a signal for overbought (>=90%) or if price at extreme peak above 90, and/or oversold (<=10%) or if price at extreme peak below 10.
The calculation is using Relative Strength Index default periods (2 & 9) applied to three different higher time frames H4,D1,&W1.
This won't change or altered even if you change symbol or switch to lower time frames or even in monthly and y

The Donchian Scanner Signals Indicator with is a powerful tool designed for traders operating in the financial market using the Metatrader 4 platform. This indicator combines the popular Donchian Channels strategy with advanced signalization and real-time alert features, providing a clear view of potential entry and exit points in a financial asset. Key Features: Donchian Channels Visualization: The indicator graphically displays Donchian Channels on the price chart. These channels are formed us
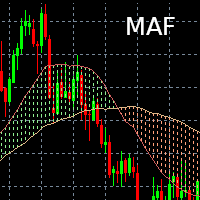
Indicateur Moving Average Filling Affiche deux moyennes mobiles (une courte et une longue) dont la durée et le type (Simple, exponentielle) est paramétrable. L'espace entre les deux moyennes mobiles est alors colorié (rempli) :
- Vert si courte > longue
- Rouge si courte < longue Il est possible de changer les couleurs selon les préférences de chacun / chacune.
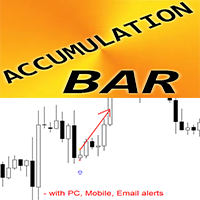
MT4에 대한 외환 표시 누적 막대 패턴
지표 "누적 막대"는 가격 조치 거래를 위한 매우 강력한 브레이크아웃 중심 지표입니다. 표시기는 1바 동안 좁은 영역의 가격 축적을 감지하고 브레이크아웃 방향, 보류 주문 및 SL 위치를 표시합니다. Bullish Accumulation Bar - 차트의 파란색 화살표 신호(그림 참조) Bearish Accumulation Bar - 차트의 빨간색 화살표 신호(그림 참조) 다시 칠하지 마세요. 지연 없음; 높은 R/R 비율(보상/위험) 표시기에는 조정 가능한 감도 매개변수가 있습니다. PC, 모바일 및 이메일 알림이 포함되어 있습니다. 표시기 "축적 막대 패턴"은 지지/저항 수준과 결합하는 것이 좋습니다: https://www.mql5.com/en/market/product/100903
// 더 훌륭한 전문가 자문 및 지표는 여기에서 확인할 수 있습니다: https://www.mql5.com/en/users/def1380/seller

**MT4용 브레이크아웃 박스 지표 - 효율적인 거래 기회 발견하기**
안녕하세요, 소중한 트레이더 여러분,
저희는 KPRO에서 개발한 강력하고 정확한 거래 도구인 브레이크아웃 박스 지표 버전 2.0을 여러분께 소개해드립니다. 이는 외환 시장에서 거래 기회를 포착하고 수익을 극대화하면서도 위험을 최소화하는 데 도움이 되는 가치 있는 자산입니다.
**주요 특징:**
1. **효율적인 브레이크아웃 거래:** 브레이크아웃 박스 지표는 특정 차트의 중요한 브레이크아웃 포인트를 식별하기 위해 특별히 설계되었습니다. 이를 통해 강한 가격 움직임을 포착하고 최상의 거래 기회를 활용할 수 있습니다.
2. **재그림 없는 신호:** 이 지표의 독특한 특징 중 하나는 재그림 없는 신호 능력입니다. 이는 지표가 제공하는 매수 및 매도 신호에 의존할 수 있도록하여 거래 결정에 신뢰할 수 있는 기반이 마련됩니다.
3. **멀티 타임프레임 (MTF) 및 EMA 통합:** 다양한 타임프
Please feel free to contact me if you need any further information.
Please let me know if you have any questions.
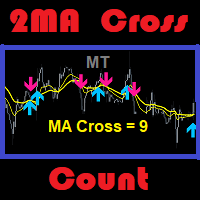
I hope the above is useful to you. MT 2ma Cross Count : is a moving average with 2 lines crossing but the strategy is to focus on the desired number of history bars and count signals that occur. Suitable for traders specialize in martingale strategy or traders specialize in technical ... etc. Traders with the ability to do fundamental analysis have an advantage. Because it will ma
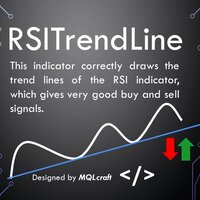
RSI Trend Lines Indicator - Identify Optimal Buying and Selling Opportunities Introduction :
The RSI Trend Lines Indicator is a powerful tool designed to assist traders in identifying optimal buying and selling opportunities based on the Relative Strength Index (RSI) oscillator. This advanced indicator draws trend lines on the RSI chart using multiple points, providing valuable insights into potential market trends and reversals. By leveraging the RSI Trend Lines Indicator, traders can enhance

Advanced SR 인디케이터를 소개합니다. 차트에서 가장 중요한 키 레벨을 식별하는 데 도움이 되는 인디케이터입니다.
귀하의 고민:
중요한 가격 영역을 어떻게 표시해야 할지 모릅니다. 공급 및 수요 구역 또는 지지 및 저항 수준을 다른 99%의 트레이더처럼 그립니다. 그린 공급 및 수요, 지지 및 저항 구역이 효과가 없다고 생각합니다. 진입 및 청산 포인트의 안전성에 대해 확신하지 못합니다. Advanced SR은 모든 이러한 문제를 해결합니다. 거래량을 활용하여 주요 키 레벨과 시장의 주요 참여자들이 중요한 거래를 하는 핵심 가격 영역을 결정하는 알고리즘을 사용하여 중요한 가격 영역을 신속하게 식별할 수 있습니다. 이러한 키 레벨에만 의존하여 여러분만의 거래 전략을 손쉽게 구축할 수 있습니다.
***인디케이터를 구매하고 80%의 스켈핑 전략을 무료로 받으세요. 개인 메시지를 통해 저에게 연락하세요!***
Advanced SR 인디케이터는 가격이 키 레벨에 가까워

Perfect for one minutes high trading and scalping. This indicator is very effective for trading on one minutes, in the hour. A combination of moving averages and STOCHASTICS calculation to produce a very convincing signal every hour. Blue colour signals a buy opportunity. Follow the X signs for possible buy points. The Blue average line serves as possible trend direction and support. Red colour signals a sell opportunity. Follow the X signs for possible sell points. The Red average line serves a
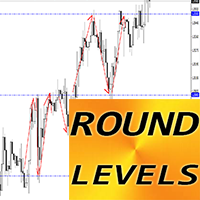
MT4용 외환 지표 "라운드 레벨"
지표 "라운드 레벨"에는 지지/저항을 고려하는 트레이더를 위한 보조 지표가 있어야 합니다. 라운드 수준은 가격에 의해 매우 존중됩니다. 가격은 라운드 수준에서 매우 자주 반등합니다. H4, D1 시간 프레임에는 1000포인트 단계 사용 H1 이하 기간에는 500포인트 단계를 사용합니다(일중 거래의 경우). 또한 라운드 레벨은 테이크 프로핏(라운드 레벨 앞)과 SL(라운드 레벨 뒤)을 할당하는 것이 좋습니다. 이 수준은 특히 가격이 횡보하고 평탄한 동안 매우 강합니다.
// 더 훌륭한 전문가 자문 및 지표는 여기에서 확인할 수 있습니다: https://www.mql5.com/en/users/def1380/seller // 또한 수익성 있고 안정적이며 신뢰할 수 있는 신호 https://www.mql5.com/en/signals/1887493에 참여하실 수 있습니다. 본 MQL5 홈페이지에서만 제공되는 오리지널 제품입니다.

Welcome to the world of advanced trading with the FxBears Super Trading Indicator. Designed exclusively for the MT4 platform, this innovative tool combines the power of Elliott Waves, supply and demand zones, and internal indicators to provide traders with high-quality signals for informed trading decisions. With a track record of over 90% success rate, FxBears Super brings a new level of precision and profitability to your trading strategy. Of Corse No Repaint and No Redraw .
Elliott Wav

"이 인디케이터는 바이스트라 패턴 이론을 기반으로 한 입장을 감지하고 목표 및 중지 레벨을 갖춘 한정 주문을 놓을 수 있는 입장 가치를 제공합니다. 이를 통해 리스크 비율을 계산할 수 있습니다. 참고: 이 인디케이터에는 EA에서 사용할 수 있는 버퍼가 있습니다. 이 제품을 사용하는 동안 좋은 자금 관리를 실천하는 것이 중요합니다. 시간 프레임을 변경할 때, 인디케이터는 마지막 세션에서 사용한 템플릿을 저장합니다. 이 방법을 배우려면 구매 후 저희에게 연락하고 리뷰를 추가해주시기 바랍니다. 매개변수: 시스템 비주얼 사용 - 이 제품의 비주얼 테마를 활성화/비활성화합니다. 속도 관련 - 마지막 웨이브의 빠른 움직임 중에만 패턴을 감지하도록 활성화/비활성화합니다. 마지막 양식 카운터 표시 - 양식 타이머를 활성화/비활성화합니다. 양식 카운터 색상 - 양식 타이머 텍스트의 색상입니다. 상승 패턴 색상 - 상승 패턴의 색상입니다. 하락 패턴 색상 - 하락 패턴의 색상입니다. 알림 보내기 -

Market Profile Heat indicator — is a classic Market Profile implementation that can show the price density over time, outlining the most important price levels, value area, and control value of a given trading session.
This indicator can be attached to timeframes between M1 and D1 and will show the Market Profile for daily, weekly, monthly, or even intraday sessions. Lower timeframes offer higher precision. Higher timeframes are recommended for better visibility. It is also possible to use a f
Introducing the "Zone of Supply and Demand Pro" Indicator - Redefining Precision with Multi-Time Frame (MTF) Technology and Non-Repaint Capability
In the intricate world of financial markets, understanding supply and demand can be the key to success. We are excited to present the "Zone of Supply and Demand Pro" - a powerful analytical tool designed not only to help you seize trading opportunities but also to ensure unparalleled accuracy through groundbreaking technology.
**The Significance

Rapid Trend is a technical analysis indicator that determines the direction and strength of a trend, and also signals a trend change. Allows you to determine the current trend. With the help of its algorithm, you can quickly understand what kind of trend is currently developing in the market. Rapid Trend can be used along with oscillators as filters. Setting up the Rapid Trend forex indicator allows you to receive more accurate signals for opening positions. Uses only one parameter for settings.

"Fibo Star" 지표는 별 모양으로 피보나치 팬을 차트에 표시하는 데 사용됩니다. 이 피보나치 팬은 가격 움직임을 분석하는 강력한 도구로, 잠재적인 지지 및 저항 레벨에 대한 통찰력을 제공할 수 있습니다. 이 지표는 그리기 및 설정 과정을 간편화하기 위한 사용자 친화적인 제어판을 제공하여 시간과 노력을 절약할 수 있도록 돕습니다. 사용 방법: 이 지표는 수동 사용을 위한 것입니다. 효과적으로 사용하려면 다음 단계를 따르세요: 피보나치 팬을 기반으로 할 고점과 저점을 차트에서 식별합니다. 이러한 고점과 저점에 보라색 선을 그립니다. 가격이 이러한 선과 상호 작용하면, 이 지표가 동적인 지지 및 저항 레벨로 작동하는 것을 관찰하세요. 매개변수: Use_System_Theme: 이 매개변수를 사용하여 지표의 외관을 거래 플랫폼의 전반적인 테마에 맞출지 또는 사용자 정의할지 선택할 수 있습니다. Levels_Color: 피보나치 팬의 레벨에 적용할 색상을 선택합니다. Levels_S

"통화 강도 인디케이터"는 외환 시장에서 서로 다른 통화의 상대적인 강도에 관한 정보를 제공하기 위해 개발된 강력한 도구입니다. 각 통화의 강도를 해당 시간 프레임을 기반으로 계산하고 표시함으로써 이 인디케이터는 특히 유의미한 발산이나 교차가 관찰될 때 잠재적인 거래 기회를 식별하는 기회를 제공합니다. 인디케이터의 주요 특징: 1. 통화 강도 계산: 이 인디케이터는 각 통화의 강도를 해당 시간 프레임을 기반으로 계산합니다. 이 계산에는 지정된 기간 동안 한 통화가 다른 통화들의 바구니에 대한 성과를 평가하는 과정이 포함됩니다. 이를 통해 트레이더는 각 통화의 상대적인 강도 또는 약함을 이해할 수 있습니다. 2. 수축과 발산: 두 통화의 강도 간에 수축 또는 발산 움직임이 있는 경우, 이는 잠재적인 거래 기회를 나타낼 수 있습니다. 예를 들어 한 통화가 상대적으로 강화되는 동안 다른 통화가 약화되는 경우, 가능한 진입 지점을 나타낼 수 있습니다. 3. 제로 레벨 교차: 이 인디케이터는

간 스퀘어 지표는 W.D. 간이 쓴 "시장 예측을 위한 수학적 공식" 기사에 기반한 강력한 시장 분석 도구입니다. 이 도구는 수학적 개념과 간 이론을 사용하여 정확한 시장 분석을 수행합니다. 144, 90, 52의 제곱과 9의 제곱을 사용합니다. 또한 의 9의 제곱근 및 해당 제곱의 채널 및 스타 패턴과의 관련성을 통합합니다. 사용자 메뉴얼 및 적용: 이 지표를 사용하기 전에 사용자 메뉴얼을 읽고 질문이 있을 경우 문의하시기 바랍니다. 전체 메뉴얼은 웹사이트에서 제공됩니다. MT5의 전체 버전을 구매하거나 MT4의 무료 버전을 테스트할 수 있습니다. 두 버전 모두 링크에서 확인하실 수 있습니다. 주요 기능 및 기능: 간 스퀘어 지표는 정확한 결정을 위해 기하학적 개념과 간 이론을 활용하는 시장 분석을 위한 포괄적인 도구 집합을 제공합니다. 주요 기능은 다음과 같습니다. 9의 제곱 분석: 이 지표는 9의 제곱에 대한 수평 선, 스타 패턴, 그리드 및 간 팬을 그릴 수 있습니다. 간 이

이 인디케이터는 수동 및 자동 방법으로 차트에 그려진 조화 패턴을 감지합니다. 사용 후기를 추가하십시오. 참고 사항: 이 인디케이터에는 제어 패널이 있으며 모든 (차트 및 시간대) 설정을 저장합니다. 더 많은 공간을 확보하려면 최소화할 수 있으며 다른 분석 도구와 함께 작업하려면 모든 인디케이터 데이터를 숨기려면 닫기 버튼을 누를 수 있습니다. 이 인디케이터를 사용하고 설정을 변경하면 이동평균이나 볼린저 밴드와 같은 인디케이터를 추가할 때 편집 내용의 템플릿을 자동으로 저장하고 필요할 때 언제든지 로드할 수 있습니다. Windows 10을 사용하는 경우 MetaTrader 아이콘을 마우스 오른쪽 단추로 클릭한 다음 호환성 > 고DPI 설정 변경 > 시스템(개선)을 선택하여 최상의 화면 설정을 사용할 수 있습니다(HD 기기에서 수행되어야 함). 이 인디케이터는 본질적으로 차트에서 조화 거래 이론을 해석하는 것으로 조화 패턴을 감지합니다. 배우고 싶다면 Scott Carney의 "Har

The Wamek Support and Resistant (WSR) Indicator is a remarkable tool that stands out in the world of technical analysis. It sets itself apart by cleverly combining price action and leading indicators to delineate support and resistance levels with a high degree of accuracy. Its unique feature is its adaptability; users can fine-tune the indicator by adjusting input parameters, enabling them to create customized support and resistance levels that suit their trading strategies. Notably, one of WSR

강력한 가격 행동 패턴을 감지하는 기술적 지표: 핀바, 인사이드 바, 아웃사이드 바 소개: 기술적 분석 분야에서 가격 행동 패턴은 잠재적인 시장 움직임의 중요한 지표로 기능합니다. 우리는 차트상의 견고한 가격 행동 패턴을 식별하는 데 도움을 주는 정교한 기술적 지표를 개발했습니다. 우리의 지표는 핀바, 인사이드 바, 아웃사이드 바라는 세 가지 중요한 패턴을 감지하는 데 특화되어 있습니다. 주요 감지 패턴: 핀바: 핀바 패턴은 시장 트렌드의 잠재적인 반전을 나타내는 단일 양초 형성입니다. 작은 몸체와 몸체 위나 아래로 튀어나온 긴 꼬리 또는 "위크"로 특징지어집니다. 상승 핀바는 가능한 상승 반전을 시사하며, 하락 핀바는 하락 반전을 시사합니다. 인사이드 바: 인사이드 바 패턴은 단일 양초의 전체 가격 범위가 이전 양초의 가격 범위 내에 들어가는 경우 발생합니다. 이 패턴은 임시적인 증시 합리화나 불확실성을 나타내며 종종 양방향으로의 돌파를 앞서는 신호로 작용합니다. 아웃사이드 바:

메타트레이더용 숫자로 이루어진 지지와 저항 인디케이터 소개: 메타트레이더용 숫자로 이루어진 지지와 저항 인디케이터로 기술적 분석의 새로운 차원을 경험해보세요. 이 독특한 도구는 숫자학의 힘을 활용하여 차트 상에서 주요 지지와 저항 레벨을 식별하여 가능한 가격 움직임에 대한 가치 있는 통찰력을 제공합니다. 주요 개념: 트레이딩에서의 숫자학: 숫자학은 숫자와 그들의 의미를 미스틱하게 연구하는 것으로, 트레이딩에 숫자학 원리를 적용하면 특정한 의미를 가진 숫자를 식별하고 이를 사용하여 매수 또는 매도 활동이 발생할 가능성이 있는 가격 레벨을 예측하는 것을 의미합니다. 인디케이터 기능: 우리의 인디케이터는 숫자학의 숨겨진 패턴을 활용하여 차트 상에 지지와 저항 레벨을 그립니다. 이러한 레벨은 금융 시장에서 중요한 의미를 가진 주요 숫자학 숫자에서 파생됩니다. 학습을 위한 선호되는 단계: 숫자학 이해: 인디케이터를 사용하기 전에 숫자학의 기본 개념과 트레이딩에서의 중요성을 이해하는 시간을 가

**신제품 출시: 오더 블록 프로 - MT4 거래의 비밀 무기!**
금융 시장에서 당신의 잠재력을 최대한 발휘할 수 있는 새로운 거래 도구를 찾고 계신가요? 그렇다면, 저희가 자랑스럽게 소개하는 것은 "오더 블록 프로"입니다. 이 강력한 도구는 다양한 기능을 제공할 뿐만 아니라 기존의 지표 제약을 극복합니다.
**오더 블록 프로의 주요 기능**
**1. 정확한 진입 신호:** 차트와 상호작용할 때, 오더 블록 프로는 단순히 진입 화살표를 보여주는데 그치지 않습니다. 이러한 화살표가 "리페인트"되지 않도록 보장하여 불확실성을 제거하고 독특한 진입 신호를 제공합니다.
**2. 적시에 발생하는 알림:** 오더 블록 프로는 중요한 주문 블록 지역을 식별하는데 그치지 않고, 가격이 이러한 지역에 접근했을 때 알림을 발생시키는 기능도 제공합니다. 이로써 신속하고 정확한 거래 기회를 포착할 수 있습니다.
**3. 유연하고 맞춤 설정 가능:** 오더 블록 프로는 선호에 맞게 맞

Binary Lines is a technical analysis indicator for currencies, commodities, cryptocurrencies, stocks, indices and any financial instruments. Can be used for binary options or Forex scalping. Shows entry and exit points at fixed intervals and provides traders the necessary information about the results of possible transactions. Entry points are formed at the very beginning of the candle, in the direction of the MA line, duration
trades in bars can be adjusted manually and adjusted to any financi

**TrendLine ProX - The Ultimate Non-Repaint Indicator for MT4 Trading**
**Product Introduction:** We are delighted to introduce TrendLine ProX - an optimized and reliable trading tool for the MT4 platform. With its accurate trend detection and non-repainting feature, TrendLine ProX will be your trustworthy companion to support intelligent trading decisions.
**The Power of TrendLine ProX:** TrendLine ProX is more than just a trading tool; it is a harmonious blend of technology and market ana

---- Brand New Strategy. Three Month Rent is $30. ONE YEAR RENT ONLY $50. FREE EURUSD VERSION AVAILABLE UNDER << Forecast System Gift >>. NO NEED FOR BACKTEST! Link to the FREE version --> https://www.mql5.com/en/market/product/110085?source=Site --- This is a simple strategy based on BREAKOUT and FIBONACCI levels. After a breakout, either, the market: - continues the move directly to the 161, 261 and 423 levels, or - retraces to the 50% level (also called a correction) and thereafter continues

The liquidity swings indicator highlights swing areas with existent trading activity. The number of times price revisited a swing area is highlighted by a zone delimiting the swing areas. Additionally, the accumulated volume within swing areas is highlighted by labels on the chart. An option to filter out swing areas with volume/counts not reaching a user-set threshold is also included.
This indicator by its very nature is not real-time and is meant for descriptive analysis alongside other c
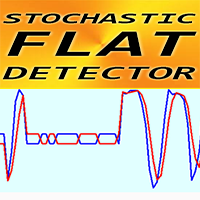
STOCHASTIC FLAT Detector - 효율적인 거래 보조 도구입니다! MT4에 대한 이 훌륭한 지표로 귀하의 거래 방법을 업그레이드할 것을 제안합니다.
표시기는 차트의 가격 평평한 영역을 보여줍니다. 여기에는 "Flat" 매개변수가 있습니다. 이는 평탄한 감지 감도를 담당합니다. STOCHASTIC FLAT Detector는 가격 조치 항목 확인, 발산 또는 과매도/과매수 신호에 사용할 수 있습니다. 추세 추종 시스템에 이를 사용하여 플랫을 감지하고 그곳에서 거래를 피할 수 있습니다. 반전 스캘핑(플랫 보더의 반전 거래)에 사용할 수 있습니다. 표준 Stochastic 대신 STOCHASTIC FLAT Detector를 사용할 수 있는 기회가 많이 있습니다.
// 더 훌륭한 전문가 자문 및 지표는 여기에서 확인할 수 있습니다: https://www.mql5.com/en/users/def1380/seller // 또한 수익성 있고 안정적이며 신뢰할 수 있는 신호 h

This indicator is based on the classical indicator Stochastic and will be helpful for those who love and know how to use not a visual but digital representation of the indicator. All TimeFrames RSI MT4 indicator shows values from each timeframe. You will be able to change the main input parameters for each RSI for every TF. Example for M1: sTF1_____ = "M1"; kPeriod1 = 5; dPeriod1 = 3; Slowing1 = 3; stMethod1 = MODE_SMA; Price_Field1 = MODE_MAIN; stMode1 = 0;
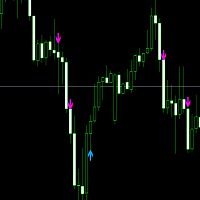
This offer is limited to a temporary period. Entry signal :follow the blue arrow for a buy trade and the Pink for a sell. Buy Trade: When the blue arrow appears, you wait until the candle completely finishes. Then you enter into a Buy Trade as soon as the next candle appears. Now wait until you hit TP1 from the Buy Goals box, then close the trade with a profit. Sell Trade: When the Pink arrow appears, you wait until the candle completely finishes Then you enter into a Buy Trade as soon as the

Drop Trend is a trend indicator for the MetaTrader 4 trading platform. This indicator allows you to find the most probable trend reversal points. You will not find this indicator anywhere else. A simple but effective system for determining the forex trend. From the screenshots you can see for yourself the accuracy of this tool. Works on all currency pairs, stocks, raw materials, cryptocurrencies.
Are you tired of the constant ups and downs? Do not become a victim of unstable market movements,
MetaTrader 플랫폼 어플리케이션 스토어에서 MetaTrader 마켓에서 트레이딩 로봇을 구매하는 방법에 대해 알아 보십시오.
MQL5.community 결제 시스템은 페이팔, 은행 카드 및 인기 결제 시스템을 통한 거래를 지원합니다. 더 나은 고객 경험을 위해 구입하시기 전에 거래 로봇을 테스트하시는 것을 권장합니다.
트레이딩 기회를 놓치고 있어요:
- 무료 트레이딩 앱
- 복사용 8,000 이상의 시그널
- 금융 시장 개척을 위한 경제 뉴스
등록
로그인
계정이 없으시면, 가입하십시오
MQL5.com 웹사이트에 로그인을 하기 위해 쿠키를 허용하십시오.
브라우저에서 필요한 설정을 활성화하시지 않으면, 로그인할 수 없습니다.