Guarda i video tutorial del Market su YouTube
Come acquistare un Robot di Trading o un indicatore
Esegui il tuo EA
hosting virtuale
hosting virtuale
Prova un indicatore/robot di trading prima di acquistarlo
Vuoi guadagnare nel Market?
Come presentare un prodotto per venderlo con successo
Indicatori tecnici a pagamento per MetaTrader 4 - 99

KT DMA is a modified and advanced version of the classic Displaced Moving Averages with buy/sell crossover alerts and a Multi-Timeframe scanner that shows DMA's direction across each real-time time frame. A Displaced Moving Average is a simple moving average that moves ahead or backward in a time frame (either short-term or long-term). It also allows you to predict price movement more accurately.
Features Depicts the trend direction using the alignment of three moving averages. Buy/Sell signa
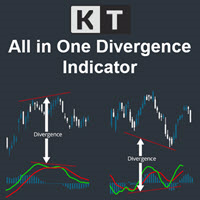
The KT All-In-One Divergence is designed to identify regular and hidden divergences between the price and 11 widely recognized oscillators. This powerful tool is indispensable for swiftly and accurately spotting market reversals. Its a must-have tool in any trader's arsenal, providing clear and accurate divergence patterns. Its accuracy and speed in identifying market reversals are remarkable, allowing traders to seize profitable opportunities confidently.
Features No Interference: You can a

indicator CE and RF Buy-Sell Chandelier Exit and Range Filter Buy Sell
It is the ultimate indicator for telling entry points or entering trades with high accuracy.
Trades must be short term trading only or Scalping only, not suitable for holding positions across several days.
Suitable for beginner traders and professional traders.
Easy Operation 1. Import Indicator, CE and RF into MT4 chart. 2. Waiting for the signal from the arrow pointing up means recommending a long position. and an
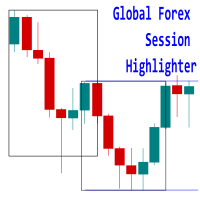
Introducing the 'Global Forex Session Highlighter' , a powerful tool designed to enhance your trading strategy by providing a visual representation of the Three major Forex trading sessions: Tokyo, London, and New York. This indicator is designed to help traders understand the dynamics of the global Forex market by highlighting the trading sessions directly on your MT4 chart. It provides a clear view of when each session starts and ends, allowing you to strategize your trades around the most
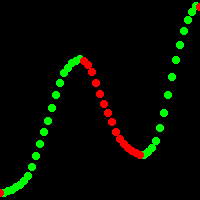
Doesn't redraw!
"Xhmaster formula forex indicator" - a new oscillator indicator with regression mathematical modeling of free numerical series. This indicator is 60% more accurate in identifying price reversal points compared to the standard "Xmaster formula" indicator, and it is less sensitive to small price fluctuations. "Xhmaster formula forex indicator" is a unique and advanced tool designed specifically for traders in the Forex market. It provides traders with excellent opportunities for s

However, the difficult task here for traders is to understand and select the indicator or tool that can help them with their trading plan and benefit their trading style. Traders want a tool that requires minimal effort and provides as much support as it can.
There are multiple reasons for which traders need an indicator. One such reason is to determine the buy-sell signals in the market. The King Binary Forex Scalping Indicator is a tool that can help traders get answers to many question
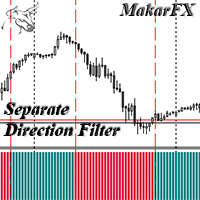
The indicator shows the Buy/Sell direction. The calculations use the opening prices and their rate of change for the billing period - "Calculation period" MTF indicator - "Calculation timeframe", no repaint - NRP. Two display types: "Simple histogram" or "Histogram level crossing" Alerts available: "Chart message", "Push message", "Email message" Two types of signals: "Change direction" or "Crossing level" Level settings: "Crossing UP level" and "Crossing DN level" Color settings. For EA: iCusto

TrendStoch Channel Pro
Introducing our revolutionary indicator - "TrendStoch Channel Pro"! This powerful tool empowers traders to gain a comprehensive view of the market by seamlessly combining two essential features - observing larger time trends and the stochastic channel - directly on your chart.
With "TrendStoch Channel Pro," you'll experience a new level of trading precision. The indicator's ability to display larger time trends allows you to identify long-term market directions, enabli

In Forex trading, understanding support and resistance is crucial. Virtually every trading strategy incorporates these levels.
MetaTrader lacks built-in support and resistance calculation features, but there's a solution— the Support and Resistance Lines indicator.
This powerful MetaTrader indicator automatically calculates and displays support and resistance levels for any chosen currency pair or trading instrument.
Benefits of the Support and Resistance Lines indicator:
1. Identify be
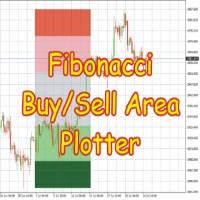
This Indicator is based on Fibonacci levels and draws Buy & Sell Areas. Buy areas are defined in green color (light green & dark green) while Sell areas are defined in red color (light red pink and darker color) Rectangles to easily know that whether price is in buy area or sell area. If price is in gray area, wait for price to come in to your desired area. You can use on any Forex Pairs.
This indicator calculates on the basis of h4 timeframe no matter what time frame you have selected, its cal

Multicurrency indicator in table format. Signals appear with confirmation, do not redraw. The indicator works on the current (open) timeframe. Notifications come for an open instrument. The strategy includes: price touching the moving average in the direction of the trend, as well as an extraordinary recalculation of the classic ADX indicator to determine the trend as an additional filtering of entries. Entries are displayed on the chart as arrows and, as mentioned above, the arrows are not redr

The indicator shows the Buy/Sell direction. The calculations use the opening prices and their rate of change for the billing period - "Calculation period" MTF indicator - "Calculation timeframe", no repaint - NRP. Two display types: "Chart default" или "Chart color" For "Chart color" color customization available : "Bar color" Two types stop levels: "Simple stop level" or "Dynamic stop level " Color settings: "Stop level color" Alerts available: "Chart message", "Push message", "Email message" F

Indicatore dotato di un sistema di calcolo del tasso di vincita [Caratteristiche dell'indicatore] Questo indicatore consente di confermare in modo intuitivo e semplice l'analisi tecnica regolare con segnali di segno. Inoltre, può controllare la percentuale di vincita dei parametri correnti e include un sistema di determinazione automatica della percentuale di vincita che evita di dare segnali quando la percentuale di vincita è bassa. Ciò riduce le voci non necessarie e ti consente di entrare
Candle Scanner Dashboard is an incredibly powerful tool in the financial markets. It excels at detecting market reversals, trend changes, and retracements. The dashboard displays patterns as they are identified, and with a simple click on each pattern, you can view them on their dedicated charts to precisely locate their occurrences. With its capability to detect 11 popular bullish and 11 bearish patterns, you can trust the dashboard to handle pattern identification effortlessly. It provides an

Indicatore dotato di un sistema di calcolo del tasso di vincita [Caratteristiche dell'indicatore] Questo indicatore consente una conferma intuitiva e semplice dell'analisi tecnica regolare attraverso segnali di segno. Inoltre, può verificare l'adeguatezza dei parametri correnti verificando la percentuale di vincita e include un sistema di determinazione automatica della percentuale di vincita che si astiene dal generare segnali quando la percentuale di vincita è bassa. Ciò riduce le entrate n

Indicatore dotato di un sistema di calcolo del tasso di vincita [Caratteristiche dell'indicatore] Questo indicatore consente una conferma intuitiva e semplice dell'analisi tecnica regolare attraverso segnali di segno. Inoltre, può verificare l'adeguatezza dei parametri correnti verificando la percentuale di vincita e include un sistema di determinazione automatica della percentuale di vincita che si astiene dal generare segnali quando la percentuale di vincita è bassa. Ciò riduce le entrate n

Indicatore dotato di un sistema di calcolo del tasso di vincita [Caratteristiche dell'indicatore] Questo indicatore consente una conferma intuitiva e semplice dell'analisi tecnica regolare attraverso segnali di segno. Inoltre, può verificare l'adeguatezza dei parametri correnti verificando la percentuale di vincita e include un sistema di determinazione automatica della percentuale di vincita che si astiene dal generare segnali quando la percentuale di vincita è bassa. Ciò riduce le entrate n

Indicatore dotato di un sistema di calcolo del tasso di vincita [Caratteristiche dell'indicatore] Questo indicatore consente una conferma intuitiva e semplice dell'analisi tecnica regolare attraverso segnali di segno. Inoltre, può verificare l'adeguatezza dei parametri correnti verificando la percentuale di vincita e include un sistema di determinazione automatica della percentuale di vincita che si astiene dal generare segnali quando la percentuale di vincita è bassa. Ciò riduce le entrate n

Indicatore dotato di un sistema di calcolo del tasso di vincita [Caratteristiche dell'indicatore] Questo indicatore consente una conferma intuitiva e semplice dell'analisi tecnica regolare attraverso segnali di segno. Inoltre, può verificare l'adeguatezza dei parametri correnti verificando la percentuale di vincita e include un sistema di determinazione automatica della percentuale di vincita che si astiene dal generare segnali quando la percentuale di vincita è bassa. Ciò riduce le entrate n

Indicatore dotato di un sistema di calcolo del tasso di vincita [Caratteristiche dell'indicatore] Questo indicatore consente una conferma intuitiva e semplice dell'analisi tecnica regolare attraverso segnali di segno. Inoltre, può verificare l'adeguatezza dei parametri correnti verificando la percentuale di vincita e include un sistema di determinazione automatica della percentuale di vincita che si astiene dal generare segnali quando la percentuale di vincita è bassa. Ciò riduce le entrate n

Indicatore con Win Rate Calculation System [Caratteristiche dell'indicatore] Questo indicatore consente una conferma intuitiva e chiara dell'analisi tecnica regolare attraverso segnali di segno. Inoltre, può verificare l'adeguatezza dei parametri correnti controllando la percentuale di vincita e include un sistema di determinazione automatica della percentuale di vincita che si astiene dal generare segnali quando la percentuale di vincita è bassa. Ciò riduce le voci non necessarie e consente

Indicatore con Win Rate Calculation System [Caratteristiche dell'indicatore] Questo indicatore consente agli operatori di confermare in modo intuitivo e chiaro l'analisi tecnica regolare attraverso segnali di segno. Inoltre, può verificare se i parametri attuali sono appropriati controllando la percentuale di vincita e include un sistema di determinazione automatica della percentuale di vincita che si astiene dal generare segnali quando la percentuale di vincita è bassa. Ciò riduce le voci no

Indicatore con Win Rate Calculation System [Caratteristiche dell'indicatore] Questo indicatore consente agli operatori di confermare in modo intuitivo e chiaro l'analisi tecnica regolare attraverso segnali di segno. Inoltre, può verificare se i parametri attuali sono appropriati controllando la percentuale di vincita e include un sistema di determinazione automatica della percentuale di vincita che si astiene dal generare segnali quando la percentuale di vincita è bassa. Ciò riduce le voci no

Indicatore con Win Rate Calculation System [Caratteristiche dell'indicatore] Questo indicatore consente agli operatori di confermare in modo intuitivo e chiaro l'analisi tecnica regolare attraverso segnali di segno. Inoltre, può verificare se i parametri attuali sono appropriati controllando la percentuale di vincita e include un sistema di determinazione automatica della percentuale di vincita che si astiene dal generare segnali quando la percentuale di vincita è bassa. Ciò riduce le voci no

Indicatore dotato di Win Rate Calculation System 【Caratteristiche dell'indicatore】 Questo indicatore consente di confermare in modo intuitivo e chiaro la normale analisi tecnica attraverso segnali di segnalazione. Inoltre, dispone di un sistema di determinazione automatica del tasso di vincita che controlla se i parametri correnti sono adeguati ed evita di emettere segnali quando il tasso di vincita è basso. Ciò riduce le voci non necessarie e ti consente di entrare in operazioni solo quando

12 tipi di analisi tecnica inclusi! Indicatore dotato di sistema di calcolo del tasso di vincita 【Caratteristiche dell'indicatore】 Questo indicatore consente di confermare in modo intuitivo e chiaro 12 tipi di analisi tecnica normale attraverso segnali di segnale. Inoltre, dispone di un sistema di determinazione automatica del tasso di vincita che controlla se i parametri correnti sono adeguati ed evita di emettere segnali quando il tasso di vincita è basso. Ciò riduce le voci non necessarie
VWAP Scanner is a multi-timeframe and multi-symbol dashboard and alert that checks all timeframes and symbols to find trading Opportunities based on Vwap Indicator
How to USE VWAP Scanner
First make a text file with name of Symbols Under Terminal\MQL4\Files
Write the name of symbols as its on mt4 with (,) to separate
Example :
EURUSD,USDJPY,USDCAD,GBPUSD,MCRO,MGLD,NIFTY Note- Its works in all Market And save this text file
Inputs of scanner
NameOfSymbolsTextFile = "Symbols

Indicator UU Bands สำหรับเทรดเดอร์ ที่ต้องการความแม่นยำ ในการเข้าเทรด หรือ หาจังหวะในการเข้าเทรด
ใช้ได้กับทุก ทามเฟรม
ข้อมูลของ อินดิเคเตอร์ 1. มี แบนด์ ด้วยกันทั้งหมด 7 เส้น 2. เส้น 3 เส้น ด้านบน เป็นแนวต้าน เคลื่อนที่ แนวต้านที่1 แนวต้านที่ 2 แนวต้านที่3 3. เส้น 3 เส้น ด้านล่าง เป็นแนวรับ เคลื่อนที่ แนวรับที่ 1 แนวรับที่ 2 แนวรับที่ 3 4. เส้นตรงกลาง เป็นเส้นแบ่ง เทรน สีเขียว หมายถึง แนวโน้มขึ้น สีแดง หมายถึง แนวโน้มลง 5. สัญลักษณ์ ลูกศร สามารถนำไปอ้างอิง เป็นจุดเข้าเทรดได้
คำแนะสำหรับกา
MT5 Version GaussChannelPro is a powerful and innovative trading indicator designed to enhance your trading strategy with the precision of Gaussian-based channels. Leveraging the principles of Gaussian (normal) distribution, this indicator creates a unique channel on your price chart, offering valuable insights into market trends and potential turning points. Utilizing advanced statistical analysis, GaussChannelPro calculates the optimal channel boundaries based on historical price data, present

Global Trend Lines
The Buy/Sell Zone Indicator possesses several features that can be used to improve your trading strategy. This indicator helps you identify buy zones and sell zones on the chart. The main features of this indicator are as follows: Identifying Trend Levels: The indicator has algorithms used to identify trend levels. This helps you determine the direction and strength of the trend. Marking Buy and Sell Zones: The indicator marks buy zones and sell zones on the chart. This ass

Nel mondo del trading di opzioni binarie, dove l'analisi di mercato precisa e le decisioni strategiche sono fondamentali, la ricerca di un indicatore di trading eccezionale in grado di sbloccare opportunità redditizie è infinita. Entra in scena l'Indicatore Segreto - un notevole strumento di trading per opzioni binarie MT4 che si è guadagnato la reputazione di essere il migliore e il più potente della sua categoria.
L'Indicatore Segreto è il risultato di anni di ricerca, sviluppo e test accur
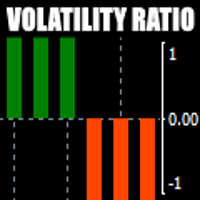
There is always a need to measure if the market is "quiet" or it is volatile. One of the possible way is to use standard deviations, but the issue is simple : We do not have some levels that could help us find out if the market is in a state of lower or higher volatility.
This indicator is attempting to do that : • values above level 0 are indicating state of higher volatility (=GREEN buffer) • values below level 0 are indicating state of lower volatility (=RED buffer)
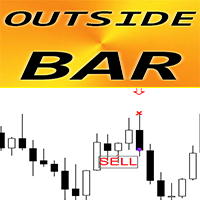
Forex Indicator OUTSIDE Bar Pattern for MT4 Indicator " OUTSIDE Bar " is very powerful indicator for Price Action trading : No repaint, No delays; Indicator detects OUTSIDE Bar patterns on chart: Bullish OUTSIDE Bar - Blue arrow signal on chart (see pictures) Bearish OUTSIDE Bar - Red arrow signal on chart (see pictures) P C, Mobile & Email alerts are included Indicator " OUTSIDE Bar Pattern " is excellent to combine with Support/Resistance Levels // More great Expert Ad

Ti presentiamo PivotXpert , un indicatore Multichart avanzato progettato per migliorare la tua strategia sui punti pivot. Sblocca il suo potenziale senza sforzo, con un'interfaccia intuitiva che rende il pivot trading un gioco da ragazzi.
La modalità Multichart di PivotXpert semplifica il tuo trading disegnando linee pivot su tutti i grafici aperti. Calcola facilmente i pips rimanenti per ogni livello utilizzando la funzione CalculatePips, perfezionando la tua strategia con facilità.

Индикатор показывает точки входа. Индикатор не перерисовывает и не исчезает в истории. Индикатор может служить дополнением вашей торговой стратегии. При желание можно настроить индикатор как на агрессивную торговлю( но в этом случае будет много ложных сигналов) так же на пассивную торговлю. Хорошие показатели индикатор показывает сигналы на валютной паре GBPUSD на минутном таймфрейме.

Strength of 8 popular currencies (EUR, GBP, USD, CAD, AUD, NZD, CHF, JPY) is calculated from 28 pairs of Forex market following a Moving Average with custom period and method. You can use it by adding 2 indicators to the chart of Forex pair based on the pair currencies and use it as a confirmation on your strategies.
Currencies: EUR, GBP, USD, CAD, AUD, NZD, CHF, JPY
Inputs: Currency: 1 of the 8 currencies MA Period: Period of Moving Average MA Method: Method of Moving Average (SMA, EMA, S

Channel Vertex is a price action pattern formed by price Chanel and a triangle pattern . Price channels basically indicates possible support and resistance zones around a price movement and retracement or breakout at these levels can indicate possible trend continuation or reversal .
Majority of the times price fluctuations forms triangle patterns defined by 3 vertexes , these triangle patterns most times defines a trend continuation. A triangle pattern is a trend continuation pattern tha

This is an advanced index algorithm, it provides a very accurate top-bottom signal, it will not frequently appear the wrong signal during the trend, this index does not have any redrawing, drift, or lag behavior. When this signal appears on the chart, it means that the market is about to reverse, or that a period of trend market is over, and then the market will be transformed into a consolidation market, and this indicator does not need to adjust the parameters. It applies to any currency pai

This indicator is very advanced. I dare say that there is no second indicator in the world that describes false breakthroughs so accurately. When the market hits a certain level three times in a row, the market will first break through this level and then return to the inside of the horizontal line. At this time, our indicator will send a signal to alarm that this is a standard fake breakthrough, the index has not been redrawn, the signal has not been delayed, and everything is true and reliable
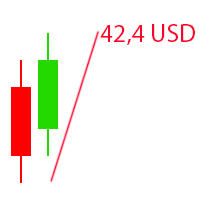
The Visual Result Calculator Indicator is a powerful tool designed to enhance your trading experience on the MetaTrader platform. This intuitive and user-friendly indicator allows you to visualize potential profits or losses on a trading chart, helping you make better-informed decisions and manage your trades with precision. The Indicator displays a dynamic line on the trading chart, representing the potential profit or loss of a trade based on the start and end of the line. Simply click and d

PowerXXX misura la potenza della candela attuale e la mostra in formato numerico ed in colori. L'indicatore puo' coprire piu' timeframe e puo' essere messo sul grafico principale od anche sui grafici degli indicatori sottostanti. Il numero di timeframe e' selezionabile, cosi' come i livelli di colore sono selezionabili in base alla potenza espressa. Nell'ultima versione la potenza puo' essere espressa in funzione dell'open della candela stessa oppure in funzione dell'apertura di tot candele pri

**Presentando il Sistema Binario Intelligente: Il Tuo Compagno di Trading Definitivo**
Il Sistema Binario Intelligente non è solo un indicatore; è uno strumento di trading sofisticato progettato meticolosamente per fornire ai trader una precisione accurata e segnali tempestivi in diversi mercati. Costruito su algoritmi all'avanguardia e una collezione esaustiva di indicatori tecnici, questo sistema è la tua chiave per sbloccare il successo nel trading.
**Componenti dell'Indicatore:**
1.
Using Standard Deviation but not sure if the Standard Deviation is high or low?
eRSD or Easy Relative Standard Deviation comes to your help. Using this you can get a ratio of Standard Deviation to Moving Average and make a good judgement about whether the Standard Deviation is useful or not.
Just add it to the chart and use it away - it supports all periods and moving average calculation methods through the input parameters.

The "No repaint" indicator is designed for analyzing market dynamics and determining potential trading signal moments. The main feature of this indicator is the absence of signal repainting, which contributes to more accurate and reliable forecasting of price movements in the market.
Mechanism of Operation: The "No repaint" indicator uses several types of graphical elements to indicate trading signals: Up and Down Arrows: The indicator marks possible market entry points with up and down arrow

Hello Dear Trader, Today Im Telling You About The "Golden Scalp System V1 " Metatrader4 Golden Scalp System
Scalper with EMA This is a Scalper strategy based on ( Exponential moving average) EMA . Time frame: H1 Pair: EUR/USD, GBP/USD,AUD/USD XAU/USD
Platform Mt4 Indicators for Scalper with Ema: 300 EMA (Exponential Moving Average) ; 500 EMA (Expontial Moving Average); Stochastic (5,3,3) Long Entry
1) 300 EMA > 500 EMA .
2) Find significant levels of support.
3) Wait for

Introducing the POWER TRADE indicator created by a small group of traders with a few years trading trading the financial market profitably . This is a plug and play indicator that provides you with POWERFUL Entry signals with Profit Taking and rebound zones. The indicator Works with all MT4 trading instruments. The indicator uses previous chart data as receipt to speculate on future market moves.
The Power signals occurs on all timeframes. Though the signals occur more often on smaller tim
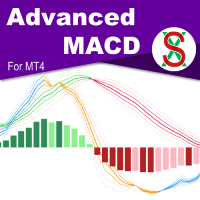
MACD ( M oving A verage C onvergence/ D ivergence) is a widely used indicator in technical analysis. What makes the MACD such a valuable tool for technical analysis is that it effectively combines two indicators into one. It can help to identify trends and measure momentum simultaneously. SX Advanced MACD for MT5 is available here . SX Advanced MACD indicator takes this concept further by plotting two distinct MACD indicators on a single chart, facilitating clear visual correlation between each
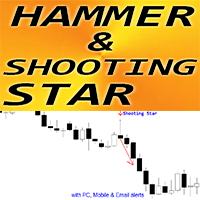
Forex Indicator " Hammer and Shooting Star pattern" for MT4 Indicator " Hammer and Shooting Star pattern " is very powerful indicator for Price Action trading : No repaint, No delays; Indicator detects bullish Hammer and bearish Shooting Star patterns on chart: Bullish Hammer - Blue arrow signal on chart (see pictures) Bearish Shooting Star - Red arrow signal on chart (see pictures) P C, Mobile & Email alerts are included Indicator " Hammer and Shooting Star pattern" is excel

Rivelare le Visioni del Trading con Auto Anchored VWAPs: Auto Anchored VWAPs sono la tua guida nel mondo del trading. Questi indicatori individuano i punti cruciali di inversione del mercato e li illustrano sul tuo grafico utilizzando le linee VWAP. Questo rappresenta un cambiamento epocale per i trader che utilizzano strategie ancorate alle VWAP. Come Funziona? Identificazione dei Punti Altai: Se il prezzo più alto della candela corrente è inferiore al prezzo più alto della candela precedente,
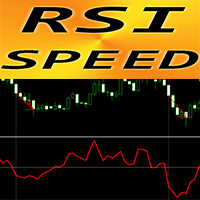
Forex Indicator "RSI SPEED" for MT4 - great predictive tool! The calculation of this indicator is based on equations from physics . RSI SPEED is the 1st derivative of RSI itself RSI SPEED is good for scalping entries into the direction of main trend Use it in combination with suitable trend indicator , for example HTF MA (as on pictures) RSI SPEED indicator shows how fast RSI itself changes its direction - it is very sensitive It is recommended to use RSI SPEED indicator fo

This is a combination of multiple oscillators into a single divergence system that creates the impression of a more reliable divergence indicator. It is multi-currency based and works best on 15 minutes timeframe and above. Every time a signal is generated, it shows an alert to the user. It is more ideal if combined with other price action indicators or trading systems.

Hidden Gap by MMD Hidden Gap by MMD is a unique indicator that detects hidden gaps between three consecutive candles. This observation isn't my own, but in the MMD methodology, it has its application alongside other original indicators. You can apply this indicator to the chart multiple times and set the interval from which you want to see the hidden gaps. You can show or hide these gaps as needed. For example, you can view the chart at an M5 interval and see hidden gaps from an M15 chart, etc.

L'indicatore MOST è un indicatore molto popolare utilizzato su altre piattaforme, in particolare per azioni e indici. La base sono le medie mobili e i livelli alto-basso. Potrebbe essere appropriato utilizzare l'input percentuale pari a 2 per azioni e indici e 1 - 1,5 per gli strumenti forex. Puoi apportare le tue modifiche per ogni strumento. È un indicatore facile da usare, semplice e chiaro. È più comune nei grafici a 1 ora e giornalieri. Per ora ho modificato solo per la piattaforma MT4, se
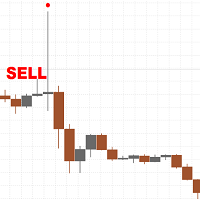
There are only a limited number of copies left, priced at 390 USD . After that, the price will be raised to 450 USD. I develop honest Indicators and know what can work in the market in the long term and what cannot. The classic and most powerful price action pattern is called the pin bar. This pattern works well after the release of fundamental news on M15, M30 and H1 timeframes, but can also be used on other timeframes such as M5 or D1. By default, the settings are set for the H1 timeframe,

Hey traders, it's easy for you to find when to buy or sell signals. Can be used for all forex pairs including gold. How to use this indicator on the M30 or H1 timeframe, for a buy signal, wait until an up arrow appears and for a sell signal, wait for a down arrow, place a stop loss 5-10 points below the arrow. Better trading time on the London and New York sessions and avoid trading when there is news. Happy Trading
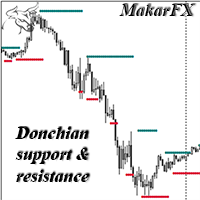
Support and resistance level indicator based on the Donchian channel. The most famous example of trading through the Donchian channel is an experiment with a group of turtles, who earned one hundred and twenty-five million dollars in five years. This indicator can be used as a standalone tool, as well as an additional confirmation. There is MTF, NRP. There are color and thickness settings.

This is a dashboard indicator that displays the auto-calculated risk lot, with the given risk percentage & risk points (Stop Loss) and others. The main function of this indicator is to help you calculate your exact scalping risk lots and swing risk lots. Also it displays the active trades of each pair you've executed with the following: type of trade, lot size, symbol, & equity(+/-). Also displays the bar counter set in every 5-minute bar timer. (whichever time frame you're active, the bar time

Простой и удобный индикатор, указывающий зоны стандартных индикаторов в различных таймфреймах, при необходимости можете в настройках изменить параметры RSI- Relative strength index. Стрелка вверх- если сигнальная линия ниже уровня 300, стрелка вниз- если сигнальная линия выше уровня 70 STOCH- Stochastic. Стрелка вверх- если сигнальная линия ниже уровня 20, стрелка вниз- если сигнальная линия выше уровня 80 ENVELOPE - Envelopes. Стрелка вверх- если свеча открылась ниже красной линии индика

This indicator shows when user set sessions are active and returns various tools + metrics using the closing price within active sessions as an input. Users have the option to change up to 4 session times.
The indicator will increasingly lack accuracy when the chart timeframe is higher than 1 hour.
Settings
Sessions
Enable Session: Allows to enable or disable all associated elements with a specific user set session.
Session Time: Opening and closing times of the user set session
Introduzione:
La "Turning Zone" è un indicatore MT4 sofisticato e innovativo progettato per fornire ai trader un potente strumento per rilevare potenziali inversioni di tendenza all'interno dei mercati finanziari. Utilizzando il concetto senza tempo dell'analisi del forcone, l'indicatore Turning Zone identifica le principali zone di inversione in cui è probabile che il sentimento del mercato cambi, offrendo ai trader preziose informazioni per prendere decisioni informate. Versione MT5 : WH

This is a dashboard indicator that displays the Average Level of each selected currency pairs that filters and gives us a signal for overbought (>=90%) or if price at extreme peak above 90, and/or oversold (<=10%) or if price at extreme peak below 10.
The calculation is using Relative Strength Index default periods (2 & 9) applied to three different higher time frames H4,D1,&W1.
This won't change or altered even if you change symbol or switch to lower time frames or even in monthly and y

The Donchian Scanner Signals Indicator with is a powerful tool designed for traders operating in the financial market using the Metatrader 4 platform. This indicator combines the popular Donchian Channels strategy with advanced signalization and real-time alert features, providing a clear view of potential entry and exit points in a financial asset. Key Features: Donchian Channels Visualization: The indicator graphically displays Donchian Channels on the price chart. These channels are formed us
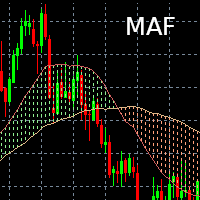
Indicateur Moving Average Filling Affiche deux moyennes mobiles (une courte et une longue) dont la durée et le type (Simple, exponentielle) est paramétrable. L'espace entre les deux moyennes mobiles est alors colorié (rempli) :
- Vert si courte > longue
- Rouge si courte < longue Il est possible de changer les couleurs selon les préférences de chacun / chacune.
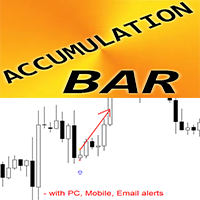
Forex Indicator Accumulation Bar Pattern for MT4 Indicator " Accumulation Bar " is very powerful breakout-focused indicator for Price Action trading Indicator detects price accumulation in narrow area during 1 bar and shows: Breakout direction, Pending order and SL locations Bullish Accumulation Bar - Blue arrow signal on chart (see pictures) Bearish Accumulation Bar - Red arrow signal on chart (see pictures) No repaint; No delays; High R/R ratio (reward/risk); I ndicator has adjustab
Please feel free to contact me if you need any further information.
Please let me know if you have any questions.
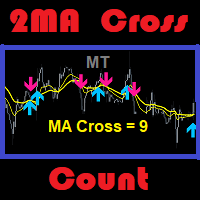
I hope the above is useful to you. MT 2ma Cross Count : is a moving average with 2 lines crossing but the strategy is to focus on the desired number of history bars and count signals that occur. Suitable for traders specialize in martingale strategy or traders specialize in technical ... etc. Traders with the ability to do fundamental analysis have an advantage. Because it will ma
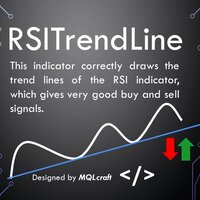
RSI Trend Lines Indicator - Identify Optimal Buying and Selling Opportunities Introduction :
The RSI Trend Lines Indicator is a powerful tool designed to assist traders in identifying optimal buying and selling opportunities based on the Relative Strength Index (RSI) oscillator. This advanced indicator draws trend lines on the RSI chart using multiple points, providing valuable insights into potential market trends and reversals. By leveraging the RSI Trend Lines Indicator, traders can enhance

Perfect for one minutes high trading and scalping. This indicator is very effective for trading on one minutes, in the hour. A combination of moving averages and STOCHASTICS calculation to produce a very convincing signal every hour. Blue colour signals a buy opportunity. Follow the X signs for possible buy points. The Blue average line serves as possible trend direction and support. Red colour signals a sell opportunity. Follow the X signs for possible sell points. The Red average line serves a
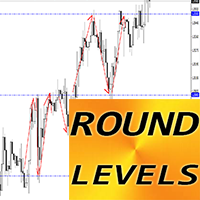
Forex Indicator "Round Levels" for MT4 Indicator "Round Levels" is must have auxiliary indicator for traders who take support/resistance into consideration Round Levels are respected by the price very much - price rebounds from round levels very often Use 1000 points Step for H4, D1 time frames U se 500 points Step for H1 and lower time frames (for intraday trading) Also Round levels are good to allocate Take Profits (in front of round level) and SL (behind the round level) These levels are ver

Benvenuto nel mondo del trading avanzato con l'indicatore Super Trading FxBears. Progettato esclusivamente per la piattaforma MT4, questo strumento innovativo combina la potenza delle onde di Elliott, le zone di domanda e offerta e gli indicatori interni per fornire ai trader segnali di alta qualità per decisioni di trading informate. Con un track record di oltre il 90% di tasso di successo, FxBears Super porta un nuovo livello di precisione e redditività alla tua strategia di trading. Naturalm

"Questo indicatore rileva gli ingressi basati sulla teoria del modello Bystra e fornisce i valori di ingresso per inserire ordini limitati con livelli di destinazione e di stop. Ciò consente di calcolare la percentuale di rischio. Note: Questo indicatore dispone di buffer che ne consentono l'utilizzo negli Advisor Esperti (EA). È importante praticare una buona gestione del denaro durante il lavoro con questo prodotto. Quando cambi il tuo timeframe, L'indicatore salverà il template utilizzato nel
Il MetaTrader Market è il posto migliore per vendere robot di trading e indicatori tecnici.
Basta solo sviluppare un'applicazione per la piattaforma MetaTrader con un design accattivante e una buona descrizione. Ti spiegheremo come pubblicare il tuo prodotto sul Market per metterlo a disposizione di milioni di utenti MetaTrader.
Ti stai perdendo delle opportunità di trading:
- App di trading gratuite
- Oltre 8.000 segnali per il copy trading
- Notizie economiche per esplorare i mercati finanziari
Registrazione
Accedi
Se non hai un account, registrati
Consenti l'uso dei cookie per accedere al sito MQL5.com.
Abilita le impostazioni necessarie nel browser, altrimenti non sarà possibile accedere.