Indicadores técnicos de pago para MetaTrader 4 - 99

KT DMA is a modified and advanced version of the classic Displaced Moving Averages with buy/sell crossover alerts and a Multi-Timeframe scanner that shows DMA's direction across each real-time time frame. A Displaced Moving Average is a simple moving average that moves ahead or backward in a time frame (either short-term or long-term). It also allows you to predict price movement more accurately.
Features Depicts the trend direction using the alignment of three moving averages. Buy/Sell signa
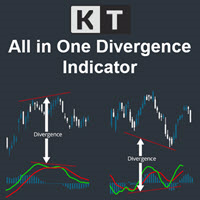
The KT All-In-One Divergence is designed to identify regular and hidden divergences between the price and 11 widely recognized oscillators. This powerful tool is indispensable for swiftly and accurately spotting market reversals. Its a must-have tool in any trader's arsenal, providing clear and accurate divergence patterns. Its accuracy and speed in identifying market reversals are remarkable, allowing traders to seize profitable opportunities confidently.
Features No Interference: You can a

indicator CE and RF Buy-Sell Chandelier Exit and Range Filter Buy Sell
It is the ultimate indicator for telling entry points or entering trades with high accuracy.
Trades must be short term trading only or Scalping only, not suitable for holding positions across several days.
Suitable for beginner traders and professional traders.
Easy Operation 1. Import Indicator, CE and RF into MT4 chart. 2. Waiting for the signal from the arrow pointing up means recommending a long position. and an
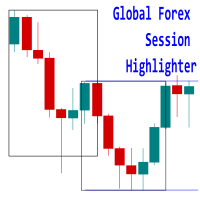
Introducing the 'Global Forex Session Highlighter' , a powerful tool designed to enhance your trading strategy by providing a visual representation of the Three major Forex trading sessions: Tokyo, London, and New York. This indicator is designed to help traders understand the dynamics of the global Forex market by highlighting the trading sessions directly on your MT4 chart. It provides a clear view of when each session starts and ends, allowing you to strategize your trades around the most
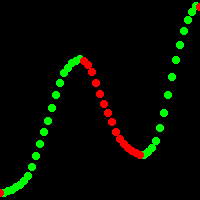
"Xhmaster formula forex indicator" - un nuevo indicador oscilador con modelado matemático de regresión de series numéricas libres. Este indicador es un 60% más preciso en la identificación de puntos de reversión de precios en comparación con el indicador estándar "Xmaster formula", y es menos sensible a pequeñas fluctuaciones de precios. "Xhmaster formula forex indicator" es una herramienta única y avanzada diseñada específicamente para traders en el mercado Forex. Proporciona a los traders exce

However, the difficult task here for traders is to understand and select the indicator or tool that can help them with their trading plan and benefit their trading style. Traders want a tool that requires minimal effort and provides as much support as it can.
There are multiple reasons for which traders need an indicator. One such reason is to determine the buy-sell signals in the market. The King Binary Forex Scalping Indicator is a tool that can help traders get answers to many question
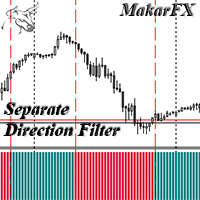
The indicator shows the Buy/Sell direction. The calculations use the opening prices and their rate of change for the billing period - "Calculation period" MTF indicator - "Calculation timeframe", no repaint - NRP. Two display types: "Simple histogram" or "Histogram level crossing" Alerts available: "Chart message", "Push message", "Email message" Two types of signals: "Change direction" or "Crossing level" Level settings: "Crossing UP level" and "Crossing DN level" Color settings. For EA: iCusto

¡Presentamos nuestro indicador revolucionario - "TrendStoch Channel Pro"! Esta poderosa herramienta permite a los operadores obtener una visión integral del mercado al combinar a la perfección dos características esenciales: observar tendencias temporales más largas y el canal estocástico, directamente en su gráfico.
Con "TrendStoch Channel Pro", experimentará un nuevo nivel de precisión comercial. La capacidad del indicador para mostrar tendencias temporales más largas le permite identif

In Forex trading, understanding support and resistance is crucial. Virtually every trading strategy incorporates these levels.
MetaTrader lacks built-in support and resistance calculation features, but there's a solution— the Support and Resistance Lines indicator.
This powerful MetaTrader indicator automatically calculates and displays support and resistance levels for any chosen currency pair or trading instrument.
Benefits of the Support and Resistance Lines indicator:
1. Identify be
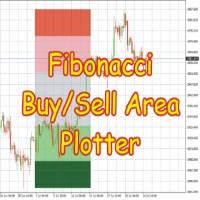
This Indicator is based on Fibonacci levels and draws Buy & Sell Areas. Buy areas are defined in green color (light green & dark green) while Sell areas are defined in red color (light red pink and darker color) Rectangles to easily know that whether price is in buy area or sell area. If price is in gray area, wait for price to come in to your desired area. You can use on any Forex Pairs.
This indicator calculates on the basis of h4 timeframe no matter what time frame you have selected, its cal

Multicurrency indicator in table format. Signals appear with confirmation, do not redraw. The indicator works on the current (open) timeframe. Notifications come for an open instrument. The strategy includes: price touching the moving average in the direction of the trend, as well as an extraordinary recalculation of the classic ADX indicator to determine the trend as an additional filtering of entries. Entries are displayed on the chart as arrows and, as mentioned above, the arrows are not redr

The indicator shows the Buy/Sell direction. The calculations use the opening prices and their rate of change for the billing period - "Calculation period" MTF indicator - "Calculation timeframe", no repaint - NRP. Two display types: "Chart default" или "Chart color" For "Chart color" color customization available : "Bar color" Two types stop levels: "Simple stop level" or "Dynamic stop level " Color settings: "Stop level color" Alerts available: "Chart message", "Push message", "Email message" F

Indicador equipado con un sistema de cálculo de tasa de ganancia [Características del indicador] Este indicador le permite confirmar de forma intuitiva y sencilla el análisis técnico regular con señales de signos. Además, puede verificar la tasa de ganancias de los parámetros actuales e incluye un sistema de determinación automática de la tasa de ganancias que evita dar señales cuando la tasa de ganancias es baja. Esto reduce las entradas innecesarias y le permite ingresar operaciones solo cu
Candle Scanner Dashboard is an incredibly powerful tool in the financial markets. It excels at detecting market reversals, trend changes, and retracements. The dashboard displays patterns as they are identified, and with a simple click on each pattern, you can view them on their dedicated charts to precisely locate their occurrences. With its capability to detect 11 popular bullish and 11 bearish patterns, you can trust the dashboard to handle pattern identification effortlessly. It provides an

Indicador equipado con un sistema de cálculo de tasa de ganancia [Características del indicador] Este indicador permite una confirmación intuitiva y fácil del análisis técnico regular a través de señales. Además, puede comprobar la idoneidad de los parámetros actuales mediante la verificación de la tasa de ganancias e incluye un sistema automático de determinación de la tasa de ganancias que se abstiene de generar señales cuando la tasa de ganancias es baja. Esto reduce las entradas innecesar

Indicador equipado con un sistema de cálculo de tasa de ganancia [Características del indicador] Este indicador permite una confirmación intuitiva y fácil del análisis técnico regular a través de señales. Además, puede comprobar la idoneidad de los parámetros actuales mediante la verificación de la tasa de ganancias e incluye un sistema automático de determinación de la tasa de ganancias que se abstiene de generar señales cuando la tasa de ganancias es baja. Esto reduce las entradas innecesar

Indicador equipado con un sistema de cálculo de tasa de ganancia [Características del indicador] Este indicador permite una confirmación intuitiva y fácil del análisis técnico regular a través de señales. Además, puede comprobar la idoneidad de los parámetros actuales mediante la verificación de la tasa de ganancias e incluye un sistema automático de determinación de la tasa de ganancias que se abstiene de generar señales cuando la tasa de ganancias es baja. Esto reduce las entradas innecesar

Indicador equipado con un sistema de cálculo de tasa de ganancia [Características del indicador] Este indicador permite una confirmación intuitiva y fácil del análisis técnico regular a través de señales. Además, puede comprobar la idoneidad de los parámetros actuales mediante la verificación de la tasa de ganancias e incluye un sistema automático de determinación de la tasa de ganancias que se abstiene de generar señales cuando la tasa de ganancias es baja. Esto reduce las entradas innecesar

Indicador equipado con un sistema de cálculo de tasa de ganancia [Características del indicador] Este indicador permite una confirmación intuitiva y fácil del análisis técnico regular a través de señales. Además, puede comprobar la idoneidad de los parámetros actuales mediante la verificación de la tasa de ganancias e incluye un sistema automático de determinación de la tasa de ganancias que se abstiene de generar señales cuando la tasa de ganancias es baja. Esto reduce las entradas innecesar

Indicador equipado con un sistema de cálculo de tasa de ganancia [Características del indicador] Este indicador permite una confirmación intuitiva y fácil del análisis técnico regular a través de señales. Además, puede comprobar la idoneidad de los parámetros actuales mediante la verificación de la tasa de ganancias e incluye un sistema automático de determinación de la tasa de ganancias que se abstiene de generar señales cuando la tasa de ganancias es baja. Esto reduce las entradas innecesar

Indicador con sistema de cálculo de tasa de ganancia [Características del indicador] Este indicador permite una confirmación intuitiva y clara del análisis técnico regular a través de señales. Además, puede verificar la idoneidad de los parámetros actuales al verificar la tasa de ganancias e incluye un sistema de determinación automática de la tasa de ganancias que se abstiene de generar señales cuando la tasa de ganancias es baja. Esto reduce las entradas innecesarias y permite la entrada so

Indicador con sistema de cálculo de tasa de ganancia [Características del indicador] Este indicador permite a los operadores confirmar de manera intuitiva y clara el análisis técnico regular a través de señales. Además, puede verificar si los parámetros actuales son apropiados al verificar la tasa de ganancias e incluye un sistema automático de determinación de la tasa de ganancias que se abstiene de generar señales cuando la tasa de ganancias es baja. Esto reduce las entradas innecesarias y

Indicador con sistema de cálculo de tasa de ganancia [Características del indicador] Este indicador permite a los operadores confirmar de manera intuitiva y clara el análisis técnico regular a través de señales. Además, puede verificar si los parámetros actuales son apropiados al verificar la tasa de ganancias e incluye un sistema automático de determinación de la tasa de ganancias que se abstiene de generar señales cuando la tasa de ganancias es baja. Esto reduce las entradas innecesarias y

Indicador con sistema de cálculo de tasa de ganancia [Características del indicador] Este indicador permite a los operadores confirmar de manera intuitiva y clara el análisis técnico regular a través de señales. Además, puede verificar si los parámetros actuales son apropiados al verificar la tasa de ganancias e incluye un sistema automático de determinación de la tasa de ganancias que se abstiene de generar señales cuando la tasa de ganancias es baja. Esto reduce las entradas innecesarias y

Indicador equipado con sistema de cálculo de tasa de ganancia 【Características del indicador】 Este indicador le permite confirmar de forma intuitiva y clara el análisis técnico normal a través de señales. Además, tiene un sistema automático de determinación de la tasa de ganancias que verifica si los parámetros actuales son adecuados y evita emitir señales cuando la tasa de ganancias es baja. Esto reduce las entradas innecesarias y le permite ingresar operaciones solo cuando la tasa de gananc

¡12 tipos de análisis técnico incluidos! Indicador equipado con sistema de cálculo de tasa de ganancia 【Características del indicador】 Este indicador le permite confirmar de manera intuitiva y clara 12 tipos de análisis técnico normal a través de señales. Además, tiene un sistema automático de determinación de la tasa de ganancias que verifica si los parámetros actuales son adecuados y evita emitir señales cuando la tasa de ganancias es baja. Esto reduce las entradas innecesarias y le permite
VWAP Scanner is a multi-timeframe and multi-symbol dashboard and alert that checks all timeframes and symbols to find trading Opportunities based on Vwap Indicator
How to USE VWAP Scanner
First make a text file with name of Symbols Under Terminal\MQL4\Files
Write the name of symbols as its on mt4 with (,) to separate
Example :
EURUSD,USDJPY,USDCAD,GBPUSD,MCRO,MGLD,NIFTY Note- Its works in all Market And save this text file
Inputs of scanner
NameOfSymbolsTextFile = "Symbols

Indicator UU Bands สำหรับเทรดเดอร์ ที่ต้องการความแม่นยำ ในการเข้าเทรด หรือ หาจังหวะในการเข้าเทรด
ใช้ได้กับทุก ทามเฟรม
ข้อมูลของ อินดิเคเตอร์ 1. มี แบนด์ ด้วยกันทั้งหมด 7 เส้น 2. เส้น 3 เส้น ด้านบน เป็นแนวต้าน เคลื่อนที่ แนวต้านที่1 แนวต้านที่ 2 แนวต้านที่3 3. เส้น 3 เส้น ด้านล่าง เป็นแนวรับ เคลื่อนที่ แนวรับที่ 1 แนวรับที่ 2 แนวรับที่ 3 4. เส้นตรงกลาง เป็นเส้นแบ่ง เทรน สีเขียว หมายถึง แนวโน้มขึ้น สีแดง หมายถึง แนวโน้มลง 5. สัญลักษณ์ ลูกศร สามารถนำไปอ้างอิง เป็นจุดเข้าเทรดได้
คำแนะสำหรับกา
MT5 Version GaussChannelPro is a powerful and innovative trading indicator designed to enhance your trading strategy with the precision of Gaussian-based channels. Leveraging the principles of Gaussian (normal) distribution, this indicator creates a unique channel on your price chart, offering valuable insights into market trends and potential turning points. Utilizing advanced statistical analysis, GaussChannelPro calculates the optimal channel boundaries based on historical price data, present

Global Trend Lines
The Buy/Sell Zone Indicator possesses several features that can be used to improve your trading strategy. This indicator helps you identify buy zones and sell zones on the chart. The main features of this indicator are as follows: Identifying Trend Levels: The indicator has algorithms used to identify trend levels. This helps you determine the direction and strength of the trend. Marking Buy and Sell Zones: The indicator marks buy zones and sell zones on the chart. This ass

En el mundo de las operaciones binarias, donde el análisis de mercado preciso y la toma de decisiones estratégicas son fundamentales, la búsqueda de un indicador de trading excepcional que pueda desbloquear oportunidades rentables es interminable. Ingresa el Indicador Secreto, una notable herramienta de trading de opciones binarias en MT4 que ha ganado su reputación como la mejor y más fuerte de su clase.
El Indicador Secreto es el resultado de años de investigación minuciosa, desarrollo y pr
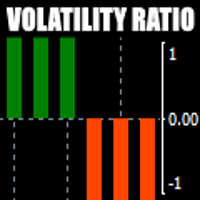
There is always a need to measure if the market is "quiet" or it is volatile. One of the possible way is to use standard deviations, but the issue is simple : We do not have some levels that could help us find out if the market is in a state of lower or higher volatility.
This indicator is attempting to do that : • values above level 0 are indicating state of higher volatility (=GREEN buffer) • values below level 0 are indicating state of lower volatility (=RED buffer)
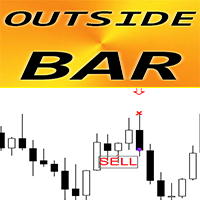
Indicador de Forex OUTSIDE Bar Pattern para MT4
El indicador "OUTSIDE Bar" es un indicador muy potente para operar con Price Action: no se repite el proceso ni se retrasa; El indicador detecta patrones de OUTSIDE Bar en el gráfico: Barra OUTSIDE alcista: señal de flecha azul en el gráfico (ver imágenes) Barra OUTSIDE bajista: señal de flecha roja en el gráfico (ver imágenes) Se incluyen alertas para PC, dispositivos móviles y correo electrónico El indicador "OUTSIDE Bar Pattern" es excelente

Presentamos PivotXpert , un indicador multigráfico avanzado diseñado para mejorar su estrategia de punto de pivote. Desbloquee su potencial sin esfuerzo, con una interfaz intuitiva que hace que el intercambio dinámico sea muy sencillo.
El modo Multichart de PivotXpert simplifica su negociación al dibujar líneas de pivote en todos los gráficos abiertos. Calcule los pips restantes para cada nivel sin esfuerzo usando la función CalculatePips, afinando su estrategia con facilidad.
Perso

Индикатор показывает точки входа. Индикатор не перерисовывает и не исчезает в истории. Индикатор может служить дополнением вашей торговой стратегии. При желание можно настроить индикатор как на агрессивную торговлю( но в этом случае будет много ложных сигналов) так же на пассивную торговлю. Хорошие показатели индикатор показывает сигналы на валютной паре GBPUSD на минутном таймфрейме.

Strength of 8 popular currencies (EUR, GBP, USD, CAD, AUD, NZD, CHF, JPY) is calculated from 28 pairs of Forex market following a Moving Average with custom period and method. You can use it by adding 2 indicators to the chart of Forex pair based on the pair currencies and use it as a confirmation on your strategies.
Currencies: EUR, GBP, USD, CAD, AUD, NZD, CHF, JPY
Inputs: Currency: 1 of the 8 currencies MA Period: Period of Moving Average MA Method: Method of Moving Average (SMA, EMA, S

Channel Vertex is a price action pattern formed by price Chanel and a triangle pattern . Price channels basically indicates possible support and resistance zones around a price movement and retracement or breakout at these levels can indicate possible trend continuation or reversal .
Majority of the times price fluctuations forms triangle patterns defined by 3 vertexes , these triangle patterns most times defines a trend continuation. A triangle pattern is a trend continuation pattern tha

This is an advanced index algorithm, it provides a very accurate top-bottom signal, it will not frequently appear the wrong signal during the trend, this index does not have any redrawing, drift, or lag behavior. When this signal appears on the chart, it means that the market is about to reverse, or that a period of trend market is over, and then the market will be transformed into a consolidation market, and this indicator does not need to adjust the parameters. It applies to any currency pai

This indicator is very advanced. I dare say that there is no second indicator in the world that describes false breakthroughs so accurately. When the market hits a certain level three times in a row, the market will first break through this level and then return to the inside of the horizontal line. At this time, our indicator will send a signal to alarm that this is a standard fake breakthrough, the index has not been redrawn, the signal has not been delayed, and everything is true and reliable
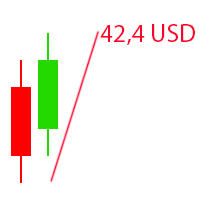
The Visual Result Calculator Indicator is a powerful tool designed to enhance your trading experience on the MetaTrader platform. This intuitive and user-friendly indicator allows you to visualize potential profits or losses on a trading chart, helping you make better-informed decisions and manage your trades with precision. The Indicator displays a dynamic line on the trading chart, representing the potential profit or loss of a trade based on the start and end of the line. Simply click and d

PowerXXX measures the power of the current candlestick and displays it in numerical format and colors. The indicator can cover multiple timeframes and can be placed on the main chart or on the charts of the underlying indicators. The number of timeframes is selectable, as well as the color levels according to the power expressed. In the latest version, the power can be expressed as a function of the opening of the candle itself or as a function of the opening of the total candles before. There

**Presentando el Sistema Inteligente Binario: Tu Compañero Definitivo de Trading**
El Sistema Inteligente Binario no es solo un indicador; es una herramienta de trading sofisticada diseñada meticulosamente para empoderar a los traders con precisión precisa y señales oportunas en diversos mercados. Construido sobre una base de algoritmos de vanguardia y una exhaustiva colección de indicadores técnicos, este sistema es tu clave para desbloquear el éxito en el trading.
**Componentes del Indica
Using Standard Deviation but not sure if the Standard Deviation is high or low?
eRSD or Easy Relative Standard Deviation comes to your help. Using this you can get a ratio of Standard Deviation to Moving Average and make a good judgement about whether the Standard Deviation is useful or not.
Just add it to the chart and use it away - it supports all periods and moving average calculation methods through the input parameters.

El indicador "No repintado" está diseñado para analizar la dinámica del mercado y determinar momentos potenciales de señales de trading. La característica principal de este indicador es la ausencia de repintado de las señales, lo que contribuye a una predicción más precisa y confiable de los movimientos de precios en el mercado.
Mecanismo de Operación: El indicador "No repintado" utiliza varios tipos de elementos gráficos para indicar señales de trading: Flechas hacia arriba y hacia abajo: El

Hello Dear Trader, Today Im Telling You About The "Golden Scalp System V1 " Metatrader4 Golden Scalp System
Scalper with EMA This is a Scalper strategy based on ( Exponential moving average) EMA . Time frame: H1 Pair: EUR/USD, GBP/USD,AUD/USD XAU/USD
Platform Mt4 Indicators for Scalper with Ema: 300 EMA (Exponential Moving Average) ; 500 EMA (Expontial Moving Average); Stochastic (5,3,3) Long Entry
1) 300 EMA > 500 EMA .
2) Find significant levels of support.
3) Wait for

Introducing the POWER TRADE indicator created by a small group of traders with a few years trading trading the financial market profitably . This is a plug and play indicator that provides you with POWERFUL Entry signals with Profit Taking and rebound zones. The indicator Works with all MT4 trading instruments. The indicator uses previous chart data as receipt to speculate on future market moves.
The Power signals occurs on all timeframes. Though the signals occur more often on smaller tim
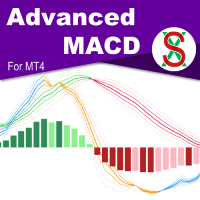
MACD ( M oving A verage C onvergence/ D ivergence) is a widely used indicator in technical analysis. What makes the MACD such a valuable tool for technical analysis is that it effectively combines two indicators into one. It can help to identify trends and measure momentum simultaneously. SX Advanced MACD for MT5 is available here . SX Advanced MACD indicator takes this concept further by plotting two distinct MACD indicators on a single chart, facilitating clear visual correlation between each
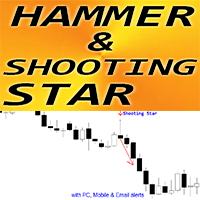
Indicador de Forex "Patrón de martillo y estrella fugaz" para MT4
El indicador "Patrón de martillo y estrella fugaz" es un indicador muy potente para el trading de acción del precio: sin repintado, sin demoras; El indicador detecta patrones de martillo alcista y estrella fugaz bajista en el gráfico: Martillo alcista: señal de flecha azul en el gráfico (ver imágenes) Estrella fugaz bajista: señal de flecha roja en el gráfico (ver imágenes) Se incluyen alertas para PC, móvil y correo electrónic

Revela Ideas de Trading con Auto Anchored VWAPs: Auto Anchored VWAPs actúan como tu compañero guía en el mundo del trading. Estos indicadores señalan puntos de giro cruciales del mercado y los representan en tu gráfico utilizando líneas VWAP. Esto marca un cambio significativo para los traders que emplean estrategias basadas en VWAP anclados. ¿Cómo Funciona? Identificando Puntos Altos: Si el precio más alto de la vela actual es menor que el precio más alto de la vela anterior, Y el alto anterior
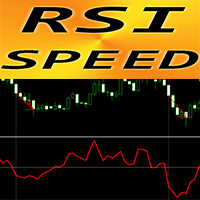
Indicador de Forex "RSI SPEED" para MT4: ¡una excelente herramienta predictiva!
El cálculo de este indicador se basa en ecuaciones de la física. RSI SPEED es la primera derivada del propio RSI RSI SPEED es bueno para hacer scalping en la dirección de la tendencia principal Úselo en combinación con un indicador de tendencia adecuado, por ejemplo, HTF MA (como en las imágenes) El indicador RSI SPEED muestra la rapidez con la que el propio RSI cambia su dirección: es muy sensible
Se recomienda

This is a combination of multiple oscillators into a single divergence system that creates the impression of a more reliable divergence indicator. It is multi-currency based and works best on 15 minutes timeframe and above. Every time a signal is generated, it shows an alert to the user. It is more ideal if combined with other price action indicators or trading systems.

Hidden Gap by MMD Hidden Gap by MMD is a unique indicator that detects hidden gaps between three consecutive candles. This observation isn't my own, but in the MMD methodology, it has its application alongside other original indicators. You can apply this indicator to the chart multiple times and set the interval from which you want to see the hidden gaps. You can show or hide these gaps as needed. For example, you can view the chart at an M5 interval and see hidden gaps from an M15 chart, etc.

El indicador MOST es un indicador muy popular que se utiliza en otras plataformas, especialmente para acciones e índices. La base son las medias móviles y los niveles alto-bajo. Puede ser apropiado utilizar el porcentaje de entrada como 2 para acciones e índices, y 1 - 1,5 para instrumentos forex. Puedes hacer tu propio ajuste para cada instrumento. Es un indicador fácil de usar, simple y sencillo. Es más común en gráficos de 1 hora y diarios. Por ahora solo he editado para la plataforma MT4, si
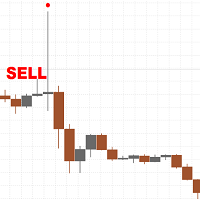
There are only a limited number of copies left, priced at 390 USD . After that, the price will be raised to 450 USD. I develop honest Indicators and know what can work in the market in the long term and what cannot. The classic and most powerful price action pattern is called the pin bar. This pattern works well after the release of fundamental news on M15, M30 and H1 timeframes, but can also be used on other timeframes such as M5 or D1. By default, the settings are set for the H1 timeframe,

Hey traders, it's easy for you to find when to buy or sell signals. Can be used for all forex pairs including gold. How to use this indicator on the M30 or H1 timeframe, for a buy signal, wait until an up arrow appears and for a sell signal, wait for a down arrow, place a stop loss 5-10 points below the arrow. Better trading time on the London and New York sessions and avoid trading when there is news. Happy Trading
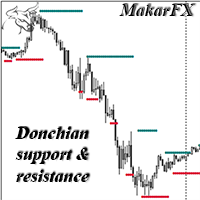
Support and resistance level indicator based on the Donchian channel. The most famous example of trading through the Donchian channel is an experiment with a group of turtles, who earned one hundred and twenty-five million dollars in five years. This indicator can be used as a standalone tool, as well as an additional confirmation. There is MTF, NRP. There are color and thickness settings.

This is a dashboard indicator that displays the auto-calculated risk lot, with the given risk percentage & risk points (Stop Loss) and others. The main function of this indicator is to help you calculate your exact scalping risk lots and swing risk lots. Also it displays the active trades of each pair you've executed with the following: type of trade, lot size, symbol, & equity(+/-). Also displays the bar counter set in every 5-minute bar timer. (whichever time frame you're active, the bar time

Простой и удобный индикатор, указывающий зоны стандартных индикаторов в различных таймфреймах, при необходимости можете в настройках изменить параметры RSI- Relative strength index. Стрелка вверх- если сигнальная линия ниже уровня 300, стрелка вниз- если сигнальная линия выше уровня 70 STOCH- Stochastic. Стрелка вверх- если сигнальная линия ниже уровня 20, стрелка вниз- если сигнальная линия выше уровня 80 ENVELOPE - Envelopes. Стрелка вверх- если свеча открылась ниже красной линии индика

This indicator shows when user set sessions are active and returns various tools + metrics using the closing price within active sessions as an input. Users have the option to change up to 4 session times.
The indicator will increasingly lack accuracy when the chart timeframe is higher than 1 hour.
Settings
Sessions
Enable Session: Allows to enable or disable all associated elements with a specific user set session.
Session Time: Opening and closing times of the user set session
Introducción: La "Zona de giro" es un indicador MT4 sofisticado e innovador diseñado para proporcionar a los operadores una poderosa herramienta para detectar posibles cambios de tendencia dentro de los mercados financieros. Al utilizar el concepto atemporal del análisis de horquilla, el indicador Turning Zone identifica las zonas clave de reversión donde es probable que cambie el sentimiento del mercado, ofreciendo a los operadores información valiosa para tomar decisiones informadas. Versión

This is a dashboard indicator that displays the Average Level of each selected currency pairs that filters and gives us a signal for overbought (>=90%) or if price at extreme peak above 90, and/or oversold (<=10%) or if price at extreme peak below 10.
The calculation is using Relative Strength Index default periods (2 & 9) applied to three different higher time frames H4,D1,&W1.
This won't change or altered even if you change symbol or switch to lower time frames or even in monthly and y

The Donchian Scanner Signals Indicator with is a powerful tool designed for traders operating in the financial market using the Metatrader 4 platform. This indicator combines the popular Donchian Channels strategy with advanced signalization and real-time alert features, providing a clear view of potential entry and exit points in a financial asset. Key Features: Donchian Channels Visualization: The indicator graphically displays Donchian Channels on the price chart. These channels are formed us
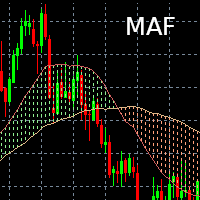
Indicateur Moving Average Filling Affiche deux moyennes mobiles (une courte et une longue) dont la durée et le type (Simple, exponentielle) est paramétrable. L'espace entre les deux moyennes mobiles est alors colorié (rempli) :
- Vert si courte > longue
- Rouge si courte < longue Il est possible de changer les couleurs selon les préférences de chacun / chacune.
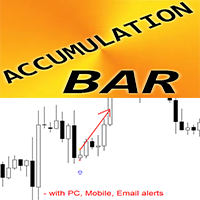
Indicador Forex Patrón de barra de acumulación para MT4
El indicador "Barra de acumulación" es un indicador muy potente enfocado en rupturas para el trading de acción del precio El indicador detecta la acumulación de precios en un área estrecha durante 1 barra y muestra: Dirección de ruptura, Orden pendiente y ubicaciones de SL Barra de acumulación alcista: señal de flecha azul en el gráfico (ver imágenes) Barra de acumulación bajista: señal de flecha roja en el gráfico (ver imágenes) Sin rep
Please feel free to contact me if you need any further information.
Please let me know if you have any questions.
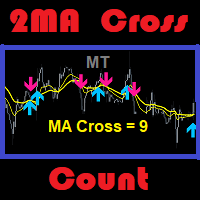
I hope the above is useful to you. MT 2ma Cross Count : is a moving average with 2 lines crossing but the strategy is to focus on the desired number of history bars and count signals that occur. Suitable for traders specialize in martingale strategy or traders specialize in technical ... etc. Traders with the ability to do fundamental analysis have an advantage. Because it will ma
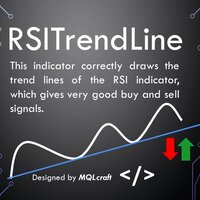
RSI Trend Lines Indicator - Identify Optimal Buying and Selling Opportunities Introduction :
The RSI Trend Lines Indicator is a powerful tool designed to assist traders in identifying optimal buying and selling opportunities based on the Relative Strength Index (RSI) oscillator. This advanced indicator draws trend lines on the RSI chart using multiple points, providing valuable insights into potential market trends and reversals. By leveraging the RSI Trend Lines Indicator, traders can enhance

Perfect for one minutes high trading and scalping. This indicator is very effective for trading on one minutes, in the hour. A combination of moving averages and STOCHASTICS calculation to produce a very convincing signal every hour. Blue colour signals a buy opportunity. Follow the X signs for possible buy points. The Blue average line serves as possible trend direction and support. Red colour signals a sell opportunity. Follow the X signs for possible sell points. The Red average line serves a
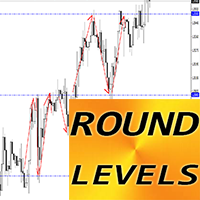
Indicador Forex "Niveles redondos" para MT4
El indicador "Niveles redondos" es un indicador auxiliar imprescindible para los operadores que toman en consideración el soporte/resistencia. Los niveles redondos son muy respetados por el precio: el precio rebota muy a menudo desde los niveles redondos. Utilice el paso de 1000 puntos para los períodos de tiempo H4, D1 Utilice el paso de 500 puntos para el primer semestre y períodos de tiempo inferiores (para operaciones intradiarias) Además, los n

Bienvenido al mundo del comercio avanzado con el Super Indicador Comercial FxBears. Diseñada exclusivamente para la plataforma MT4, esta innovadora herramienta combina el poder de Elliott Waves, zonas de oferta y demanda e indicadores internos para proporcionar a los operadores señales de alta calidad para tomar decisiones comerciales informadas. Con un historial de tasa de éxito de más del 90%, FxBears Super aporta un nuevo nivel de precisión y rentabilidad a su estrategia comercial. De Corse

"Este indicador detecta las entradas basadas en la teoría del patrón Bystra y proporciona valores de entrada para colocar órdenes limitadas con niveles de objetivo y stop. Esto te permite calcular tu porcentaje de riesgo. Notas: Este indicador tiene buffers que permiten su uso en Asesores Expertos (EAs). Es importante practicar una buena gestión de dinero mientras trabajas con este producto. Cuando cambias tu marco de tiempo, El indicador guardará la plantilla usada en tu última sesión. Si neces
El Mercado MetaTrader es una plataforma única y sin análogos en la venta de robots e indicadores técnicos para traders.
Las instrucciones de usuario MQL5.community le darán información sobre otras posibilidades que están al alcance de los traders sólo en nuestro caso: como la copia de señales comerciales, el encargo de programas para freelance, cuentas y cálculos automáticos a través del sistema de pago, el alquiler de la potencia de cálculo de la MQL5 Cloud Network.
Está perdiendo oportunidades comerciales:
- Aplicaciones de trading gratuitas
- 8 000+ señales para copiar
- Noticias económicas para analizar los mercados financieros
Registro
Entrada
Si no tiene cuenta de usuario, regístrese
Para iniciar sesión y usar el sitio web MQL5.com es necesario permitir el uso de Сookies.
Por favor, active este ajuste en su navegador, de lo contrario, no podrá iniciar sesión.