Kostenpflichtige technische Indikatoren für den MetaTrader 4 - 99

Multicurrency indicator in table format. Signals appear with confirmation, do not redraw. The indicator works on the current (open) timeframe. Notifications come for an open instrument. The strategy includes: price touching the moving average in the direction of the trend, as well as an extraordinary recalculation of the classic ADX indicator to determine the trend as an additional filtering of entries. Entries are displayed on the chart as arrows and, as mentioned above, the arrows are not redr

The indicator shows the Buy/Sell direction. The calculations use the opening prices and their rate of change for the billing period - "Calculation period" MTF indicator - "Calculation timeframe", no repaint - NRP. Two display types: "Chart default" или "Chart color" For "Chart color" color customization available : "Bar color" Two types stop levels: "Simple stop level" or "Dynamic stop level " Color settings: "Stop level color" Alerts available: "Chart message", "Push message", "Email message" F

Indikator mit einem Gewinnraten-Berechnungssystem ausgestattet [Anzeigefunktionen] Mit diesem Indikator können Sie regelmäßige technische Analysen intuitiv und einfach mit Vorzeichensignalen bestätigen. Darüber hinaus kann es die Win-Rate der aktuellen Parameter überprüfen und verfügt über ein automatisches Win-Rate-Ermittlungssystem, das es vermeidet, Signale zu geben, wenn die Win-Rate niedrig ist. Dies reduziert unnötige Eingaben und ermöglicht es Ihnen, Trades nur dann einzugeben, wenn di
Candle Scanner Dashboard is an incredibly powerful tool in the financial markets. It excels at detecting market reversals, trend changes, and retracements. The dashboard displays patterns as they are identified, and with a simple click on each pattern, you can view them on their dedicated charts to precisely locate their occurrences. With its capability to detect 11 popular bullish and 11 bearish patterns, you can trust the dashboard to handle pattern identification effortlessly. It provides an

Indikator mit einem Gewinnraten-Berechnungssystem ausgestattet [Anzeigefunktionen] Dieser Indikator ermöglicht eine intuitive und einfache Bestätigung regelmäßiger technischer Analysen durch Vorzeichensignale. Darüber hinaus kann es die Angemessenheit der aktuellen Parameter überprüfen, indem es die Gewinnrate verifiziert, und verfügt über ein automatisches Gewinnraten-Ermittlungssystem, das keine Signale generiert, wenn die Gewinnrate niedrig ist. Dies reduziert unnötige Eingaben und ermögli

Indikator mit einem Gewinnraten-Berechnungssystem ausgestattet [Anzeigefunktionen] Dieser Indikator ermöglicht eine intuitive und einfache Bestätigung regelmäßiger technischer Analysen durch Vorzeichensignale. Darüber hinaus kann es die Angemessenheit der aktuellen Parameter überprüfen, indem es die Gewinnrate verifiziert, und verfügt über ein automatisches Gewinnraten-Ermittlungssystem, das keine Signale generiert, wenn die Gewinnrate niedrig ist.Dies reduziert unnötige Eingaben und ermöglic

Indikator mit einem Gewinnraten-Berechnungssystem ausgestattet [Anzeigefunktionen] Dieser Indikator ermöglicht eine intuitive und einfache Bestätigung regelmäßiger technischer Analysen durch Vorzeichensignale. Darüber hinaus kann es die Angemessenheit der aktuellen Parameter überprüfen, indem es die Gewinnrate verifiziert, und verfügt über ein automatisches Gewinnraten-Ermittlungssystem, das keine Signale generiert, wenn die Gewinnrate niedrig ist. Dies reduziert unnötige Eingaben und ermögli

Indikator mit einem Gewinnraten-Berechnungssystem ausgestattet [Anzeigefunktionen] Dieser Indikator ermöglicht eine intuitive und einfache Bestätigung regelmäßiger technischer Analysen durch Vorzeichensignale. Darüber hinaus kann es die Angemessenheit der aktuellen Parameter überprüfen, indem es die Gewinnrate verifiziert, und verfügt über ein automatisches Gewinnraten-Ermittlungssystem, das keine Signale generiert, wenn die Gewinnrate niedrig ist. Dies reduziert unnötige Eingaben und ermögli

Indikator mit einem Gewinnraten-Berechnungssystem ausgestattet [Anzeigefunktionen] Dieser Indikator ermöglicht eine intuitive und einfache Bestätigung regelmäßiger technischer Analysen durch Vorzeichensignale. Darüber hinaus kann es die Angemessenheit der aktuellen Parameter überprüfen, indem es die Gewinnrate verifiziert, und verfügt über ein automatisches Gewinnraten-Ermittlungssystem, das keine Signale generiert, wenn die Gewinnrate niedrig ist. Dies reduziert unnötige Eingaben und ermögli

Indikator mit einem Gewinnraten-Berechnungssystem ausgestattet [Anzeigefunktionen] Dieser Indikator ermöglicht eine intuitive und einfache Bestätigung regelmäßiger technischer Analysen durch Vorzeichensignale. Darüber hinaus kann es die Angemessenheit der aktuellen Parameter überprüfen, indem es die Gewinnrate verifiziert, und verfügt über ein automatisches Gewinnraten-Ermittlungssystem, das keine Signale generiert, wenn die Gewinnrate niedrig ist. Dies reduziert unnötige Eingaben und ermögli

Indikator mit Win-Rate-Berechnungssystem [Anzeigefunktionen] Dieser Indikator ermöglicht eine intuitive und klare Bestätigung der regelmäßigen technischen Analyse durch Vorzeichensignale. Darüber hinaus kann es die Angemessenheit der aktuellen Parameter anhand der Gewinnrate überprüfen und verfügt über ein automatisches System zur Bestimmung der Gewinnrate, das keine Signale generiert, wenn die Gewinnrate niedrig ist. Dies reduziert unnötige Eingaben und ermöglicht die Teilnahme nur in Zeiten

Indikator mit Win-Rate-Berechnungssystem [Anzeigefunktionen] Dieser Indikator ermöglicht es Händlern, regelmäßige technische Analysen durch Vorzeichensignale intuitiv und klar zu bestätigen. Darüber hinaus kann es anhand der Gewinnrate überprüfen, ob die aktuellen Parameter angemessen sind, und es verfügt über ein automatisches System zur Bestimmung der Gewinnrate, das keine Signale generiert, wenn die Gewinnrate niedrig ist. Dies reduziert unnötige Eingaben und ermöglicht die Teilnahme nur i

Indikator mit Win-Rate-Berechnungssystem [Anzeigefunktionen] Dieser Indikator ermöglicht es Händlern, regelmäßige technische Analysen durch Vorzeichensignale intuitiv und klar zu bestätigen. Darüber hinaus kann es anhand der Gewinnrate überprüfen, ob die aktuellen Parameter angemessen sind, und es verfügt über ein automatisches System zur Bestimmung der Gewinnrate, das keine Signale generiert, wenn die Gewinnrate niedrig ist. Dies reduziert unnötige Eingaben und ermöglicht die Teilnahme nur i

Indikator mit Win-Rate-Berechnungssystem [Anzeigefunktionen] Dieser Indikator ermöglicht es Händlern, regelmäßige technische Analysen durch Vorzeichensignale intuitiv und klar zu bestätigen. Darüber hinaus kann es anhand der Gewinnrate überprüfen, ob die aktuellen Parameter angemessen sind, und es verfügt über ein automatisches System zur Bestimmung der Gewinnrate, das keine Signale generiert, wenn die Gewinnrate niedrig ist. Dies reduziert unnötige Eingaben und ermöglicht die Teilnahme nur i

Indikator mit Win-Rate-Berechnungssystem ausgestattet 【Anzeigefunktionen】 Mit diesem Indikator können Sie die normale technische Analyse durch Signalzeichen intuitiv und klar bestätigen. Darüber hinaus verfügt es über ein automatisches System zur Bestimmung der Gewinnrate, das prüft, ob die aktuellen Parameter geeignet sind, und die Ausgabe von Signalen vermeidet, wenn die Gewinnrate niedrig ist. Dies reduziert unnötige Eingaben und ermöglicht es Ihnen, Trades nur dann einzugeben, wenn die Ge

12 Arten der technischen Analyse inklusive! Indikator mit Win-Rate-Berechnungssystem ausgestattet 【Anzeigefunktionen】 Mit diesem Indikator können Sie 12 Arten normaler technischer Analysen anhand von Signalzeichen intuitiv und klar bestätigen. Darüber hinaus verfügt es über ein automatisches System zur Bestimmung der Gewinnrate, das prüft, ob die aktuellen Parameter geeignet sind, und die Ausgabe von Signalen vermeidet, wenn die Gewinnrate niedrig ist. Dies reduziert unnötige Eingaben und erm

VWAP Scanner is a multi-timeframe and multi-symbol dashboard and alert that checks all timeframes and symbols to find trading Opportunities based on Vwap Indicator
How to USE VWAP Scanner
First make a text file with name of Symbols Under Terminal\MQL4\Files
Write the name of symbols as its on mt4 with (,) to separate
Example :
EURUSD,USDJPY,USDCAD,GBPUSD,MCRO,MGLD,NIFTY Note- Its works in all Market And save this text file
Inputs of scanner
NameOfSymbolsTextFile = "Symbols

Indicator UU Bands สำหรับเทรดเดอร์ ที่ต้องการความแม่นยำ ในการเข้าเทรด หรือ หาจังหวะในการเข้าเทรด
ใช้ได้กับทุก ทามเฟรม
ข้อมูลของ อินดิเคเตอร์ 1. มี แบนด์ ด้วยกันทั้งหมด 7 เส้น 2. เส้น 3 เส้น ด้านบน เป็นแนวต้าน เคลื่อนที่ แนวต้านที่1 แนวต้านที่ 2 แนวต้านที่3 3. เส้น 3 เส้น ด้านล่าง เป็นแนวรับ เคลื่อนที่ แนวรับที่ 1 แนวรับที่ 2 แนวรับที่ 3 4. เส้นตรงกลาง เป็นเส้นแบ่ง เทรน สีเขียว หมายถึง แนวโน้มขึ้น สีแดง หมายถึง แนวโน้มลง 5. สัญลักษณ์ ลูกศร สามารถนำไปอ้างอิง เป็นจุดเข้าเทรดได้
คำแนะสำหรับกา
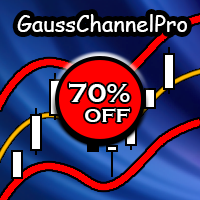
MT5 Version GaussChannelPro is a powerful and innovative trading indicator designed to enhance your trading strategy with the precision of Gaussian-based channels. Leveraging the principles of Gaussian (normal) distribution, this indicator creates a unique channel on your price chart, offering valuable insights into market trends and potential turning points. Utilizing advanced statistical analysis, GaussChannelPro calculates the optimal channel boundaries based on historical price data, present

Global Trend Lines
The Buy/Sell Zone Indicator possesses several features that can be used to improve your trading strategy. This indicator helps you identify buy zones and sell zones on the chart. The main features of this indicator are as follows: Identifying Trend Levels: The indicator has algorithms used to identify trend levels. This helps you determine the direction and strength of the trend. Marking Buy and Sell Zones: The indicator marks buy zones and sell zones on the chart. This ass

In der Welt des Handels mit binären Optionen, wo präzise Marktanalyse und strategische Entscheidungsfindung von größter Bedeutung sind, ist die Suche nach einem außergewöhnlichen Handelsindikator, der profitable Möglichkeiten erschließen kann, endlos. Treten Sie ein in den Secret Indicator - ein bemerkenswertes MT4-Handelstool für binäre Optionen, das seinen Ruf als das Beste und Stärkste in seiner Klasse erworben hat.
Der Secret Indicator ist das Ergebnis jahrelanger akribischer Forschung, E
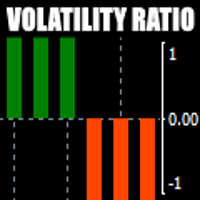
There is always a need to measure if the market is "quiet" or it is volatile. One of the possible way is to use standard deviations, but the issue is simple : We do not have some levels that could help us find out if the market is in a state of lower or higher volatility.
This indicator is attempting to do that : • values above level 0 are indicating state of higher volatility (=GREEN buffer) • values below level 0 are indicating state of lower volatility (=RED buffer)
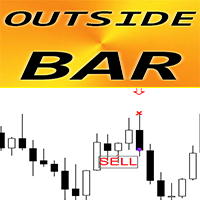
Forex Indicator OUTSIDE Bar Pattern for MT4 Indicator " OUTSIDE Bar " is very powerful indicator for Price Action trading : No repaint, No delays; Indicator detects OUTSIDE Bar patterns on chart: Bullish OUTSIDE Bar - Blue arrow signal on chart (see pictures) Bearish OUTSIDE Bar - Red arrow signal on chart (see pictures) P C, Mobile & Email alerts are included Indicator " OUTSIDE Bar Pattern " is excellent to combine with Support/Resistance Levels: https://www.mql5.com/

Wir stellen Ihnen PivotXpert vor, einen fortschrittlichen Multichart- Indikator, der Ihre Pivot-Point-Strategie verbessern soll. Schöpfen Sie sein Potenzial mühelos aus, mit einer intuitiven Benutzeroberfläche, die den Pivot-Handel zum Kinderspiel macht.
Der Multichart-Modus von PivotXpert vereinfacht Ihren Handel durch das Zeichnen von Pivot-Linien auf allen offenen Charts. Berechnen Sie die verbleibenden Pips für jedes Level mühelos mit der Funktion „Pips berechnen“ und optimieren S

Индикатор показывает точки входа. Индикатор не перерисовывает и не исчезает в истории. Индикатор может служить дополнением вашей торговой стратегии. При желание можно настроить индикатор как на агрессивную торговлю( но в этом случае будет много ложных сигналов) так же на пассивную торговлю. Хорошие показатели индикатор показывает сигналы на валютной паре GBPUSD на минутном таймфрейме.

Strength of 8 popular currencies (EUR, GBP, USD, CAD, AUD, NZD, CHF, JPY) is calculated from 28 pairs of Forex market following a Moving Average with custom period and method. You can use it by adding 2 indicators to the chart of Forex pair based on the pair currencies and use it as a confirmation on your strategies.
Currencies: EUR, GBP, USD, CAD, AUD, NZD, CHF, JPY
Inputs: Currency: 1 of the 8 currencies MA Period: Period of Moving Average MA Method: Method of Moving Average (SMA, EMA, S

Introducing the "Ultimate Non Repaint Smart" Indicator - An intelligent non-repaint trading system.
Product Overview:
The "Ultimate Non Repaint Smart" Indicator is a powerful tool designed for traders on the MT4 platform, assisting in optimizing market analysis and trade decision-making. With the combination of various indicators and smart systems, this indicator not only helps identify potential buy and sell points but also provides reliable trading signals.
Key Features:
Non-Repaint S

This is an advanced index algorithm, it provides a very accurate top-bottom signal, it will not frequently appear the wrong signal during the trend, this index does not have any redrawing, drift, or lag behavior. When this signal appears on the chart, it means that the market is about to reverse, or that a period of trend market is over, and then the market will be transformed into a consolidation market, and this indicator does not need to adjust the parameters. It applies to any currency pai

This indicator is very advanced. I dare say that there is no second indicator in the world that describes false breakthroughs so accurately. When the market hits a certain level three times in a row, the market will first break through this level and then return to the inside of the horizontal line. At this time, our indicator will send a signal to alarm that this is a standard fake breakthrough, the index has not been redrawn, the signal has not been delayed, and everything is true and reliable
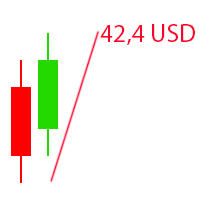
The Visual Result Calculator Indicator is a powerful tool designed to enhance your trading experience on the MetaTrader platform. This intuitive and user-friendly indicator allows you to visualize potential profits or losses on a trading chart, helping you make better-informed decisions and manage your trades with precision. The Indicator displays a dynamic line on the trading chart, representing the potential profit or loss of a trade based on the start and end of the line. Simply click and d

PowerXXX measures the power of the current candlestick and displays it in numerical format and colors. The indicator can cover multiple timeframes and can be placed on the main chart or on the charts of the underlying indicators. The number of timeframes is selectable, as well as the color levels according to the power expressed. In the latest version, the power can be expressed as a function of the opening of the candle itself or as a function of the opening of the total candles before. There

**Vorstellung des Binary Smart Systems: Ihr ultimativer Handelsbegleiter**
Das Binary Smart System ist nicht nur ein Indikator; es ist ein ausgeklügeltes Handelswerkzeug, das sorgfältig entwickelt wurde, um Händlern eine punktgenaue Genauigkeit und rechtzeitige Signale in verschiedenen Märkten zu bieten. Aufgebaut auf einer Grundlage aus hochmodernen Algorithmen und einer umfassenden Sammlung von technischen Indikatoren ist dieses System der Schlüssel, um Handelserfolg zu entfesseln.
**Best
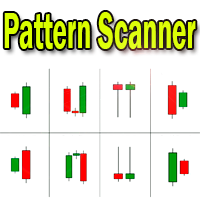
Candlestick pattern indicator - display found candlestick patterns on the chart. MT5-version: https://www.mql5.com/en/market/product/103134 Bearish patterns: Bearish Pattern Designations Pattern name SS
Shooting Star STR(S) Evening Star DJ(E) Evening Doji Star DC Dark Cloud Veil BEP Bearish Engulfing Bullish patterns: Designation of bullish patterns Pattern name HMR
Hammer pattern
STR(M) Morning Star DJ(M) Morning Doji Star PRL Piercing Line BEP Bulli
Using Standard Deviation but not sure if the Standard Deviation is high or low?
eRSD or Easy Relative Standard Deviation comes to your help. Using this you can get a ratio of Standard Deviation to Moving Average and make a good judgement about whether the Standard Deviation is useful or not.
Just add it to the chart and use it away - it supports all periods and moving average calculation methods through the input parameters.

Der Indikator "No repaint" wurde entwickelt, um die Marktdynamik zu analysieren und potenzielle Handelssignale zu bestimmen. Das Hauptmerkmal dieses Indikators ist das Fehlen von Signalüberlagerungen, was zu einer präziseren und zuverlässigeren Prognose der Preisbewegungen auf dem Markt beiträgt.
Funktionsweise: Der Indikator "No repaint" verwendet verschiedene Arten von grafischen Elementen, um Handelssignale anzuzeigen: Pfeile nach oben und unten: Der Indikator markiert mögliche Markteint

Hello Dear Trader, Today Im Telling You About The "Golden Scalp System V1 " Metatrader4 Golden Scalp System
Scalper with EMA This is a Scalper strategy based on ( Exponential moving average) EMA . Time frame: H1 Pair: EUR/USD, GBP/USD,AUD/USD XAU/USD
Platform Mt4 Indicators for Scalper with Ema: 300 EMA (Exponential Moving Average) ; 500 EMA (Expontial Moving Average); Stochastic (5,3,3) Long Entry
1) 300 EMA > 500 EMA .
2) Find significant levels of support.
3) Wait for

Introducing the POWER TRADE indicator created by a small group of traders with a few years trading trading the financial market profitably . This is a plug and play indicator that provides you with POWERFUL Entry signals with Profit Taking and rebound zones. The indicator Works with all MT4 trading instruments. The indicator uses previous chart data as receipt to speculate on future market moves.
The Power signals occurs on all timeframes. Though the signals occur more often on smaller tim
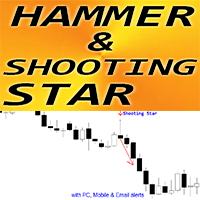
Forex Indicator " Hammer and Shooting Star pattern" for MT4 Indicator " Hammer and Shooting Star pattern " is very powerful indicator for Price Action trading : No repaint, No delays; Indicator detects bullish Hammer and bearish Shooting Star patterns on chart: Bullish Hammer - Blue arrow signal on chart (see pictures) Bearish Shooting Star - Red arrow signal on chart (see pictures) P C, Mobile & Email alerts are included Indicator " Hammer and Shooting Star pattern" is excel

**"Support and Resistance Breakout" Indicator for MetaTrader 4 (MT4)**
Hello traders and investors on the MetaTrader 4 (MT4) platform,
We are excited to introduce to you the "Support and Resistance Breakout" indicator - a powerful tool designed for MT4 that helps you capitalize on trading opportunities involving support and resistance breakouts effectively and confidently.
**Overview:**
The "Support and Resistance Breakout" indicator is a custom tool built on the MetaTrader 4 platform,

Welcome to the "Keltner Amplified Breakout" Indicator Are you searching for a powerful and effective trading tool on the MT4 platform? Let us introduce you to the "Keltner Amplified Breakout" Indicator. Designed to help you capture potential trading opportunities, this indicator offers the perfect blend of high performance and user-friendliness. Key Advantages: Identify Strong Trends: This indicator utilizes Keltner channels and fractal signals to identify robust upward or downward trends in
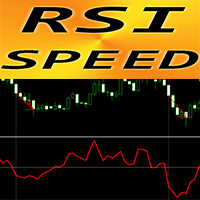
Forex Indicator "RSI SPEED" for MT4 - great predictive tool! The calculation of this indicator is based on equations from physics . RSI SPEED is the 1st derivative of RSI itself RSI SPEED is good for scalping entries into the direction of main trend Use it in combination with suitable trend indicator , for example HTF MA (as on pictures) RSI SPEED indicator shows how fast RSI itself changes its direction - it is very sensitive It is recommended to use RSI SPEED indicator fo

Hierbei handelt es sich um eine Kombination mehrerer Oszillatoren in einem einzigen Divergenzsystem, die den Eindruck eines zuverlässigeren Divergenzindikators erweckt. Es basiert auf mehreren Währungen und funktioniert am besten bei einem Zeitrahmen von 15 Minuten und mehr. Jedes Mal, wenn ein Signal generiert wird, wird dem Benutzer eine Warnung angezeigt. Idealer ist es, wenn es mit anderen Preisaktionsindikatoren oder Handelssystemen kombiniert wird.

Hidden Gap by MMD Hidden Gap by MMD is a unique indicator that detects hidden gaps between three consecutive candles. This observation isn't my own, but in the MMD methodology, it has its application alongside other original indicators. You can apply this indicator to the chart multiple times and set the interval from which you want to see the hidden gaps. You can show or hide these gaps as needed. For example, you can view the chart at an M5 interval and see hidden gaps from an M15 chart, etc.

Hallo,
Sind Sie auf der Suche nach einer optimalen Lösung, um Gewinne aus dem Finanzmarkt auf der MetaTrader 4 (MT4) Plattform zu generieren? Wir stellen vor: "Sonic R Non Repaint Smart" - ein intelligentes Handelssystem, das Genauigkeit und Effizienz für Trader bietet.
Vorstellung von "Sonic R Non Repaint Smart":
"Sonic R Non Repaint Smart" ist ein robustes Handelsindikator, der auf der hoch angesehenen Sonic R Handelsstrategie aufbaut. Wir bieten stolz eine Lösung an, die nicht nur dabe

Der MOST-Indikator ist ein sehr beliebter Indikator, der auf anderen Plattformen verwendet wird, insbesondere für Aktien und Indizes. Die Basis bilden gleitende Durchschnitte und Hoch-Tief-Niveaus. Es kann sinnvoll sein, die prozentuale Eingabe als 2 für Aktien und Indizes und 1 bis 1,5 für Forex-Instrumente zu verwenden. Sie können für jedes Instrument Ihre eigene Anpassung vornehmen. Es handelt sich um einen benutzerfreundlichen, einfachen und einfachen Indikator. Es kommt häufiger in 1-Stunde
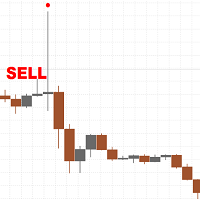
There are only a limited number of copies left, priced at 390 USD . After that, the price will be raised to 450 USD. I develop honest Indicators and know what can work in the market in the long term and what cannot. The classic and most powerful price action pattern is called the pin bar. This pattern works well after the release of fundamental news on M15, M30 and H1 timeframes, but can also be used on other timeframes such as M5 or D1. By default, the settings are set for the H1 timeframe,

Hey traders, it's easy for you to find when to buy or sell signals. Can be used for all forex pairs including gold. How to use this indicator on the M30 or H1 timeframe, for a buy signal, wait until an up arrow appears and for a sell signal, wait for a down arrow, place a stop loss 5-10 points below the arrow. Better trading time on the London and New York sessions and avoid trading when there is news. Happy Trading
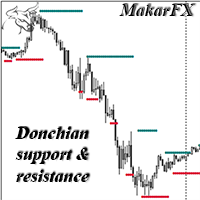
Support and resistance level indicator based on the Donchian channel. The most famous example of trading through the Donchian channel is an experiment with a group of turtles, who earned one hundred and twenty-five million dollars in five years. This indicator can be used as a standalone tool, as well as an additional confirmation. There is MTF, NRP. There are color and thickness settings.

This is a dashboard indicator that displays the auto-calculated risk lot, with the given risk percentage & risk points (Stop Loss) and others. The main function of this indicator is to help you calculate your exact scalping risk lots and swing risk lots. Also it displays the active trades of each pair you've executed with the following: type of trade, lot size, symbol, & equity(+/-). Also displays the bar counter set in every 5-minute bar timer. (whichever time frame you're active, the bar time

Простой и удобный индикатор, указывающий зоны стандартных индикаторов в различных таймфреймах, при необходимости можете в настройках изменить параметры RSI- Relative strength index. Стрелка вверх- если сигнальная линия ниже уровня 300, стрелка вниз- если сигнальная линия выше уровня 70 STOCH- Stochastic. Стрелка вверх- если сигнальная линия ниже уровня 20, стрелка вниз- если сигнальная линия выше уровня 80 ENVELOPE - Envelopes. Стрелка вверх- если свеча открылась ниже красной линии индика

This indicator shows when user set sessions are active and returns various tools + metrics using the closing price within active sessions as an input. Users have the option to change up to 4 session times.
The indicator will increasingly lack accuracy when the chart timeframe is higher than 1 hour.
Settings
Sessions
Enable Session: Allows to enable or disable all associated elements with a specific user set session.
Session Time: Opening and closing times of the user set session
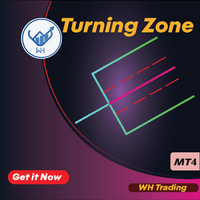
Einführung:
Die „Turning Zone“ ist ein hochentwickelter und innovativer MT4-Indikator, der Händlern ein leistungsstarkes Tool zur Erkennung potenzieller Trendumkehrungen auf den Finanzmärkten bietet. Durch die Nutzung des zeitlosen Konzepts der Pitchfork-Analyse identifiziert der Turning Zone-Indikator wichtige Umkehrzonen, in denen sich die Marktstimmung wahrscheinlich ändern wird, und bietet Händlern wertvolle Einblicke, um fundierte Entscheidungen zu treffen. MT5-Version : WH Turning Zon

This is a dashboard indicator that displays the Average Level of each selected currency pairs that filters and gives us a signal for overbought (>=90%) or if price at extreme peak above 90, and/or oversold (<=10%) or if price at extreme peak below 10.
The calculation is using Relative Strength Index default periods (2 & 9) applied to three different higher time frames H4,D1,&W1.
This won't change or altered even if you change symbol or switch to lower time frames or even in monthly and y

The Donchian Scanner Signals Indicator with is a powerful tool designed for traders operating in the financial market using the Metatrader 4 platform. This indicator combines the popular Donchian Channels strategy with advanced signalization and real-time alert features, providing a clear view of potential entry and exit points in a financial asset. Key Features: Donchian Channels Visualization: The indicator graphically displays Donchian Channels on the price chart. These channels are formed us
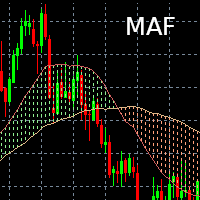
Indicateur Moving Average Filling Affiche deux moyennes mobiles (une courte et une longue) dont la durée et le type (Simple, exponentielle) est paramétrable. L'espace entre les deux moyennes mobiles est alors colorié (rempli) :
- Vert si courte > longue
- Rouge si courte < longue Il est possible de changer les couleurs selon les préférences de chacun / chacune.
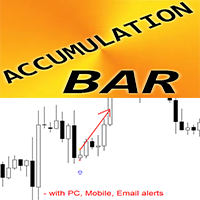
Forex Indicator Accumulation Bar Pattern for MT4 Indicator " Accumulation Bar " is very powerful breakout-focused indicator for Price Action trading Indicator detects price accumulation in narrow area during 1 bar and shows: Breakout direction, Pending order and SL locations Bullish Accumulation Bar - Blue arrow signal on chart (see pictures) Bearish Accumulation Bar - Red arrow signal on chart (see pictures) No repaint; No delays; High R/R ratio (reward/risk); I ndicator has adjustab

**Breakout Box Indikator für MT4 - Effiziente Handelsmöglichkeiten entdecken**
Grüße, geschätzte Trader,
Wir freuen uns, Ihnen den Breakout Box Indikator in der Version 2.0 vorzustellen - ein leistungsstarkes und präzises Handelstool, das von KPRO entwickelt wurde. Dies ist ein wertvolles Instrument, das Ihnen hilft, Handelsmöglichkeiten im Forex-Markt zu erfassen, Ihre Gewinne zu optimieren und gleichzeitig Risiken zu minimieren.
**Hauptmerkmale:**
1. **Effizientes Breakout-Trading:**
Please feel free to contact me if you need any further information.
Please let me know if you have any questions.
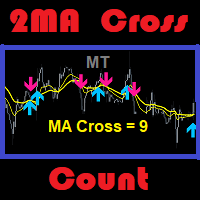
I hope the above is useful to you. MT 2ma Cross Count : is a moving average with 2 lines crossing but the strategy is to focus on the desired number of history bars and count signals that occur. Suitable for traders specialize in martingale strategy or traders specialize in technical ... etc. Traders with the ability to do fundamental analysis have an advantage. Because it will ma
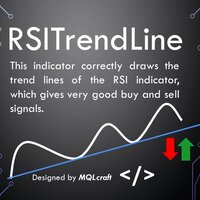
RSI Trendlinienindikator - Identifizieren Sie optimale Kauf- und Verkaufsmöglichkeiten Einführung:
Der RSI Trendlinienindikator ist ein leistungsstarkes Werkzeug, das Händlern dabei hilft, optimale Kauf- und Verkaufsmöglichkeiten auf der Grundlage des Relative Strength Index (RSI) Oszillators zu identifizieren. Dieser fortschrittliche Indikator zeichnet Trendlinien auf den RSI-Chart unter Verwendung mehrerer Punkte, um wertvolle Einblicke in potenzielle Markttrends und Umkehrungen zu liefern. D

Perfect for one minutes high trading and scalping. This indicator is very effective for trading on one minutes, in the hour. A combination of moving averages and STOCHASTICS calculation to produce a very convincing signal every hour. Blue colour signals a buy opportunity. Follow the X signs for possible buy points. The Blue average line serves as possible trend direction and support. Red colour signals a sell opportunity. Follow the X signs for possible sell points. The Red average line serves a
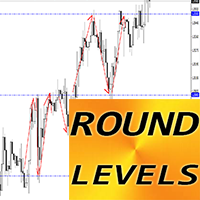
Forex Indicator "Round Levels" for MT4 Indicator "Round Levels" is must have auxiliary indicator for traders who take support/resistance into consideration Round Levels are respected by the price very much - price rebounds from round levels very often Use 1000 points Step for H4, D1 time frames U se 500 points Step for H1 and lower time frames (for intraday trading) Also Round levels are good to allocate Take Profits (in front of round level) and SL (behind the round level) These levels are ver

Willkommen in der Welt des fortgeschrittenen Handels mit dem FxBears Super Trading Indicator. Dieses innovative Tool wurde exklusiv für die MT4-Plattform entwickelt und kombiniert die Leistungsfähigkeit von Elliott-Wellen, Angebots- und Nachfragezonen sowie internen Indikatoren, um Händlern hochwertige Signale für fundierte Handelsentscheidungen zu liefern. Mit einer Erfolgsquote von über 90 % bringt FxBears Super ein neues Maß an Präzision und Rentabilität in Ihre Handelsstrategie. Natürlich k

"Dieser Indikator erkennt Einträge basierend auf der Bystra-Muster-Theorie und liefert Einstiegswerte zur Platzierung von Limit-Orders mit Ziel- und Stopp-Levels. Dies ermöglicht es Ihnen, Ihr Risikoprozentsatz zu berechnen. Anmerkungen: Dieser Indikator verfügt über Puffer, die seine Verwendung in Expert Advisors (EAs) ermöglichen. Es ist wichtig, beim Arbeiten mit diesem Produkt eine gute Geldverwaltung zu praktizieren. Wenn Sie Ihren Zeitrahmen ändern, wird der Indikator die in Ihrer letzten

Market Profile Heat indicator — is a classic Market Profile implementation that can show the price density over time, outlining the most important price levels, value area, and control value of a given trading session.
This indicator can be attached to timeframes between M1 and D1 and will show the Market Profile for daily, weekly, monthly, or even intraday sessions. Lower timeframes offer higher precision. Higher timeframes are recommended for better visibility. It is also possible to use a f

Introducing the "Zone of Supply and Demand Pro" Indicator - Redefining Precision with Multi-Time Frame (MTF) Technology and Non-Repaint Capability
In the intricate world of financial markets, understanding supply and demand can be the key to success. We are excited to present the "Zone of Supply and Demand Pro" - a powerful analytical tool designed not only to help you seize trading opportunities but also to ensure unparalleled accuracy through groundbreaking technology.
**The Significance

Rapid Trend is a technical analysis indicator that determines the direction and strength of a trend, and also signals a trend change. Allows you to determine the current trend. With the help of its algorithm, you can quickly understand what kind of trend is currently developing in the market. Rapid Trend can be used along with oscillators as filters. Setting up the Rapid Trend forex indicator allows you to receive more accurate signals for opening positions. Uses only one parameter for settings.

Der "Fibo Star" Indikator wurde entwickelt, um Fibonacci-Fächer in Form von Sternen auf Ihrem Handelschart darzustellen. Diese Fibonacci-Fächer sind ein leistungsstarkes Werkzeug zur Analyse von Preisbewegungen und können Einblicke in potenzielle Unterstützungs- und Widerstandsniveaus bieten. Dieser Indikator verfügt über ein benutzerfreundliches Steuerungspanel, das darauf abzielt, den Zeichnungs- und Konfigurationsprozess der Fächer zu vereinfachen und somit Zeit und Aufwand zu sparen. Anleitu

Der "Währungsstärke-Indikator" ist ein leistungsstarkes Werkzeug, das entwickelt wurde, um den Händlern Informationen über die relative Stärke verschiedener Währungen auf dem Devisenmarkt zu liefern. Durch Berechnung und Darstellung der Stärke jeder Währung basierend auf ihrem jeweiligen Zeitrahmen bietet dieser Indikator den Händlern die Möglichkeit, potenzielle Handelsmöglichkeiten zu identifizieren, insbesondere wenn signifikante Divergenzen oder Kreuzungen beobachtet werden. Hauptmerkmale de

Der Gann Square Indikator ist ein leistungsstolles Marktanalyse-Tool, das auf dem Artikel "Mathematische Formel für Marktvorhersagen" von W.D. Gann basiert. Dieses Tool verwendet mathematische Konzepte und Gann-Theorien für eine präzise Marktanalyse. Es beinhaltet Quadratwerte von 144, 90, 52 und auch das Quadrat von 9. Darüber hinaus integriert es die Methode von zur Quadratwurzel von 9 und deren Beziehung zu Kanälen und dem Sternmuster. Benutzerhandbuch und Anwendung: Vor der Verwendung diese

Dieser Indikator erkennt harmonische Muster, die manuell und automatisch auf dem Chart gezeichnet werden. Bitte geben Sie Ihre eigene Bewertung ab. Hinweise: Der Indikator verfügt über ein Steuerungsfeld und speichert alle (Chart & Zeitrahmen) Einstellungen. Sie können es minimieren, um mehr Platz auf dem Chart zu haben, und Sie können die Schaltfläche "Schließen" drücken, um alle Indikatordaten auf dem Chart auszublenden, wenn Sie lieber mit anderen Analysewerkzeugen arbeiten. Wenn Sie diesen I
Der MetaTrader Market ist die beste Plattform für den Verkauf von Handelsroboter und technischen Indikatoren.
Sie brauchen nur ein gefragtes Programm für die MetaTrader Plattform schreiben und schön gestalten sowie eine Beschreibung hinzufügen. Wir helfen Ihnen, das Produkt im Market Service zu veröffentlichen, wo Millionen von MetaTrader Benutzern es kaufen können. Konzentrieren Sie sich auf dem Wesentlichen - schreiben Sie Programme für Autotrading.
Sie verpassen Handelsmöglichkeiten:
- Freie Handelsapplikationen
- Über 8.000 Signale zum Kopieren
- Wirtschaftsnachrichten für die Lage an den Finanzmärkte
Registrierung
Einloggen
Wenn Sie kein Benutzerkonto haben, registrieren Sie sich
Erlauben Sie die Verwendung von Cookies, um sich auf der Website MQL5.com anzumelden.
Bitte aktivieren Sie die notwendige Einstellung in Ihrem Browser, da Sie sich sonst nicht einloggen können.