Conheça o Mercado MQL5 no YouTube, assista aos vídeos tutoriais
Como comprar um robô de negociação ou indicador?
Execute seu EA na
hospedagem virtual
hospedagem virtual
Teste indicadores/robôs de negociação antes de comprá-los
Quer ganhar dinheiro no Mercado?
Como apresentar um produto para o consumidor final?
Novos Indicadores Técnicos para MetaTrader 5 - 2
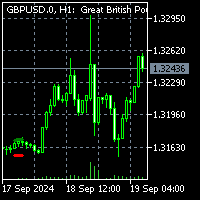
To get access to MT4 version please click here . This indicator is not a standard indicator and you may get into trouble installing it. Please contact via private chat if you face trouble. This is exact conversion from TradingView: "Consolidation Zones - Live" by "LonesomeTheBlue". This is a light-load processing indicator. Updates are available only upon candle closure. Buffers are available for processing in EAs. It is a repaint indicator. So previous buffer values do not represent exactly wh
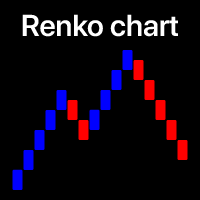
Filter out small price movements and focus on the larger trend . Renko chart indicator will help you to filter out a minor price movements so that you can focus on the overall trend. The price must move a specified amount to create a Renko brick. This makes it easy to spot the current trend direction in which the price is moving. My #1 Utility : includes 65+ features | Contact me if you have any questions | MT4 version In the settings of the indicator, you can configure: Calculation Se

The Relative Gap Index (RGI) is a powerful new tool designed for traders looking to identify market momentum and potential trend reversals with ease. Developed by Avydel Talbo, the RGI offers a fresh perspective on price action, making it an essential addition to your trading toolkit. Key Features: User-Friendly Scale : The RGI operates on a -100 to 100 scale, allowing you to quickly assess market conditions. Instant Color Signals : Green Line : Indicates bullish momentum when the RGI is above z

Premium Automatic Fibonacci Indicator Your Dynamic Edge in Trading Elevate your trading strategy with our cutting-edge Premium Automatic Fibonacci Indicator. This powerful tool combines the timeless wisdom of Fibonacci retracements with advanced dynamic features, giving you unparalleled insight into market trends and potential reversal points. Key Features: Dynamic to Static Conversion: Seamlessly switch between dynamic and static Fibonacci levels with a single click. Adapt to changing market c

John 14:6 Jesus saith unto him, I am the way , the truth , and the life : no man cometh unto the Father, but by me.
TICK VALUE : Multi-Currency Account Indicator Description: The TICK VALUE : Multi-Currency Account Indicator is a powerful and versatile tool designed for traders looking to streamline their portfolio management across multiple currency pairs. With its robust functionality, this indicator not only provides comprehensive historical profit calculations but also allows f
FREE

This VWAP indicator is one I personally use in all of my trading strategies. Over time, I’ve found it to be one of the most accurate and reliable indicators for tracking price action and volume relationships.
Key features- Multiple VWAP Options : Offers 4 types of VWAP—daily, weekly, monthly, and yearly. Each comes with an adjustable buffer, perfect for integration into an EA. Accuracy : Delivers exceptionally accurate VWAP values. While I use it with my broker’s server in GMT, the results sho

Asia Range STDV I ndicator
This Indicator is designed not only to identify the Asia session trading range and Standard Deviation levels but also to assist traders in creating a systematic entry and exit strategy based on the higher timeframe daily trend . The indicator supports both bullish and bearish scenarios, allowing traders to focus on key moments when the Asia range's high or low is "swept" (broken) in line with the confirmed trend. Strategy Overview: 1. Confirming the Daily Trend (B
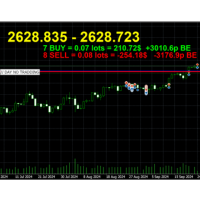
Breakeven Line v2 Indicator is a MetaTrader indicator that calculates breakeven level based on all open positions and displays it on your chart as a horizontal line. Additionally, it will calculate the total number trades, the total number of lots, and the distance to the breakeven line in points and profit/loss. The indicator is available for both MT5. Why use Breakeven Line Indicator? When you have multiple trades opened on a single symbol, it can be difficult to tell where your average ent

CBT Quantum Maverick Sistema de Lucro Binário de Alta Eficiência
O CBT Quantum Maverick é um sistema de negociação de opções binárias de alto desempenho e bem ajustado, projetado para traders que buscam precisão, simplicidade e lucros confiáveis. Nenhuma personalização é necessária — este sistema é otimizado para os melhores resultados imediatamente.
Principais recursos:
- Dois modos de precisão de sinal: - Modo "Permitir Repintura": Oferece sinais com antecedência, dando a você ampla opo

Level Breakout Indicator é um produto de análise técnica que funciona a partir dos limites superior e inferior, que pode determinar a direção da tendência. Funciona na vela 0 sem redesenhar ou atrasos.
Em seu trabalho utiliza um sistema de diversos indicadores, cujos parâmetros já foram configurados e combinados em um único parâmetro - “ Scale ”, que realiza a gradação dos períodos.
O indicador é fácil de usar, não requer nenhum cálculo, usando um único parâmetro você precisa selecionar a grad

ZigWave Oscillator: Potencialize Suas Operações com Osciladores e ZigZag! O ZigWave Oscillator é a ferramenta perfeita para traders que buscam precisão e clareza na análise do mercado financeiro. Este indicador combina a força dos osciladores com a simplicidade visual do ZigZag, ajudando você a identificar as melhores oportunidades de compra e venda com rapidez e eficiência. Por que escolher o ZigWave Oscillator? Análise precisa de osciladores : Integre RSI, Williams %R ou CCI para cap
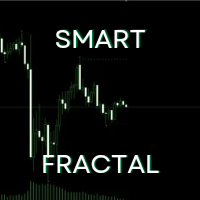
Smart Fractals Indicator - Um Fractal Potencializado para o Seu Trading no MT5 O Smart Fractals é a evolução do indicador Fractal clássico que você conhece e usa em seus gráficos. Projetado especificamente para MetaTrader 5, este indicador não se limita a identificar os pontos clássicos de reversão no mercado, mas vai além, tornando o seu trading mais eficiente e lucrativo. Pegamos o conceito básico de fractais e o transformamos em uma ferramenta mais inteligente e funcional. Características pri

Este indicador MACD (Convergência/Divergência de Médias Móveis) tem as seguintes características: Janela Separada: Exibido abaixo do gráfico principal. Linha MACD: Linha azul mostrando a diferença entre EMAs rápida e lenta. Linha de Sinal: Linha vermelha mostrando a SMA da linha MACD. Histograma: Histograma cinza mostrando a diferença entre as linhas MACD e de Sinal. Sinais de Compra/Venda: Setas verdes (compra) e vermelhas (venda) nos pontos de interseção. Linha Zero: Linha pontilhada cinza mos

This is an Engulfing Candle Indicator with a Moving Average Signal confirmation. The Buy and Sell are displayed on the chart.
It has been tested on a 1 Minute and 5 Minutes chart with multiple pairs (EUR/USD, EUR/JPY, USD/JPY...etc.). It will work on Pocketoption OTC market as well.
if you are using martingale, then the recommended settings are,
Initial investment: $1.00
Martingale Multiplier: 2.5
Martingale steps: 5
The indicator likely will not reach the fifth step but you need to

Currently, the product's selling price is over $480; however, we are offering a monthly rental system for only $30. This allows many people to enjoy and experience our products during this launch stage, which will likely lead to positive reviews from users, making it more enjoyable | We hope that if there are more than 10 positive reviews, the GOOD NEWS is that the next use will last for 3 months at a fixed price of only $30 | Take advantage of our promo opportunity, before it goes back to sell

Certainly. Here's the explanation in English: This program is a custom indicator that calculates the MACD (Moving Average Convergence Divergence) and shows the crossovers between the MACD and Signal lines. Here are the main functions of the program: MACD Calculation: Calculates the difference between the Fast EMA (Exponential Moving Average) and Slow EMA. This difference forms the MACD line. Signal Line Calculation: Creates the Signal line by taking a simple moving average (SMA) of the MACD valu

MT5 Alert Indicator Please add Ema moving averages 60/100/200 & Rsi period 10 levels 30/70 to your chart. This indicator alert on a trend reversal strategy were - ema 60 > 100&200 - ema 100 < 200 And the Rsi is below 30 FOR BUY SIGNAL
Use this strategy in confluence with a larger timeframe trend in the same direction. This strategy identifies great entry opportunities to enter an early trend.
FREE

This new version includes all MT5 timeframes (M1, M2, M3, M4, M5, M6, M10, M12, M15, M20, M30, H1, H2, H3, H4, H6, H8, H12, D1, W1 & MN1). The TD count for each timeframe is displayed on the top left corner. You don't need to do analysis anymore, as the scanner does all the analysis and updates every 1 second, allowing users to see real-time data for informed decision-making. Alerts are set on by default (can be turned off), which notifies users at the completion of every TD9. If you need a sca

With this indicator, you can predict future price behavior for a certain number of bars ahead, giving you the ability to anticipate market dynamics. The indicator draws a forecast line , which models potential future price values based on sophisticated algorithms analyzing past data. This information can be leveraged not only for market entry and exit decisions but also for setting or adjusting stop-loss levels to better manage your positions. Application of the Forecast The data provided by the

CYCLE WAVE OSCILLATOR indicator is an indicator based on cyclical price fluctuations. This indicator can help you determine overbought and oversold levels, and help you predict price trends within the cycle. MT4 Version here! You can combine it with our indicators below to make your trading decisions more accurate: Supply Demand Ribbon MT5 Basic
Feature: - Three Trend Types: + Zero + Basic + Advanced
FREE
Looking for EA to automate your trading strategy on the Forex market? TrendRocWaves Oscillator — your faithful companion in the world of trading! This manual trading system offers unique features:
- works exclusively on an hour(H1) timeframe for instant response to market changes. - uses the most popular and liquid currency pairs such as EURJPY, EURGBP, EURUSD, GBPUSD and USDCAD with minimal spreads and fast transaction execution. - applies a scalping method based on a medium-term trend to ac

Highlights a specific candle after a designated time interval. This feature is particularly useful for evaluating the potential profitability of breakout strategies that are triggered at specific candle intervals. It allows traders to visually assess whether a breakout strategy, set to activate at a certain candle, would have been successful in past market conditions.
FREE

This MT5 alert is designed to identify potential buying opportunities based on several technical indicators and price action patterns. Here's how it works: Buy Conditions 1. RSI Condition: The Relative Strength Index (RSI) for the current period is below a specified low threshold (RsiLow). This indicates oversold conditions.
2. Candlestick Pattern: It checks for a specific candlestick pattern across three consecutive candles: - The current candle (1) closes higher than it opens (bull
FREE

RSI Condition:
The Relative Strength Index (RSI) for the current period is below a specified low threshold (RsiLow). This indicates oversold conditions. Candlestick Pattern:
It checks for a specific candlestick pattern across three consecutive candles: The current candle (1) closes higher than it opens (bullish) The previous candle (2) closes lower than it opens (bearish) The current candle's close is below the high of the previous candle Price Action:
The alert also checks that the curre
FREE

The Pipsurfer Strategy indicator is designed to help traders identify trend-based trades by leveraging momentum confirmations within the market structure. It works by detecting key pullbacks and providing entry signals after a confirmed market retracement , ensuring you only enter trades with the highest probability of success. Perfect for traders looking to capitalize on trending markets, this tool simplifies your decision-making process and helps you stay on the right side of the trend. Whethe
FREE

ADTMomentum Indicator
or MFI and RSI Combined Indicator: Elevate Your Trading Strategy!
Unlock the full potential of your trading with our MFI and RSI Combined Indicator, a powerful tool designed for traders who seek precision and clarity in their market analysis. This innovative indicator seamlessly integrates two of the most respected momentum indicators—Money Flow Index (MFI) and Relative Strength Index (RSI)—to provide you with unparalleled insights into market trends.
Key Features:
FREE
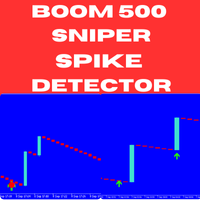
Introducing the Boom 500 Sniper Spike Detector – an advanced, non-repainting indicator specifically crafted to help you capture spikes in the Boom 500 market with precision. Whether you are an experienced trader or just starting, this indicator provides reliable signals that simplify spike trading, making it an essential addition to your trading arsenal. Key Features: Non-Repainting Signals : The Boom 500 Sniper Spike Detector generates highly reliable signals that do not repaint, allowing you t
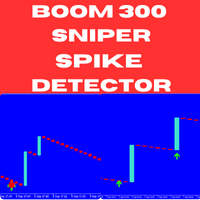
Introducing the Boom 300 Sniper Spike Detector – a powerful, non-repainting indicator specifically engineered to help you master spike trading in the Boom 300 market. Whether you're a seasoned trader or new to the game, this tool offers precise and timely signals, allowing you to catch spikes with confidence and improve your overall trading performance. Key Features: Non-Repainting Signals : Ensures consistent and accurate signals that do not repaint, providing you with reliable data to make con

Fractal Indicator Strategy is an advanced MetaTrader 5 indicator specifically designed for traders who use fractal analysis in their strategies. This indicator provides an essential tool for marking key levels on the chart with horizontal lines, making it easier to identify and follow fractal patterns in the market. Key Features: Fractal Horizontal Lines: Automatically draws horizontal lines at customizable intervals in pips, based on key levels essential for fractal analysis. These horizontal
Order Block Tracker is here to solve one of the biggest challenges traders face: identifying order blocks. Many traders fail to spot these critical zones, often missing out on key market entries. But with Order Block Tracker , you no longer have to worry about that. This advanced indicator automatically highlights these crucial zones for you, giving you the confidence to enter the market at the right time. MT4 Version - https://www.mql5.com/en/market/product/123358/ Key Features of Order

Visualize seu histórico de negociações de forma estruturada e detalhada, com taxas de acertos e lucro separados por dia, semana, mês e total, além de detalhes sobre o ativo, horário do servidor e posições/ordens em andamento. Este painel foi criado visando o uso em contas do tipo HEDGE, porém pode ser utilizado em contas do tipo NETTING sem nenhum problema. Na versão PREMIUM deste Painel você tem opção de utilizar uma micro boleta com botões para facilitar o tratamento e execução de ordens em an
FREE
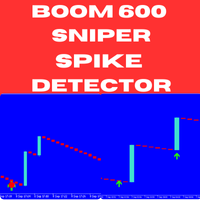
Boom 600 Sniper Spike Detector - MQL5 Listing Description Introducing the Boom 600 Sniper Spike Detector – a cutting-edge, non-repainting indicator designed to help you effectively capitalize on spikes in the Boom 600 market. Ideal for both seasoned traders and beginners, this indicator offers precise, actionable signals to enhance your trading strategy and maximize your profit potential. Key Features: Non-Repainting Signals : Guarantees reliable and consistent signals that do not repaint, provi

This indicator managge all kind of ICT FVG include: FVG, SIBI, BISI, Inverse FVG. The advantage point of this indicator is mangage FVG on all timeframe. FVG - Fair value gap ICT Fair value gap is found in a “three candles formation” in such a way that the middle candle is a big candlestick with most body range and the candles above & below that candle are short and don’t completely overlap the body of middle candle. * This indicator allow filter FVG by ATR. So you can just show valid FVG which
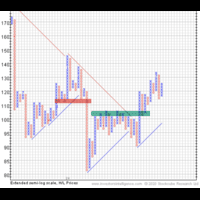
Point-and-Figure MetaTrader 5 indicator is an indicator that can plot a point-and-figure chart directly in the main window of your normal MT5 chart. You can set up all the point-and-figure method parameters, such as the box size and the reversal distance, according to your preference. In addition, you can control all the display parameters of the PnF chart. This point-and-figure indicator supports all sorts of alerts. It is based on real ticks data, and thus is available only for MT5. Point-an
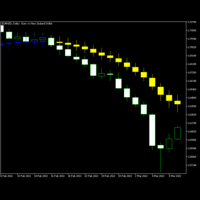
Moving Average Candlesticks MetaTrader indicator — is a chart visualization of a standard moving average using the candlestick bars. It draws the candlesticks based on the moving average values calculated for Close, Open, Low, and High. It allows seeing a compact snapshot of the more detailed market information compared with the classic MA indicator. It works with any currency pair, timeframe, and MA mode. The indicator is available for MT4 and MT5. Input parameters MAPeriod (default = 10
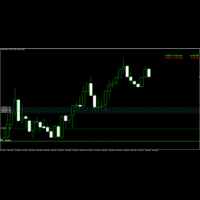
Breakeven Line Indicator is a MetaTrader indicator that calculates breakeven level based on all open positions and displays it on your chart as a horizontal line. Additionally, it will calculate the total number trades, the total number of lots, and the distance to the breakeven line in points and profit/loss. The indicator is available for both MT4 and MT5. You can press the Shift + B keyboard shortcut to hide or show the breakeven line. The indicator supports multiple input parameters to
Daily Performance Tracker (MetaTrader indicator) calculates the currency rate change relative to the previous day's close and displays it as a percentage in the main chart window. It also offers the option to show weekly and monthly percentage changes. You can customize colors to differentiate between positive and negative price movements. Additionally, a small, customizable arrow visually indicates the price direction. If your broker operates in a non-standard time zone, the Time Shift paramete

This is the best indicator we have created by far, this indicator replicates the well known heiken ashi indicator, but with a more precise entry point, this indicator can work on all time-frames and is strong on all the time frames , this indicator does not repaint nor does it lag , this indicator strategy combined with price action will change your trading experience , elevate your experience to the next level.

The Super Trend Extended Indicator is a powerful tool designed to assist traders in identifying market trends and making informed trading decisions. It combines a robust trend-following algorithm with advanced filtering options to provide precise entry and exit signals. Key Features: Trend Identification : The indicator effectively highlights the current market trend, whether bullish or bearish, helping traders stay on the right side of the market. Customizable Parameters : Users can adjust sens

Stratos Pali Indicator is a revolutionary tool designed to enhance your trading strategy by accurately identifying market trends. This sophisticated indicator uses a unique algorithm to generate a complete histogram, which records when the trend is Long or Short. When a trend reversal occurs, an arrow appears, indicating the new direction of the trend.
Important Information Revealed Leave a review and contact me via mql5 message to receive My Top 5 set files for Stratos Pali at no cost !
Do

CustomRSI50 - Indicador RSI Personalizado com Nível 50 Descrição CustomRSI50 é um indicador técnico personalizado baseado no popular Índice de Força Relativa (RSI). Este indicador oferece uma visualização clara e personalizável do RSI, com ênfase particular no nível 50, crucial para muitos traders na análise do momentum. Características Principais Período RSI configurável Nível de referência 50 destacado Tipo de preço aplicado personalizável Visualização em janela separada Escala fixa de 0 a 100
FREE

The Multi Pairs Forex Indicator is an advanced trading too l that allows traders to track and analyze the performance of multiple currency pairs in real-time on a single chart. It consolidates data from various Forex pairs, providing an at-a-glance overview of market conditions across different currencies and helps you save time. Useful for various trading styles, including scalping, day trading, and swing trading. Whether you're monitoring major pairs like EUR/USD, GBP/USD, or more exoti

CustomRSI50 Alert and Mail at Cross - Indicador RSI Personalizado com Alerta e E-mail Descrição CustomRSI50 Alert and Mail at Cross é um indicador técnico avançado baseado no popular Índice de Força Relativa (RSI), projetado para simplificar a negociação automatizada com notificações imediatas via alertas e e-mails quando o nível do RSI cruza o limiar de 50. O indicador fornece uma visualização clara e personalizável do RSI, com ênfase particular no nível 50, crucial para muitos traders na análi

O HiperCube Tornado está aqui!
O HiperCube Tornado é um indicador simples, mas eficaz, que o ajuda a identificar quando um novo touro ou energia de urso está próximo.
Fácil de usar Cores personalizadas Indicador separado do Windows O TEMA é utilizado para fazer calcs Períodos personalizados Método Personalizado O chat GPT e IA costumavam ser desenvolvidos Estratégia Espere a TI+ atravessar o TI- Isto significa, sinal para comprar
Aguarde TI- atravessar o TI+ Isto significa, sinal para ven
FREE

Imbalance DOM Pro: Potencialize Suas Operações com o Desequilíbrio do Book Oportunidades em Pequenos Movimentos de Preço
O Imbalance DOM Pro é uma ferramenta essencial para analistas que operam o fluxo de ordens . Perfeito para scalpers , ele foi desenvolvido para quem busca aproveitar as pequenas oscilações de preço com alta precisão. Com um cálculo avançado, o indicador identifica desequilíbrios no book de ofertas , fornecendo sinais valiosos para entradas e saídas rápidas. IMPORT

CVB Cumulative Volume Bands: Potencialize Suas Operações com Volume Acumulado! O CVB Cumulative Volume Bands é um indicador avançado projetado para traders que desejam insights precisos baseados em volume acumulado. Utilizando bandas de volume acumulado, este indicador oferece uma leitura clara das pressões de compra e venda no mercado, ajudando a identificar reversões e movimentos fortes. Principais Características: Análise de Volume Acumulado : Detecte os pontos de pressão com b

Olá traders, HiperCube, estou feliz por lhe apresentar um novo indicador MTF MA!
HiperCube Multi-Timeframe Moving Média ou MTF MA é um indicador que lhe permite exibir o MA de um período mais elevado e outro baixo, tão simples. Funcionalidades: Selecione o prazo de um menu suspenso Período personalizado MA Tipo de MA personalizado (EMA,SMA...) Cor personalizada do MTF MA Conclusão O HiperCube MTF é um innicator simples, mas útil, que permite não mudar entre os prazos, pode ver todos os MA num
FREE

Introducing Volume Orderflow Profile , a versatile tool designed to help traders visualize and understand the dynamics of buying and selling pressure within a specified lookback period. Perfect for those looking to gain deeper insights into volume-based market behavior! MT4 Version - https://www.mql5.com/en/market/product/122656/ The indicator gathers data on high and low prices, along with buy and sell volumes, over a user-defined period. It calculates the maximum and minimum prices during t

Veja "O que há de novo" para uma análise das funções mais recentes. A versão 1.4 foi apenas uma organização, nada de especial.
//+---------------------------------------------------------------------------------------------------------------+ Criei isso porque precisava de um indicador fractal personalizável. Ele também verifica volumes decrescentes para fornecer algum tipo de confirmação. Detalhes abaixo: Visão Geral Este indicador foi projetado para ajudar a identificar pontos-chave de revers
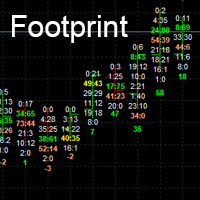
Footprint charts can add a level of depth to your visuals that standard charts cannot achieve.
Footprint charts are a powerful way to visualize the ups and downs of the market, helping you potentially to make better trading decisions. Orderflow Footprint in MT5. show # of market orders at each tick.
Inputs
Point Scale *1 to *10000
Number of candle to show. Font Size Max Bid Color (Top Seller) Max Ask Color (Top Buyer) Max Bid and Ask Color
Normal color

Heiken Ashi CE Filtered – Premium Buy/Sell Indicator with Advanced Filtering Introducing the "Heiken Ashi CE Filtered" – a high-quality custom indicator designed for traders seeking precision and clarity in their trading signals. This premium indicator combines the smooth visual simplicity of Heiken Ashi candles with the power of an ATR-based chandelier exit strategy and a zero-lag LSMA filter for highly reliable buy and sell signals. Key Features: Reliable Buy/Sell Signals: The indicator genera
Engulfing Pattern is a free indicator available for MT4/MT5 platforms, its work is to provide "alerts" when a "Bullish" or "Bearish engulfing pattern forms on the timeframe. This indicator comes with alerts options mentioned in the parameter section below. Join our MQL5 group , where we share important news and updates. You are also welcome to join our private channel as well, contact me for the private link. Engulfing Pattern Indicator MT4 Other Products Try our Martini EA with 2 years of liv
FREE

1. What is this Due to the limitation of MT5 software, we can only see the minimum 1-minute candlestick chart. Sometimes this is not enough for high-frequency traders, or we want to see a more detailed candlestick chart. This tool allows you to see: A candlestick chart composed of N ticks, which allows you to better understand the price fluctuations. For example, each candle line has 20 ticks, or 70 ticks.
2. Parameters: NTick = 70; // The tick cnt for one candle BandsPeriod = 20;

Chandelier Exit for MT5 The Chandelier Exit indicator is designed to dynamically set stop-loss levels based on market volatility, measured through the Average True Range (ATR). It helps traders secure positions during trend changes by using price extremes and dynamic stop-losses for both long and short positions. Key Features: ATR-Based Stops : The indicator calculates stop-loss levels for long and short positions using a moving average of the True Range (ATR), adapting to market volatility chan

Zero Lag SMA for MT5 The Zero Lag SMA (ZLSMA) indicator for MT5 provides a variation of the Simple Moving Average (SMA) designed to minimize lag, offering traders a more responsive moving average that adjusts more quickly to price changes. This makes it useful for identifying potential trend reversals and key price levels in a timely manner. Key Features: Zero Lag Calculation : The core of this indicator uses a double smoothing technique to reduce lag, providing faster responses to price movemen
FREE
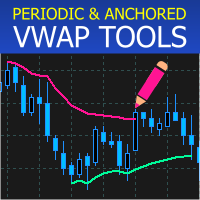
O VWAP Tools apresenta VWAP diário , VWAP semanal , VWAP mensal , VWAP ancorado , VWAP por sessão e Painel de desenho para adicionar, remover e alterar propriedades de vários VWAPs ancorados em um único indicador. Com o painel do VWAP Tools você pode: Desenhe VWAPs com um intervalo de tempo específico ou estenda os VWAPs para o tempo da barra atual Alterar as propriedades de cada VWAP individualmente Selecione um VWAP clicando sobre ele Exclua um VWAP clicando em qualque
FREE

ATR Bands with Take-Profit Zones for MT5 Optimize your risk management and trading strategy with the ATR Bands indicator for MT5 – a powerful tool designed to help you navigate market volatility, identify key price levels, and set realistic stop-loss and take-profit targets. Key Features: ATR-Based Bands : The core of this indicator relies on the Average True Range (ATR) to calculate dynamic upper and lower bands that adapt to market volatility. The bands provide a clear indication of potential
FREE

This indicator converted from Squeeze Momentum Indicator [LazyBear] version on TradingView [---- Original Notes ----]
This is a derivative of John Carter's "TTM Squeeze" volatility indicator, as discussed in his book "Mastering the Trade" (chapter 11). The Squeeze Momentum Indicator (or TTM Squeeze) is an indicator that measures volatility and momentum, based on price movement within a tight range for a period of time and then breaking out sharply to initiate large moves.
The most popular ver
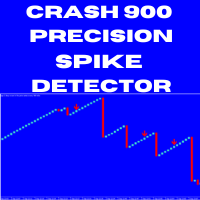
Crash 900 Precision Spike Detector The Crash 900 Precision Spike Detector is your ultimate tool for trading the Crash 900 market with precision and confidence. Equipped with advanced features, this indicator helps you identify potential sell opportunities and reversals, making it an essential tool for traders aiming to capture spikes with minimal effort. Key Features: Non-Repainting Signals: Accurate, non-repainting signals that you can trust for reliable trading decisions. Audible Alerts: Stay

This indicator marks the SMA crossover candles. To use this indicator properly you should / could also add the Moving Average indicator.
If you do, use the default length of 8 or use the length you used as input within this indicator.
Which I tend to use as my entry model.
Usually when this occurs within my marked supply or demand zone you could end up with a price explosion heading toward the next weak high / low or even toward the daily high / low.
I personally use it on the 2-3 min cha
FREE

1. What is this Due to the limitation of MT5 software, we can only see the minimum 1-minute candlestick chart. Sometimes this is not enough for high-frequency traders, or we want to see a more detailed candlestick chart. This tool allows you to see: A candlestick chart composed of N seconds, which allows you to better understand the price fluctuations. For example, each candle line has 20 seconds, or 30 seconds.
2. Parameters: SecondCandle = 20; // The second cnt for one candle, Need

This is an advanced indicator used with success rate.Unlock the secrets of trading Boom and Crash spikes with our powerful MT5 indicator! This spike detection tool provides accurate buy and sell signals, trade alerts, and High success rate entries. Perfect for scalping, day trading, and swing trading. Get the best Boom and Crash strategy with our Deriv Boom and Crash spike indicator. Indicator does not redraw or repaint. Recommendation
· Use a Virtual Private Server (VPS) for 24/7 alerts on

BotM5 MT5
Exact entry points for currencies, crypto, metals, stocks, indices!
Indicator 100% does not repaint!!!
If a signal appeared, it does not disappear! Unlike indicators with redrawing, which lead to loss of deposit, because they can show a signal, and then remove it.
Trading with this indicator is very easy.
Wait for a signal from the indicator and enter the deal, according to the arrow
(Aqua arrow - Buy, Red - Sell).
Indicator parameters:
Deviation - 4 (you
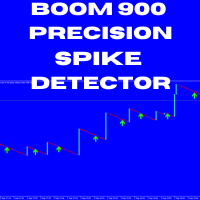
Boom 900 Precision Spike Detector The Boom 900 Precision Spike Detector is a powerful tool designed to help traders accurately identify spike opportunities in the Boom 900 market. With advanced features and precise alerts, this indicator takes the guesswork out of trading, enabling you to maximize your profits with confidence. Key Features: Non-Repainting Signals: Get reliable signals without repainting, ensuring your trading decisions are based on accurate, real-time data. Audible Alerts: Stay
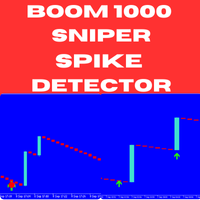
Boom and Crash Sniper Spike Detector - Boom 1000 The Boom and Crash Sniper Spike Detector is the ultimate tool for spike trading on Boom 1000, offering clear and reliable signals to help you capture high-probability trades. This advanced indicator is designed to enhance your trading strategy by simplifying spike detection and maximizing your profits. Key Features: Multi-Timeframe Compatibility : The indicator can be used on M1, M5, M15, M30, and H1 timeframes, but it works best on the M1 timefra
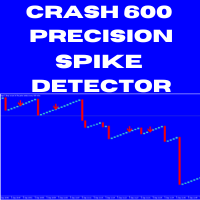
Crash 600 Precision Spike Detector The Crash 600 Precision Spike Detector is an essential tool designed to help traders navigate the Crash 600 market with accuracy and efficiency. Packed with advanced features, this indicator provides precise alerts that allow traders to capture spikes and reversals with confidence. Key Features: Non-Repainting Signals: Dependable, non-repainting signals that ensure your trading decisions are based on real-time, accurate data. Audible Alerts: Receive sound notif
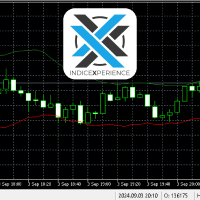
Indicador para mercado de Índice Futuro Brasileiro (WIN) __________________________________________________________________________________________________
O indicador trabalha com rompimento de canal indicando o sentido do movimento e os 3 possíveis TP e o SL baseado no ATR.
Indicação de utilização em TimeFrame de 5M, mas pode ser utilizado em qualquer tempo gráfico de sua preferencia. __________________________________________________________________________________________________
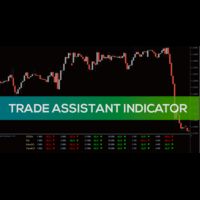
Trade Assistant Introducing the Trade Assistant MetaTrader Indicator—a revolutionary tool that brings clarity and precision to your trading strategy by seamlessly integrating three powerful indicators: the Stochastic Oscillator, RSI (Relative Strength Index), and CCI (Commodity Channel Index). This versatile, multi-timeframe indicator provides you with a comprehensive view of trend directions across every significant timeframe, from M1 to MN1. No matter which timeframe you choose to analyze, the
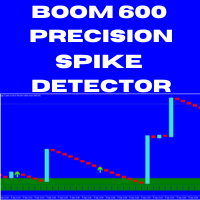
Boom 600 Precision Spike Detector The Boom 600 Precision Spike Detector is your ultimate tool for trading the Boom 600 market with precision and confidence. Equipped with advanced features, this indicator helps you identify potential buy opportunities and reversals, making it an essential tool for traders aiming to capture spikes with minimal effort. Key Features: Non-Repainting Signals: Accurate, non-repainting signals that you can trust for reliable trading decisions. Audible Alerts: Stay on t

In the context of trading, Malaysia SNR (Support and Resistance) refers to the technical analysis of support and resistance levels in financial markets, particularly for stocks, indices, or other assets traded. This is single timeframe version. Multiple timeframe version is avaiable here . There are three type of Malaysia SNR level Classic , GAP and Flipped 1. Classic Support is the price level at which an asset tends to stop falling and may start to rebound. It acts as a "floor" where demand is
O mercado MetaTrader é um espaço, sem precedentes, para negociar robôs e indicadores técnicos.
Leia o artigo Manual do usuário da MQL5.community para saber mais sobre os serviços exclusivos que oferecemos aos traders: cópia de sinais de negociação, aplicativos personalizados desenvolvidos por freelances, pagamentos automáticos através de sistema de pagamento e a rede em nuvem MQL5.
Você está perdendo oportunidades de negociação:
- Aplicativos de negociação gratuitos
- 8 000+ sinais para cópia
- Notícias econômicas para análise dos mercados financeiros
Registro
Login
Se você não tem uma conta, por favor registre-se
Para login e uso do site MQL5.com, você deve ativar o uso de cookies.
Ative esta opção no seu navegador, caso contrário você não poderá fazer login.