Conheça o Mercado MQL5 no YouTube, assista aos vídeos tutoriais
Como comprar um robô de negociação ou indicador?
Execute seu EA na
hospedagem virtual
hospedagem virtual
Teste indicadores/robôs de negociação antes de comprá-los
Quer ganhar dinheiro no Mercado?
Como apresentar um produto para o consumidor final?
Novos Indicadores Técnicos para MetaTrader 5 - 9

The Extreme Spike PRT Indicator is an effective tool for identifying sharp market fluctuations . It performs its calculations using the ATR (Average True Range) indicator and displays candles with extreme volatility in two categories: primary spikes and secondary spikes , within the Metatrader platform oscillator window. This tool assists traders in detecting intense price movements and conducting more precise analyses based on these fluctuations. Time Frame 15-minute - 1-ho
Basic information. To perform its work, the indicator takes data on volumes from a lower timeframe, builds Market Profiles for a higher timeframe and a histogram for the current timeframe. The indicator starts in several stages. In this case, messages like: "Build Source & Target TF. Step: …" are output to the log. The process can be accelerated by changing the input parameter Milliseconds between steps - the initialization speed. The final value of this parameter is always individual and is set

Fair Value Gap (FVG) Indicator for MetaTrader 5
The Fair Value Gap (FVG) Indicator is an effective tool designed to spot trading opportunities in MetaTrader 5 by identifying imbalances in supply and demand. These imbalances, known as FVGs, emerge when the price moves aggressively. To explain simply, imagine three candlesticks: the gap between the first and third candlestick forms the " FVG ." This indicator highlights these gaps as dynamic boxes—green for bullish FVGs and red for bearish FVGs.
FREE

O IFR Stochastic é um indicador técnico que combina as características do Índice de Força Relativa (IFR) com o Estocástico, resultando em um oscilador mais sensível e que gera maior quantidade de sinais para negociação. Desenvolvido por Tushard Chande e Stanley Kroll , o indicador foi projetado para superar uma limitação percebida no IFR tradicional: a baixa frequência de ativação dos níveis de sobrecompra e sobrevenda (comumente 80 e 20), especialmente em ativos menos voláteis. Funcionamento O
FREE

Summary
This indicator plots multiple pivot points (support and resistance levels) using various calculation methods, allows customization of their appearance, and can alert when price touches these levels. It works on different timeframes and can display historical levels or just the current ones.
Overview Purpose : Plots dynamic pivot levels (Pivot, S1-S4, R1-R4) on the chart to help identify potential price reversal zones. Key Features : Supports 7 calculation methods (Classic, Camarilla

Based on the Extreme Trend Indicator on Trading View converted for MT5. Usage of the Indicator is free, but if you want the source code, you can purchase the source code by messaging me.
Extreme Trend is an indicator that identifies when a new trend is forming and creates a trading signal. This indicator can be used for many markets, forex, gold etc. If you have any inquiries or want to create an EA using this indicator, you can message me.
FREE

Overview The Waterfall Trading Indicator is a powerful momentum detection tool designed to identify high-probability trading opportunities across multiple timeframes. Built on pure price action analysis, this indicator provides clear, non-repainting signals that are especially effective for binary options and forex trading. Key Features Non-Repainting Signals : Based on real-time price action, ensuring reliable trade signals Multi-Timeframe Compatibility : Effective across all timeframes, with o
r-Trend Sync indicator is manual trading system for extra volatility markets. Main System features : The indicators's algorithm is based on the analysis of an extensive array of historical data (from 1995 for EURUSD & EURJPY and from 2004 for XAUUSD), which ensured the identification of general patterns in the behavior of these pairs across a wide range of timeframes. The analysis of historical data helped the system learn to recognize market triggers for medium-term trends and cycles, as well a
SynRhythmic Points Oscillator is an innovative manual trading system based on the combination of two analytical approaches, one focusing on short-term price changes and the other on identifying stable trends and dependencies. This synergy allows for obtaining excellent signals for entering the market while minimizing the influence of random fluctuations and reducing false signals. Additionally, the indicator can easily adapt to various market conditions and be automated, making it convenient for

As an ICT or SMC trader you must do top-down analysis, and you struggle to make template of drawing object on Metatrader just like you normally do on Tradingview. Well, Drawing Assistance indicator will make your top-down analysis much easier on Metatrader. Allow to design template for 3 timeframes. (HTF, MTF and LTF). Each objects drawn on chart will have the color, style and visibility individually by the timeframe it was drawn on. Save time as all analyzing is done on Metatrader chart. Shortc

Fibo Extrema Bands is a unique indicator that visually demonstrates when the market shifts into a trend and highlights key levels acting as support or resistance. It combines easy-to-read “stepped” extrema lines with Fibonacci levels (whose values can be adjusted in the indicator’s inputs), simplifying the search for entry and exit points. Install Fibo Extrema Bands to gain a powerful tool for trend analysis and for identifying critical price levels! This product is also available for MetaTrade
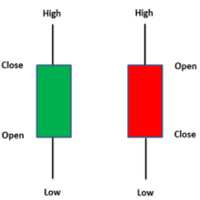
The indicator shows the strength of the trend if the green number is more than 50, you need to look for a signal to buy, and on the contrary, the red number is more than 50, you need to look for a sell,
The indicator is based on the Heiken Ashi candle
the indicator is suitable especially for scalping and medium-term trading
REMEMBER THE INDICATOR DOES NOT GUARANTEE A WINNER BUT IT HELPS TO MAKE CORRECT TRADING
THE RISK ON THE TRANSACTION WILL BE NO MORE THAN 3 PERCENT
FREE

This indicator is based on Mr. Mark Fisher's ACD strategy, based on the book "The Logical Trader."
- OR lines - A lines - C lines - Daily pivot range - N days pivot range - Customizable trading session - Drawing OR with the desired time Drawing levels A and C based on daily ATR or constant number - Possibility to display daily and last day pivots in color zone - Displaying the status of daily PMAs (layer 4) in the corner of the chart - Show the order of daily pivot placement with multi-day piv
FREE

The Market Master is a comprehensive, all-in-one trading indicator designed to enhance your trading strategy
Features:
Trend Filter VWAP Break Of Structure patterns Daily, Weekly, Monthly highs/lows Fractals Channels Volume Profile Currency Strength Meter Fair Value Gap News Filter
The idea behind this indicator was to create a trading tool that has everything a trader needs

The KT Dynamic Price Oscillator (DPO) offers a specialized approach to analyzing the trend, momentum, and volatility of financial instruments. It excels at identifying trend continuations, overbought or oversold conditions, and potential reversal points with precision. It is specifically designed to assist traders in identifying short-term price cycles and potential reversals by effectively filtering out long-term trends.
How to use the DPO
Trend Confirmation: The DPO acts as a reliable confir
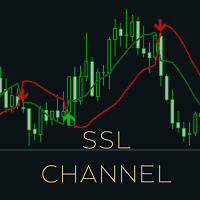
SSL (Semaphore Signal Level) Indicator for MT5 The Semaphore Signal Level (SSL) indicator is designed to give traders a visual representation of price trend dynamics by combining two moving averages. Its primary purpose is to signal when a price trend is forming, enabling traders to make more informed decisions based on market conditions. This indicator works by calculating two 10-period simple moving averages. One is applied to the highs of the price, and the other is applied to the lows, creat
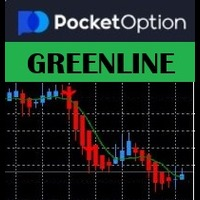
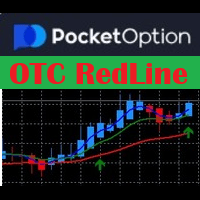
ocket Options GreenLine Strategy – SMA(7) Crossover & Trend Alert Indicator Latest Updates: Added Sell Alerts within an Uptrend – If MA1 crosses below MA2 without going below MA3, a Sell Alert is triggered. Enhanced Alert Logic – Prevents duplicate buy and sell icons on every candle. Improved Print Statement – Alerts now log directly to alerts.txt for future reference. Now Compatible with Heiken Ashi and Regular Candles. Overview
The Pocket Options GreenLine Strategy is a trend-following indic

Session Liquidity is the most anticipated trading strategy among the ICT trader. With this indicator you could frame the trade by simply deploying it on the chart. By simply inputting the Asian Opening Time, New York Opening Time, and choose the color option and display option you like then you will get the session laid down for you on the chart. You can choose between showing session as box or horizontal line. I personally trade this strategies for quite sometimes.

Introducing our advanced Indicator, a groundbreaking tool for identifying support and resistance zones with unmatched precision. Elevate your trading strategy with a host of features, including a dual-color upper and lower box system that allows for easy visual recognition of market trends.
Key Features: Dual-Color Box for the Support and Resistance Zones Customize your analysis with dual-color box. The upper and lower boxes offer distinct colors, providing a clear visual representation of supp
Volonacci Indicator It is an indicator that combines Fibonacci and volume to determine the price direction This indicator helps you identify Fibonacci angles according to the strategy The Volonacci indicator is indeed an interesting combination of Fibonacci levels and volume. This indicator uses Fibonacci tools to identify potential support and resistance levels, and enhances this by using volume to confirm the strength behind the price action.
MT4 Version https://www.mql5.com/en/market/produ

Are you ready to elevate your trading game and experience unparalleled accuracy in market predictions? The Scalping Range Grid Indicator is not just a tool—it’s your main weapon for pinpointing the next move in the financial markets. Designed for traders who demand the best, this cutting-edge indicator harnesses the power of grid-based analysis to scan future price transit zones with unmatched precision. Imagine having the foresight to know where the price is most likely to pause, consolidate,

This indicator displays the Daily Range of a selected pair directly on your chart, providing a clear and concise view of the pair’s movement for the day. It simplifies tracking how far a pair has moved, offering traders a practical advantage in analyzing market activity. This feature is especially useful for making faster and more accurate trading decisions. Whether you’re a beginner or an experienced trader, it helps streamline your strategy by highlighting key market insights in real-time.
FREE

The Matrix Series indicator analyzes price action, moving averages, and volatility to detect trending conditions. Bullish Trend: Green zones or upward signals indicate a strong uptrend, ideal for long positions. Bearish Trend: Red zones or downward signals suggest a downtrend, perfect for short positions. Sideways/Neutral Market: Non-highlighted or gray zones show periods of market consolidation or low momentum, helping you avoid false signals. Use Cases: Trend Confirmation: Use the indicator to

Haven Volume Profile é um indicador multifuncional para análise do perfil de volume que ajuda a identificar níveis chave de preços com base na distribuição do volume de negociação. Foi projetado para traders profissionais que desejam entender melhor o mercado e identificar pontos importantes de entrada e saída nas operações. Outros produtos -> AQUI Principais características: Cálculo do Point of Control (POC) - o nível de maior atividade comercial, que ajuda a identificar os níveis mais líquido
FREE

MACD Classic: Indicador de Convergência/Divergência de Médias Móveis para MT5 Projetado para traders avançados que buscam precisão e adaptabilidade em suas estratégias de negociação. O MACD Classic é um indicador técnico personalizado desenvolvido com MQL5 para MetaTrader 5 , otimizado para oferecer sinais claros de convergência e divergência de médias móveis , ajudando você a identificar tendências e pontos de entrada/saída com maior eficiência. Características Principais : EMA Rápida (12) :

Indicador MelonMask - Ajuda a Capturar Reversões de Tendência MelonMask é uma poderosa ferramenta de análise técnica, projetada especificamente para traders profissionais, que ajuda a detectar reversões de tendência com antecedência. Com seu algoritmo avançado baseado em Zigzag, ele identifica os pontos chave de reversão no mercado e fornece sinais visuais. Características do Indicador: Sinais de seta verde e vermelha nos pontos de reversão de tendência Prediz a direção potencial da próxima vel
FREE
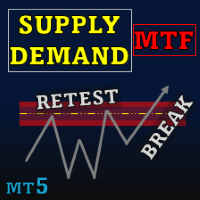
Special offer : ALL TOOLS , just $35 each! New tools will be $30 for the first week or the first 3 purchases ! Trading Tools Channel on MQL5 : Join my MQL5 channel to update the latest news from me Supply Demand Retest and Break Multi Timeframe , esta ferramenta traça zonas de oferta e demanda com base em velas de forte momentum, permitindo que você identifique essas zonas em múltiplos intervalos de tempo usando o recurso timeframe selector . Com etiquetas de reteste e quebra,
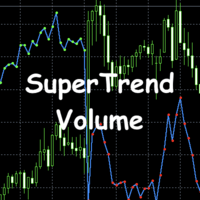
Este indicador combina SuperTrend con Volume Profile. Las principales características son: Componente SuperTrend: Funciona basado en ATR (Rango Verdadero Promedio) Determina la dirección de la tendencia (al alza/a la baja) Personalizable con los parámetros ATR Period y ATR Multiplier Muestra la dirección de la tendencia con una línea azul Componente Volume Profile: Analiza el volumen de negociación durante un período específico Detecta tendencias de volumen Personalizable con los parámetros VP
FREE

VWAP FanMaster: Encontre as Melhores Oportunidades com Precisão!
O VWAP FanMaster é o indicador definitivo para traders que buscam entradas precisas e pullbacks eficientes . Ele combina o poder do VWAP (Volume Weighted Average Price) com as linhas de Fibonacci Fan , fornecendo um mapa claro das zonas de interesse no mercado. Principais Recursos Simples e poderoso : Basta mover as linhas verticais para traçar automaticamente o VWAP e as linhas de Fibonacci Fan .
Estratégia eficiente
FREE

SlopeChannelB – uma ferramenta de análise técnica que constrói um canal de movimento de preços inclinado, oferecendo oportunidades únicas para avaliar a situação atual do mercado e encontrar sinais de negociação. Características principais do indicador: Canal de movimento de preços inclinado :
O indicador ajuda a visualizar os níveis de suporte e resistência, que podem indicar pontos potenciais de reversão ou continuação da tendência. Várias cores de linhas e destaque de fundo :
Os níveis d

The Forex Gangster Indicator allows you to determine the current trend. If the Forex Gangster Indicator line has moved below the price and turned blue, then you should open deals for an increase. If the Forex Gangster Indicator line has appeared above the price and turned red, then you should open deals for a decrease: The indicator is suitable for any time frames, but it needs to be supplemented with filtering indicators, since by itself it is late and does not have time to give an accurate si
FREE

This indicator works by plotting fractals on the chart as arrows that can be used as buy or sell signals. It is a great tool for both new and experienced traders as it provides a clear visual representation of the market and helps traders identify fractals. Although it repaints, it can be used quite effectively in conjunction with other tools to filter trading strategies.
We use this indicator in this way in our Royal Fractals EA, which you can purchase on the MQL5 Market: https://www.mql5.com
FREE

The Teamtrader Channel Stop indicator allows you to determine the current trend. If the Teamtrader Channel Stop indicator line has moved below the price and turned blue, then you should open deals for an increase. If the Teamtrader Channel Stop indicator line has appeared above the price and turned red, then you should open deals for a decrease: The indicator is suitable for any time frames, but it needs to be supplemented with filtering indicators, since by itself it is late and does not have
FREE
ParabolicSAR_Fibo_Channel is an indicator built not on the price deviation from the last extremum, as in a regular similar filter, but on the readings of Parabolic SAR and its intersection with the price chart. As a result, the indicator has a smaller delay in determining a new reversal point. In addition, the filter very conveniently built in Fibonacci levels, which are built on the basis of three consecutive ZigZag peaks, as well as a channel built on the same points. As a result, this indicat

Regression_Channel_mod Indicator that expands our standard linear regression channel by adding support and resistance lines. Easy to integrate into other indicators.
The linear regression channel consists of several parallel lines equidistant from the upper and lower part of the linear regression trend line. The distance between the channel boundaries and the regression line is equal to the deviation of the maximum closing price from the regression line.

FiboPivotsIndicator is the indicator for intraday traders looking for key breakout levels and target levels on the chart. It uses automatic Fibonacci extensions and pivot points to highlight price event areas. FiboPivotsIndicator is a unique combination of Fibonacci extensions and pivot points for price action traders.
This breakout trading tool is suitable for both trend following and swing trading strategies. Indicators such as moving averages, stochastics and RSI are well suited for this

The GoldenBufferPattern indicator uses several indicator buffers (Candles+Fractals+ZigzagColor+ColorMaLine).
The indicator is recommended to be used together with other indicators or using the Martinheim Method. We use this method with this indicator, as well as some of our other proprietary filters and trading strategies in particular, in our Experts Advisors on ProfRoboTrading.

To get access to MT4 version please click https://www.mql5.com/en/market/product/130055  ; - This is the exact conversion from TradingView: "Ut Alart Bot Indicator". - You can message in private chat for further changes you need. Here is the source code of a simple Expert Advisor operating based on signals from Ut Bot Indicator . #property copyright "This EA is only education purpose only use it ur own risk" #property link " https://sites.google.com/view/automationfx/home " #property versio
FREE

Golden Trend Pulse — trend indicator developed specifically for Gold, also applicable to the Cryptocurrency and Stock markets. The indicator is designed for precise determination of market trends using advanced analytical methods. The tool combines multifactor analysis of price dynamics and adaptive filtering of market noise, ensuring high accuracy in identifying key entry and exit points. Thanks to its intelligent system, the indicator effectively handles market variability, minimizing false
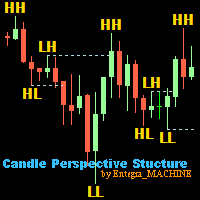
Candle Perspective Structure Indicator MT5 is a simple indicator that defines and displays the candlestick structure of the market. This indicator will suit both experienced traders and beginners who find it difficult to follow the structure visually.
Main functions: Determining High and Low swings using the three candlestick pattern. Determination of structure breaks. Setting the visual display of structural elements. Setting the period for which the structure is analysed. Input parameters:
FREE

The Opportunity System: Forex Gold Indicator The Opportunity System is a powerful and intuitive Forex Gold Indicator designed to help traders identify prime entry and exit points for trading gold (XAU/USD). This advanced indicator combines the strengths of two of the most popular technical analysis tools – the Stochastic Oscillator and the MACD (Moving Average Convergence Divergence) – to provide precise, real-time insights into market trends and potential reversals. Key Features: Stochastic Osc

Arrow indicator for forex trading using scalping strategy on popular currency pairs, bitcoin, gold, on m1 timeframe and others. The indicator has entry point settings, trend settings for higher timeframes, and various indicator filters, it is also possible to set up time trading intervals for yourself, in which you will receive signal arrows above the candles, as well as pop-up windows with alerts, or notifications on your phone via ID. The settings are simple, the strategy is ready, new sets an
If you love this indicator, please leave a positive rating and comment, it will be a source of motivation to help me create more products <3 Key Takeaways VWAP is a trading benchmark that typically is most useful to short-term traders. VWAP is used in different ways by traders . Traders may use it as a trend confirmation tool and build trading rules around it. Also, If prices below VWAP and move above it, c an be used by traders as a sell signal. If prices above VWAP and move below it, ca
FREE

Switching between charts to analyse market trends across multiple timeframes can quickly become a tiresome task. Finding confluence (alignment across timeframes) is essential to making informed trading decisions. This innovative indicator simplifies the process, allowing you to see trends on multiple lower timeframes directly from a higher timeframe chart. With this indicator, you can monitor four Heiken Ashi setups running simultaneously, each on a different timeframe. The result is a clear, la

Chronolines – Temporal Support and Resistance Levels for MetaTrader 5 Introduction to Chronolines
Chronolines is a graphical indicator designed to identify and visualize temporal support and resistance levels using the Highs and Lows of four predefined periods. It is compatible with all assets available on MetaTrader 5 , including stocks, currencies, commodities, indices, and cryptocurrencies, offering a logical and structured approach to tracking market behavior. Lines and Periods
Chronolines
Adaptive Trend Metrix Adaptive Trend Metrix is a fxtool for assessing the current state of the market that adapts to changes in volatility, helping to determine the direction and strength of the trend by taking into account price dynamics. One aspect of this strategy is its ability to change and use different parameters based on price behavior. For example, it takes into account the current market volatility to adjust sensitivity to price fluctuations and identify entry and exit points. Adaptiv
BBVectorDynamics_indicator is an innovative trading system specifically designed for volatile markets. Based on unique algorithms for analyzing market forces and identifying imbalances between buyers and sellers, this system helps you make precise and well-considered decisions in the trading process. Main features of the bb vector dynamics_indicator:
Calculation of dynamic vectors. System determines the differences between the extreme price values and smoothed averages over a specified period.
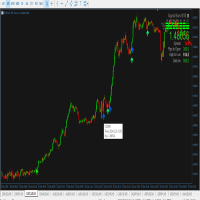
Dynamic Center of Gravity Indicator Revolutionary Price Action Trading System Harness the power of price momentum with the Dynamic Center of Gravity indicator - an advanced price action trading tool designed for serious traders. This innovative indicator identifies powerful gravity zones that attract rapid price movements, creating high-probability trading opportunities when momentum breaks free from these zones. Key Features Pure price action analysis - no lagging indicators Works effectively a
The Hybrid Trend Impulse indicator is an advanced tool that combines modern approaches to trend and impulse analysis, offering unique capabilities for effective deposit management. Key advantages of the HybridTrendImpulse_indicator: Nonlinear dynamics: The method of interaction between opening prices forms a unique nonlinear model that is particularly sensitive to significant price fluctuations, increasing their significance and making the indicator ideal for working in high volatility conditio

The Pivot Indicator is a vital tool for technical analysis used by traders in the financial markets. Designed to assist in identifying potential reversal points or trend changes, this indicator provides valuable insights into key levels in the market. Key features of the Pivot Indicator include: Automatic Calculations: The Pivot Indicator automatically calculates Pivot Point, Support, and Resistance levels based on the previous period's high, low, and close prices. This eliminates the complexity
FREE
CrossPoint5 is an indicator that helps novice traders.
In addition to the standard "Crosshair" function (Ctrl + F), CrossPoint5 will show you how to set the StopLoss and TakeProfit levels correctly, taking into account the minimum allowable level, calculate the number of points between two points and convert this into the currency of the account, taking into account the expected lot of the transaction.
Sometimes, when opening a deal, a novice trader completely forgets about the spread.
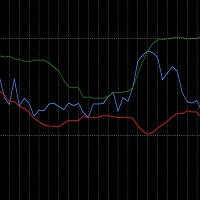
The RSI_BBands is a custom indicator designed to combine the Relative Strength Index (RSI) and Bollinger Bands (BB) for enhanced market analysis. It calculates the RSI using a specified period (default 14) and overlays Bollinger Bands around the RSI values, with adjustable parameters for the Bollinger Bands period and deviation.
Check more HERE
Key Features: RSI Calculation: The RSI is calculated based on price changes, with higher values indicating overbought conditions and lower values indi
FREE
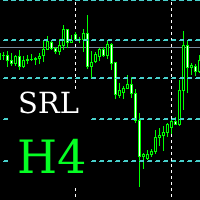
An indicator for determining and displaying support and resistance levels on the H4 chart over the past 180 days. The algorithm searches for local minima and maxima, filters levels to eliminate closely spaced values, and then visualizes them on a graph. Defining key levels Support levels: lows at which the price slowed down or reversed upward. Resistance levels: highs where the price had difficulty rising further.
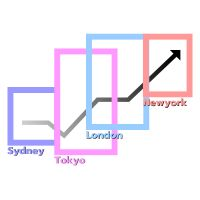
Time Zones and the Forex Market
The Forex market operates continuously 24 hours a day, facilitated by its global distribution across various time zones. The market is anchored by four primary trading centers: Sydney , Tokyo , London , and New York . Each trading center has specific opening and closing times according to its respective time zone. These differences significantly impact market volatility and trading opportunities during each session. Features Enable/Disable Date Display Enable/Di
FREE
Custom Heiken Ashi and Moving Averages-Based Signal Indicator Overview
This Heiken Ashi and Moving Average-based indicator is designed to identify trend-following buy and sell signals by analyzing the relationship between three Exponential Moving Averages (EMAs). It applies Heiken Ashi smoothing to filter market noise and improve trend clarity. EMA Crossovers for Trend Detection – Uses 3, 8, and 25-period EMAs to confirm trends. Heiken Ashi Smoothing – Reduces market noise for better trend vis
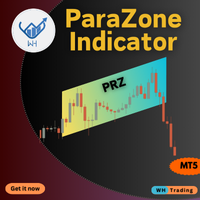
The ParaZone Indicator MT5 helps you spot areas where price trends are likely to reverse. It marks these zones on your chart using a unique parallelogram shape, making it easier to find the best points to enter or exit trades. Whether you’re a beginner or experienced trader, this tool can help improve your trading decisions. Key Features: Accurate Reversal Detection: Identifies key zones where price may change direction. Dynamic Zone Adaptation: Zones adjust in real-time to follow market movemen
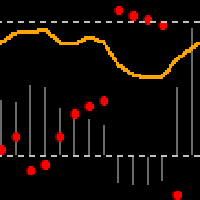
The stochastic indicator itself creates false signals. One way to determine that the price is trending is to use the parabolic SAR indicator. As a rule, it is plotted on the chart.
The projection of the SAR into the Stochastic Indicator is not complicated (pSAR-min)/(max-min). This will allow you to track price movement from two views in one place.
It depends very much on the parameter settings.
If the price is trending, the SAR moves towards the midpoints or close to them. On the other hand, a
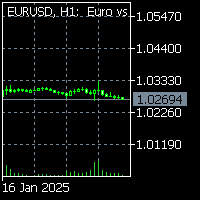
To get access to MT4 version please click here . This is the exact conversion from TradingView: "Fearzone - Contrarian Indicator" by " Zeiierman ". The screenshot shows similar results from tradingview and Metatrader when tested on ICMarkets on both platforms. This is a light-load processing and non-repaint indicator. All input options are available. Buffers are available for processing in EAs. You can message in private chat for further changes you need. Thanks for downloading
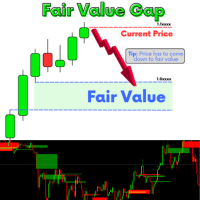
A fair value gap (FVG) is a temporary price gap that occurs when the price of a stock or security is out of line with its fair value. This gap is often caused by an imbalance between buyers and sellers. How it works Price imbalance When there is an imbalance between buyers and sellers, the price of a security can move too quickly. Price gap This creates an unadjusted area on the price chart, known as the fair value gap Price correction The price is often drawn back to the fair value gap, as i
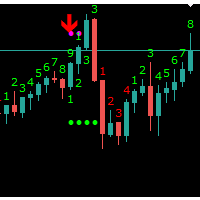
Indicator Sequential Through a multi-phase price comparative process consisting of the Setup and Countdown indicators, the Sequential indicator analyzes otherwise incongruent price data to provide insight into the strength or weakness of the market’s trend and its likelihood of reversing The Mechanics of Sequential We have the market's number The majority of the DeMARK Indicators are designed to anticipate price exhaustion as opposed to following the trend. Identifying likely inflection points

DESCRIÇÃO
ICSM (Impulse-Correction SCOB Mapper) é o indicador que analisa o movimento do preço e identifica impulsos válidos, correções e SCOBs (Single Candle Order Block). É uma ferramenta poderosa que pode ser usada com qualquer tipo de análise técnica porque é flexível, informativa, fácil de usar e melhora substancialmente a consciência do trader sobre as zonas de interesse mais líquidas.
CONFIGURAÇÕES
Geral | Visuais
Tema de cor — define o tema de cor do ICSM.
SCOB | Visuais
Mostrar S

if you want to test it : private message me ( MT5 demo testing doesn't work ) Designed to help traders gain a deeper understanding of the market’s true order flow dynamics . By visualizing the “ footprints ” left by candles, this indicator reveals how the delta ( the difference between buying and selling pressure ) changes during the candle formation, as well as how volume fluctuates at different price levels. These insights are essential for traders seeking to identify reversals, breakouts, and
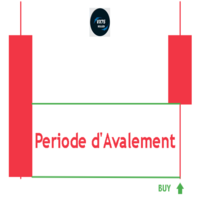
Indicador Engulfing Period V75Killed: Revolucione sua estratégia de trading! (Este indicador é PRIVADO e destinado exclusivamente a traders que conhecem seu propósito e valor específicos). O Indicador Engulfing Period V75Killed é uma ferramenta revolucionária para traders que desejam identificar facilmente períodos-chave de engolfamento em múltiplos períodos de tempo. Marcando zonas de engolfamento diretamente no seu gráfico, este indicador economiza tempo e aumenta sua capacidade de aproveitar
FREE
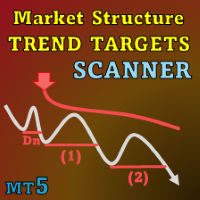
Special offer : ALL TOOLS , just $35 each! New tools will be $30 for the first week or the first 3 purchases ! Trading Tools Channel on MQL5 : Join my MQL5 channel to update the latest news from me I. Introdução
Market Structure Trend Targets Scanner é uma ferramenta poderosa para analisar tendências de mercado, identificar pontos de rompimento e gerenciar riscos por meio de um stop loss dinâmico. Ao rastrear altas e baixas anteriores para identificar rompimentos, esta ferramenta
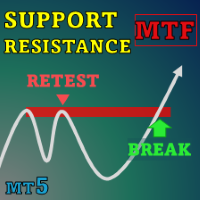
Special offer : ALL TOOLS , just $35 each! New tools will be $30 for the first week or the first 3 purchases ! Trading Tools Channel on MQL5 : Join my MQL5 channel to update the latest news from me No cenário em constante mudança do comércio financeiro, identificar e analisar com precisão os níveis de suporte e resistência é essencial para tomar decisões de investimento informadas. SnR Retest and Break Multi-Timeframe é um indicador de suporte e resistência projetado para aprimorar

Timeframes Trend Scanner is a trend analyzer or trend screener indicator that helps you know the trend in all timeframes of selected symbol you are watching .
This indicator provides clear & detailed analysis results on a beautiful dashboard, let you able to use this result right away without need to do any additional analysis. How it works
Step 1: Calculate values of 23 selected & trusted technical indicators (Oscillator & Moving Average indicators)
Step 2: Analyze all indicators using bes

Versão MT4 https://www.mql5.com/en/market/product/129411 Versão MT5 https://www.mql5.com/en/market/product/129412
O Dashboard Scanner Kalman é uma ferramenta avançada de digitalização multissímbolo e multiperíodo, concebida para simplificar o seu processo de negociação, aproveitando os poderosos cálculos de nível de tendência e suporte-resistência do Kalman. Este indicador combina algoritmos de acompanhamento de tendências e análise precisa de suporte e resistência para o ajudar a identificar

Fibonacci Probability: O Poder da Análise Técnica ao seu Alcance Transforme sua análise de mercado com o Indicador Fibonacci Probability, uma ferramenta essencial para traders que desejam identificar níveis críticos de suporte e resistência com precisão milimétrica. Desenvolvido com base nos princípios da sequência de Fibonacci, este indicador oferece uma análise abrangente dos movimentos do mercado, ajudando você a tomar decisões mais informadas e estratégicas. Funcionalidades do Indicador: Ní

Pivot Math Support and Resistance Lines indicator — indicator showing pivot lines, which will definitely help every trader who knows how to trade with resistance, support and pivot lines. It shows 8 different lines (additional lines are also possible) on the main chart, helping you find the best points to buy, sell and exit positions. Input parameters: P (default = 64) — period in bars or other periods (set using MMPeriod), on which the lines will be calculated. The smaller this number, the "f
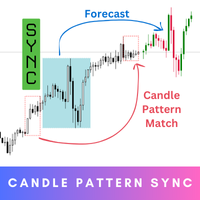
Candle Pattern Sync is your ultimate tool for precision and insight in trading. Step into the future of trading with this innovative indicator that’s designed to help you understand market behavior by analyzing historical patterns and giving you an idea of what might come next. While the forecasts provide valuable probabilities based on history, they’re not guarantees – think of them as a powerful guide to inform your decisions, not a definitive answer. MT4 Version - https://www.mql5.com/en/m
O Mercado MetaTrader é a única loja onde você pode baixar um robô demonstração de negociação gratuitamente para testes e otimização usando dados históricos.
Leia a visão geral e opiniões de outros clientes sobre os aplicativos, faça o download para o seu terminal e teste um robô de negociação antes de comprá-lo. Apenas no Mercado MetaTrader você pode testar um aplicativo de forma absolutamente gratuita.
Você está perdendo oportunidades de negociação:
- Aplicativos de negociação gratuitos
- 8 000+ sinais para cópia
- Notícias econômicas para análise dos mercados financeiros
Registro
Login
Se você não tem uma conta, por favor registre-se
Para login e uso do site MQL5.com, você deve ativar o uso de cookies.
Ative esta opção no seu navegador, caso contrário você não poderá fazer login.