Conheça o Mercado MQL5 no YouTube, assista aos vídeos tutoriais
Como comprar um robô de negociação ou indicador?
Execute seu EA na
hospedagem virtual
hospedagem virtual
Teste indicadores/robôs de negociação antes de comprá-los
Quer ganhar dinheiro no Mercado?
Como apresentar um produto para o consumidor final?
Novos Indicadores Técnicos para MetaTrader 5 - 28
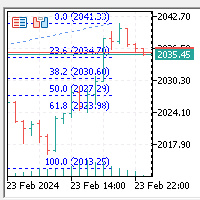
This indicator automatically generates Fibonacci regression lines in the K-line window: 0.0%, 23.6%, 38.2%, 50.0%, 61.8%, and 100.0%, following the displayed price. Zoom In, Zoom Out, Time Frame (M1, M5, M15, M30, H1, H4, D1, W1, MN) can automatically update and generate when the cycle changes, with the highest price worn up and the lowest level broken down. Both upward and downward trends can automatically adjust the direction of the Fibonacci regression line.

The "Standardize" indicator is a technical analysis tool designed to standardize and smooth price or volume data to highlight significant patterns and reduce market noise, making it easier to interpret and analyze.
Description & Functionality: Standardization : The indicator standardizes price or volume values by subtracting the mean and dividing by the standard deviation. This converts the data into a distribution with zero mean and standard deviation of one, allowing different data sets t
FREE

The Expert Advisor for this Indicator can be found here: https://www.mql5.com/en/market/product/115445 The Break of Structure (BoS) and Change of Character indicator is a powerful tool designed to identify key turning points in price movements on financial charts. By analyzing price action, this indicator highlights instances where the market shifts from a trend to a potential reversal or consolidation phase.
Utilizing sophisticated algorithms, the indicator identifies breakouts where the stru

This indicator can help you clearly identify trend changes in both bullish and bearish markets. The indicator compares the closing price of the last candle with the closing price of the candle "X" periods ago (input parameter). In an uptrend, an initial number '1' is plotted if a candle closes higher than the closing of a candle "X" periods ago. In a downtrend, an initial number '1' is plotted if a candle closes below the closing of a candle "X" periods ago. Subsequent numbers are plotted when e
FREE

One of the good and important features in MT4 is the availability of the iExposure indicator. With the iExposure indicator, traders can see a comparison of ongoing open positions and how much funds have been used, and more importantly what is the average value of these open positions.
Unfortunately this indicator is not available on MT5.
This indicator is iExposure MT4 which I rewrote using the MT5 programming language. This indicator can be used like iExposure on MT4 with the same functions.
FREE

This is MT5 version, MT4 on this link: Alert Line Pro MT4 Alert line pro allows to make alert when price cross these objects: Horizontal lines Trendline Price Zone (Rectangle) Alert when close current bar (have new bar) When the price crosses the alert lines, the software will sound an alarm and send a notification to the MetaTrader 5 mobile application. You need to settings your MetaQuotes ID of MT5 apps to MetaTrader5 software to get notification to the mobile phone. Sound files must be pl

Subscribe to the 'MA7 Trading' channel to receive notifications about new programs, updates and other information. Ask questions in the profile on the MQL5 .
Description of work
The 'MA7 Hypnum' indicator is based on the standard Commodity Channel Index (CCI) indicator. Shows overbought and oversold zones. Detailed information about the 'MA7 Hypnum' indicator.
Indicator settings
General settings: Period – period of the CCI indicator; Apply to – price type for calculating the CCI indicator; Up

Airplane Trend entry points should be used as potential market reversal points. The indicator works using the cyclic-wave dependence function. Thus, all entry points will be optimal points where the movement changes.
The simplest way to use the indicator is to open a trade in the direction of an existing trend. The best result is obtained by combining the indicator with fundamental news, it can act as a news filter, that is, it can show how the market reacts to this or that news.
The defa

Cryo is based on the process of identifying the rate of change in price growth and allows you to find entry and exit points from the market. A fundamental technical indicator that allows you to assess the current market situation in order to enter the market of the selected currency pair in a trend and with minimal risk.
The Cryo indicator was created on the basis of the original indicators for searching for extremes, the indicator is well suited for determining a reversal or a large sharp jer
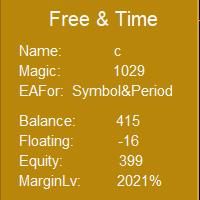
This indicator can use EAMagic to statistics EA since the operation of the revenue data and the current trading volume and trade data statistics, now the first version, should be slowly updated. When using, you must enter the number of EA's Magic when loading, in order to receive EA's transaction data. The part of the input currency pair and cycle can be filled in by the user to more clearly understand the currency pair and cycle that is currently being traded, and to facilitate the screenshot

Features
All Ichimoku Signals (Selectable) : Display all reliable signals generated by the Ichimoku indicator. You can choose which signals to view based on your preferences. Filter by Signal Strength : Sort signals by their strength—whether they are weak, neutral, or strong. Live Notifications : Receive real-time notifications for Ichimoku signals.
Transparent Cloud : Visualize the Ichimoku cloud in a transparent manner.
Available Signals
Tenkensen-Kijunsen Cross Price-Kijunsen Cross Price-C

For traders, monitoring price movements is a constant activity, because each price movement determines the action that must be taken next.
This simple indicator will helps traders to display prices more clearly in a larger size.
Users can set the font size and choose the color that will be displayed on the chart. There are three color options that can be selected to be displayed on the chart.
FREE
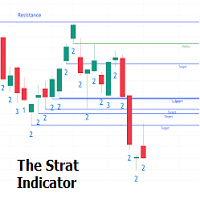
The Strat indicator is a full toolkit regarding most of the concepts within "The Strat" methodology with features such as candle numbering, pivot machine gun (PMG) highlighting, custom combo highlighting, and various statistics included.
Alerts are also included for the detection of specific candle numbers, custom combos, and PMGs.
SETTINGS
Show Numbers on Chart: Shows candle numbering on the chart.
Style Candles: Style candles based on the detected number. Only effective on non-line

Padrões Harmônicos são mais bem utilizados para prever pontos de virada no mercado. Esses padrões oferecem uma alta taxa de vitória e diversas oportunidades de negociação em um único dia de negociação. Nosso indicador identifica os Padrões Harmônicos mais populares com base nos princípios descritos na literatura de Negociação Harmônica. NOTAS IMPORTANTES: O indicador não repinta, não atrasa (detecta um padrão no ponto D) e não REDRAW (o padrão é válido ou cancelado). COMO USAR: Arraste e solte o

Padrão de varredura Esta ferramenta de ponta foi projetada para identificar a rotação da tendência de baixa e a rotação da tendência de alta com precisão incomparável,
capacitando você a tomar decisões comerciais informadas e ficar um passo à frente do mercado. Versão MT4: WH Sweep Pattern MT4 Recursos de padrão de varredura:
Ele detecta e desenha automaticamente a rotação de tendências de baixa e alta em seu gráfico, usando diferentes cores e estilos. Ele envia um alerta (som, e-mail, no

O indicador MACD Histogram é uma versão atualizada do indicador MACD, projetada para facilitar aos traders a compreensão das tendências do mercado e das mudanças de momentum. Ao contrário do MACD original, esta versão inclui um histograma, que é um gráfico de barras que mostra a diferença entre duas linhas: a linha MACD e a linha de sinal. Veja como funciona: quando a linha MACD está acima da linha de sinal, sugere um mercado de alta, e as barras do histograma são mostradas em verde. Por outro l

O indicador VIDYA-ENHANCED (Variable Index Dynamic Average) é uma ferramenta de análise técnica usada para identificar tendências e movimentos laterais.
Ele ajusta dinamicamente sua sensibilidade com base na volatilidade do mercado, usando o Chande Momentum Oscillator como um índice de volatilidade. Esse recurso permite que o VIDYA-ENHANCED seja mais ágil durante os períodos de movimentos significativos de preços, mantendo-se mais estável durante as fases menos voláteis.
Recursos:
- Selecio

TG Ponto de Cobertura Este Indicador verifica o seu resultado das operações no dia relativo ao ativo do gráfico e adiciona uma linha no preço correspondente ao ponto de cobertura para a posição aberta, considerando o preço de entrada e o tamanho do lote. O ponto de cobertura será recalculado após novas entradas, se baseando no preço médio da operação aberta e o tamanho do lote.
Se o resultado do dia estiver zerado, uma linha será exibida no preço da operação atual. Se o resultado do dia estiver
FREE

TG MTF MA MT5 is designed to display a multi-timeframe moving average (MA) on any chart timeframe while allowing users to specify and view the MA values from a particular timeframe across all timeframes. This functionality enables users to focus on the moving average of a specific timeframe without switching charts. By isolating the moving average values of a specific timeframe across all timeframes, users can gain insights into the trend dynamics and potential trading opportunities without sw
FREE

The "SMC Trading Strategy" or "Smart Money Concept" is a trading strategy that focuses on understanding and following the movements of "large capital" or "Smart Money", which usually refers to institutional investors or major players who can influence the stock or asset markets. This strategy relies on technical and behavioral market analysis to predict market or stock price directions by observing the actions of Smart Money. These investors are believed to have more information, resources, and
FREE

Subscribe to the 'MA7 Trading' channel to receive notifications about new programs, updates and other information. Ask questions in the profile on the MQL5 .
Description of work
The 'MA7 Aster' indicator is based on the standard Moving Average (MA) indicator. Shows the price deviation from the moving average. Detailed information about the 'MA7 Aster' indicator.
Indicator settings
General settings: Period – MA period; Method – MA method; Apply to – price type; Minimum distance – minimum dista

Volume Profile เป็นเครื่องมือที่ใช้สำหรับการวิเคราะห์ระดับการซื้อขายของตลาดในแต่ละระยะเวลาโดยใช้ปริมาณการซื้อขาย (volume) ซึ่งช่วยให้เราเข้าใจว่ามีการซื้อขายเกิดขึ้นมากที่สุดที่ราคาใด รวมทั้งช่วยในการหาจุดที่มีความนิยมในการซื้อขาย (Point of Control: POC) และระดับการซื้อขายอื่น ๆ ที่สำคัญ เรียกว่า Value Area. การใช้งาน Volume Profile ในการวิเคราะห์ตลาดมักจะมีขั้นตอนดังนี้: กำหนดระยะเวลาที่ต้องการวิเคราะห์ : เราต้องกำหนดระยะเวลาที่เราสนใจในการวิเคราะห์ Volume Profile เช่น ชั่วโมง, วัน, หรือสัปดาห์

The indicator plots up/down buffer arrows in the chart window two of the following indicator conditions are met. Moving Average ; Moving Average Convergence/Divergence (MACD ); Oscillator of Moving Averages (OsMA ); Stochastic Oscillator ; Relative Strength Index (RSI) ; Commodity Channel Index (CCI) ; Relative Vigor Index (RVI ); Average Directional Index (ADX) ; Triple Exponential Average ; Bollinger Bands ;
ตัวบ่งชี้จะพล็อตลูกศรขึ้น/ลงในหน้าต่างแผนภูมิเมื่อตรงตามเงื่อนไขของตัวบ่งชี้สองตัวต่อ

"Support and Resistance" is a fundamental concept in technical analysis for trading stocks, currencies, or other assets in financial markets. Here's how to use it: Identifying Support Support is a price level where buying is strong. When the price drops to this level, there tends to be significant buying activity, preventing the price from falling further. Identifing Support: Look for the lowest points in a given period and find levels where the price has bounced back up multiple times. Usage:
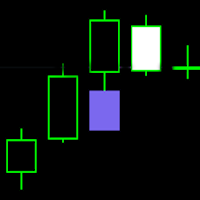
FVG - Fair Value Gap indicator is a three candle pattern indicator . It find inefficiencies or imbalances in market. It act as magnet before continue the trend.
indicator key function
1. No object is used to draw the plot. You can use this to build EA and backtest also.
2. Min and max value to Filter-out the noises .
It use as retest zone and can be use as entry price also. It popular among price action traders. your suggestion and comments are welcome and hopping that you will find this hel
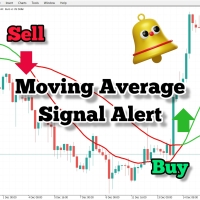
Se você usa médias móveis em sua estratégia de negociação, então este indicador pode ser muito útil para você. Ele fornece alertas quando há um cruzamento de duas médias móveis, envia alertas sonoros, exibe notificações em sua plataforma de negociação e também envia um e-mail sobre o evento. Ele vem com configurações facilmente personalizáveis para se adaptar ao seu próprio estilo e estratégia de negociação. Parâmetros ajustáveis: MA rápida MA lenta Enviar e-mail Alertas sonoros Notificações pu
FREE
O indicador Candle_Timer_and_Spread mostra em um gráfico o tempo até o final da vela e a porcentagem de variação do preço junto com o spread para os símbolos selecionados.
O cronômetro para o tempo até o final da vela no período atual e a variação do preço como uma porcentagem em relação ao preço de abertura do dia está localizado por padrão no canto superior direito do gráfico. O painel mostra o spread e a variação percentual do preço atual em relação à abertura do dia para os símbolos seleci
FREE

Este é um indicador projetado mecanicamente com base na ação do preço do castiçal. Funciona em qualquer instrumento de negociação produzindo alertas sempre que um impulso de compra ou venda é gerado, porém possui vídeo e documentos explicativos para validação de sinais fornecendo também técnicas de entrada e saída. Pesquise no youtube benjc trade advisor e localize vídeos explicativos deste produto.
A versão mais recente apresenta restrição de tendência e oscilador para filtrar sinais e torná-
FREE

This is Wilder's ADX with cloud presentation of DI+ & DI- lines. Features
4 standard lines of the ADX indicator: DI+, DI-, ADX, ADXR cloud presentation of DI+/DI- lines with transparent colors applicable to all time-frames and all markets
What Is ADX
J. Welles Wilder Jr., the developer of well-known indicators such as RSI, ATR, and Parabolic SAR, believed that the Directional Movement System, which is partially implemented in ADX indicator, was his most satisfying achievement. In his 1978 book,
FREE

News Indicator. Shows the interest rate of 12 countries (Australia, Brazil, Canada, Mexico, euro zone, UK, India, New Zealand, Switzerland, United States, South Korea, Japan). It will help to analyze the impact of the interest rate on the exchange rate. It makes sense to set an indicator on large timeframes. To improve the information content, it makes sense to change the settings style of the indicator of the desired country, so that the line stands out from the total mass of indicators, as ind
FREE

The MACD 2 Line Indicator is a powerful, upgraded version of the classic Moving Average Convergence Divergence (MACD) indicator.
This tool is the embodiment of versatility and functionality, capable of delivering comprehensive market insights to both beginner and advanced traders. The MACD 2 Line Indicator for MQL4 offers a dynamic perspective of market momentum and direction, through clear, visually compelling charts and real-time analysis.
Metatrader4 Version | How-to Install Product | How-t
FREE
The DYJ SignalSourceOfWPR is based on WPR indicator. It can be used for any currency pair and timeframe. The WPR recommends Indicator values ranging between 80 and 100% indicate that the market is oversold. Indicator values ranging between 0 and 20% indicate that the market is overbought. The entry signal of this indicator is a turning point in the trend.
The indicator uses analog trading technology,
Provide you with indicators to evaluate the overall profit of the opening signal and closi

The Plasma Trend indicator is a simple technical indication that is used to determine the current trend direction in the market. The Plasma Trend indicator is a powerful tool for determining the direction of the trend in the Forex market. It is based on both standard technical indicators and proprietary mathematical calculations, which provides a more accurate and reliable trend determination. Its implementation in the form of lines of two colors simplifies the visual determination of a change

The Antique Trend Indicator is a revolutionary trend trading and filtering solution with all the important features of a trend tool built into one tool! The Antique Trend indicator is good for any trader, suitable for any trader both for Forex and binary options. There is no need to configure anything, everything has been perfected by time and experience, it works great during flats and trends.
The Antique Trend indicator is a tool for technical analysis of financial markets, reflecting curren

Full implementation of Directional Movement System for trading, originally developed by Welles Wilder, with modifications to improve profitability, to reduce the number of unfavorable signals, and with Stop Loss lines.
No re-paint
Features
Buy/sell signals displayed on the chart Stop levels visually indicated on the chart Profit-taking points presented in the indicator window Exit points for unfavorable positions presented in the indicator window Signal confirmation through high/low swing cros
IQ FX Correlation Matrix is a powerful multi-timeframe dashboard that helps traders analyze real-time currency correlations across multiple forex pairs. With customizable settings, sleek design, and one-click symbol switching, it enhances trade accuracy, reduces risk, and identifies profitable correlation-based opportunities. Download the Metatrader 4 Version Message us here after purchase to get the Indicator Manual. Download Now! Offer valid only for next 10 Buyers. Price will increase gradua

The indicator is designed for displaying the following price levels on the chart: Previous day's high and low. Previous week's high and low. Previous month's high and low. Each of the level types is customizable. In the indicator settings, you set line style, line color, enable or disable separate levels.
Configurations ----Day------------------------------------------------- DayLevels - enable/disable previous day's levels. WidthDayLines - line width of daily levels. ColorDayLines - line
FREE

Kindly rate and comment about the product for upgradation & Support
The 5 EMA is plotted in green color ( Lime ). The 14 EMA is plotted in red color ( Red ). The 20 EMA is plotted in blue color ( Blue ). The 200 EMA is plotted in black color ( Black ). The 200 EMA is plotted in yellow color ( Yellow ).
The Quarter EMA that provided calculates and plots four Exponential Moving Averages (EMAs) on the chart using different periods: 5, 14, 20, and 200. Each EMA is
FREE

The Lyxes indicator is designed to detect price trends and allows you to quickly determine not only the direction of the trend, but also understand the levels of interaction between buyers and sellers. The indicator works on all timeframes and currency pairs. The indicator gives fairly accurate signals and is commonly used in both trend and flat markets. It is advisable to use the indicator in conjunction with other tools for more reliable signals and more informed decisions. The indicator does

The Reversal Trend indicator was created on the basis of the original indicators for searching for extremes, the indicator is well suited for determining a reversal or a large sharp jerk in one direction, thanks to it you will know when this happens, it will notify you by the appearance of a blue dot to buy red to sell.
It is based on the process of identifying the rate of change in price growth and allows you to find entry and exit points from the market.
a fundamental technical indicator th

Subscribe to the 'MA7 Trading' channel to receive notifications about new programs, updates and other information. Ask questions in the profile on the MQL5 .
Description of work
The 'MA7 Galega' indicator is based on the standard Moving Average (MA) indicator. Shows a puncture of the moving average. Detailed information about the 'MA7 Galega' indicator.
Indicator settings
General settings: Period – MA period; Method – MA method; Apply to – price type; Consider the direction of the candle .
M
Subscribe to the 'MA7 Trading' channel to receive notifications about new programs, updates and other information. Ask questions in the profile on the MQL5 .
Description of work
The 'MA7 Ixora' indicator is based on the standard Moving Average (MA) indicator. Shows the intersection of the fast and slow moving averages. Detailed information about the 'MA7 Ixora' indicator.
Indicator settings
General settings: Consider the direction of the candle .
Fast moving average settings: Period – MA per

The forex spread is the difference between a forex broker's sell rate and buy rate when exchanging or trading currencies . Spreads can be narrower or wider, depending on the currency involved, the time of day a trade is initiated, and economic conditions.
Forex Spread WatchDog :
This Forex indicator ensures that you are getting the best spreads while trading, and guards against broker spread widening.
FREE

Make no mistake, this is not just another indicator; it's much more than that! Welcome to a groundbreaking approach! Sunrise Divergence is not just another tool; it represents a deep understanding in how market dynamics are analyzed and traded. This indicator is crafted for traders who seek to navigate the markets with precision, leveraging the powerful concept of asset correlation, both positive and negative, to unveil trading opportunities that many overlook. In the markets, understanding the

Liberte o Potencial das suas Operações com o Indicador AlphaWave! Tranquilidade nas suas Operações: O Indicador AlphaWave foi desenvolvido para trazer calma às suas operações, suavizando o gráfico e proporcionando uma leitura precisa da direção da tendência. Nunca foi tão fácil tomar decisões de operação claras. Tecnologia Revolucionária de Suavização com 10 Modos: Experimente uma apresentação suave e clara do gráfico com o Indicador AlphaWave. A tecnologia revolucionária de suavização oferece

Quantas vezes você procurou por um PIVOT que funcionasse em uma vela específica todo dia?
Muitos traders gostam de estimar a direção da tendência do dia com base em um horário específico de todos os dias, como 30 minutos após a abertura do mercado, ou às 12h, e assim por diante.
Esse indicador permite que você especifique um determinado horário (hora e minuto) e traça um pivô a partir desse horário até o dia seguinte, no mesmo horário. Ele mostra cinco linhas com base nesse candle/horário esp
FREE

Pips on Candles shows the number of pips involved in each candle on the chart. It is possible to set 3 different ranges for counting on each single candle via the RangeType parameter: With "HighLow" you count the pips present between the minimum and the maximum. The number is shown under each candlestick on the chart. With "OpenClose" you count the pips present between the opening and closing price of the candle. The number is shown under each candlestick on the chart. With "HighDistAndLowDist"

O Keltner-Enhanced melhora a precisão e a legibilidade dos Keltner Channels com muitas opções de ajuste, adicionando CINCO novas modalidades de preço ao padrão do Metatrader.
O indicador Keltner-E é um indicador em faixas semelhante às Bandas de Bollinger e aos Envelopes de Média Móvel. Eles consistem em um envelope superior acima de uma linha média e um envelope inferior abaixo da linha média.
As principais ocorrências a serem observadas ao usar os Canais de Keltner são rompimentos acima do
FREE

Quantas vezes você já procurou um PIVOT que funcionasse em um período de tempo específico todos os dias?
Muitos traders gostam de estimar a direção da tendência do dia com base em um intervalo de tempo específico todos os dias, como de 2 horas antes da abertura da NYSE até 1 hora depois, ou da abertura da NYSE até 30 minutos depois.
Esse indicador permite que você especifique um determinado intervalo de tempo (hora e minuto) e traça um pivô desse intervalo para o dia seguinte no mesmo interva

OBV MACD
Calculating MACD based on OBV data Features
3 outputs: MACD & Signal & Histogram 4 Colored Histogram Smoothing factor show/hide option for MACD & Signal lines Description
Among the few indicators developed for working with volume data, OBV (On Balance Volume) is the simplest yet most informative one. Its logic is straightforward: when the closing price is above the previous close, today's volume is added to the previous OBV; conversely, when the closing price is below the previous close
FREE
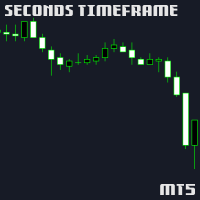
This is an extension indicator that allows the user to select any second time-frame from 1 to 60 second without any multiplier limitaion (ex, 7 seconds, 13 seconds ... are all allowed).
There is only one input called Interval that allows you to set the seconds timeframe you want given is in the range above. You can use indicators on that new time frame with no problems and also build your EAs based on any second timeframe. I hope this is useful, please let me know any bugs you find!
Note: Since
FREE
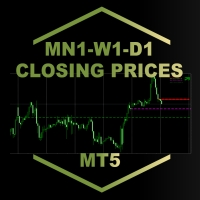
MN1-W1-D1 Close Price Indicator to Index Trading for MT5
The indicator draws lines to the close prices of the last closed bars of monthly, weekly and daily timeframes. Observably, these prices are significant support and resistance prices at major indices, like Nasdaq, DAX. The info panel always shows the prices relative to each other in the correct order. If the current price is the highest - i.e. higher than the last monthly, weekly and daily closing price - it is in the first row. The lowest

This indicator show Gann Swing Chart (One Bar) with multi layer wave. 1. Wave layer F1: Gann waves are drawn based on candles. SGann wave(Swing of Gann) is drawn based on Gann wave of wave layer F1. 2. Wave layer F2: Is a Gann wave drawn based on the SGann wave of wave layer F1. SGann waves are drawn based on Gann waves of wave layer F2. 3. Wave layer F3: Is a Gann wave drawn based on the SGann wave of wave layer F2. SGann waves are drawn based on Gann waves of wave layer F3. ---------Vi
FREE

Subscribe to the 'MA7 Trading' channel to receive notifications about new programs, updates and other information. Ask questions in the profile on the MQL5 .
Description of work
The 'MA7 Flax' indicator is based on the standard Average True Range (ATR) indicator and candle data. Shows candles that are larger in size relative to the ATR indicator value. Detailed information about the 'MA7 Flax' indicator.
Indicator settings
General settings: ATR period – Average True Range indicator period; AT

Subscribe to the 'MA7 Trading' channel to receive notifications about new programs, updates and other information. Ask questions in the profile on the MQL5 .
Description of work
The 'MA7 Viola' indicator is based on the standard Moving Average (MA) indicator. Shows a sharp increase or decrease in the moving average. Detailed information about the 'MA7 Viola' indicator.
Indicator settings
General settings: Difference – difference between the last two MA values, percentage; Period ; Method ; Ap

We have turned one application of the RSI indicator into a separate indicator, represented by red and green bars, which is incredibly simple and effective.
By simply inputting the parameters for the RSI, you can obtain the RSI indicator represented by red and green bars. The application of the RSI indicator has been expanded into a powerful new indicator, visually presented through red and green bars, undoubtedly an innovative move in the field of financial technical analysis. The design of th

RSI Barometer Pro provides traders and investors with intuitive insights into market sentiment and potential trend reversals by representing RSI values using red and green bars. The meticulous design of red and green bars in RSI Barometer Pro visually showcases market dynamics. When the bars appear green, it indicates that the RSI is below 50, suggesting a relatively stable market phase. Conversely, when the bars turn red, it signifies that the RSI is above 50, indicating potential market volat

The implementation of the Trend Turn trend indicator is simple - in the form of lines of two colors. The indicator algorithm is based on standard indicators as well as its own mathematical calculations.
The indicator will help users determine the direction of the trend. It will also become an indispensable advisor for entering the market or closing a position. This indicator is recommended for everyone, both beginners and professionals.
How to interpret information from the indicator. We sell

Product Name: RSI Momentum Gauge
Product Description: The RSI Momentum Gauge is an advanced indicator that transforms the traditional concept of overbought and oversold signals from the RSI (Relative Strength Index) into a visually intuitive representation using red and green bars. Designed to empower traders and investors with actionable insights, this innovative indicator provides a clear assessment of market conditions and potential trend reversals. The RSI Momentum Gauge's distinctive feat

One of the best trend indicators available to the public. Trend is your friend. Works on any pair, index, commodities, and cryptocurrency Correct trend lines Multiple confirmation lines Bollinger Bands trend confirmation Trend reversal prediction Trailing stop loss lines Scalping mini trends Signals Alerts and Notifications Highly flexible Easy settings Let me know in the reviews section what you think about it and if there are any features missing.
Tips: Your confirmation line will predict tre
FREE

This is diamond! Contact me to send you instruction and add you in group.
Diamond Pattern is based on Read The Market(RTM) concepts. The purpose of this model is to face the big players of the market (financial institutions and banks), As you know in financial markets, big traders try to fool small traders, but RTM prevent traders from getting trapped. This style is formed in terms of price candles and presented according to market supply and demand areas and no price oscillator is used in i

Parece que você forneceu informações sobre um indicador de negociação chamado SPIKE HUNTER para mercados de alta e baixa. Além disso, você mencionou instruções específicas para usar o indicador, incluindo sinais de compra e venda, seleção de índice, cronômetro de velas, características de suporte e resistência, e alertas. No entanto, gostaria de esclarecer que não consigo realizar downloads ou interagir com ferramentas externas, e não tenho a capacidade de acessar sites externos, incluindo o Wha

Classic MACD
It has MACD line, Signal line, and Histogram . The Histogram has 4 colors , showing its movement direction as simple as possible. The smoothing factor in the input helps to eliminate noisy signals. Besides different price types (hlc, hlcc, ohlc, ...), there is an option to use volume data as the source for MACD calculations (which is better to be used by real volume not unreliable tick volume). While the original MACD indicator uses Exponential Moving Average, this indicator provide
FREE

Currency Strength Dynamic Força da Moeda Dinâmica é um indicador da força da moeda. A força da moeda refere-se à direção da tendência da maioria ou de todos os pares de moedas dos quais uma moeda faz parte.
O indicador baseia-se em leituras da diferença entre médias móveis, semelhantes ao indicador MACD, nos 28 pares de moedas mais populares: principais e menores. Vantagens Método exclusivo de cálculo oscilatório Disponibilidade de botões para desabilitar ou habilitar linhas de moedas específi

Apresentando Algo Map Lite – um software de ponta projetado para revolucionar sua experiência de negociação. Esta ferramenta avançada integra-se perfeitamente com as suas sessões de negociação, fornecendo uma análise abrangente do nível de breakout em cada ocasião.
Além de sua interface intuitiva e funcionalidade de impressão em tempo real, Algo Map Lite se destaca por incorporar métricas meticulosas de taxa de vitória para fortalecer suas reivindicações de desempenho. O nosso compromisso co

O indicador Accurate Gold é uma ferramenta amigável que é intuitiva e simples de usar , independentemente do nível de experiência dos traders. Ele foi projetado para traders que buscam sinais precisos no período M5 no mercado de ouro. Este indicador emprega algoritmos matemáticos avançados para analisar movimentos de preços e dinâmica de volume, gerando sinais precisos de compra e venda. As características distintivas deste indicador, incluindo sua natureza de não repintura, fornecem

O HAshi-E é uma forma aprimorada de analisar os sinais do Heiken-Ashi.
Briefing:
O Heiken-Ashi é particularmente valorizado por sua capacidade de filtrar a volatilidade de curto prazo, o que o torna a ferramenta preferida para identificar e acompanhar tendências, ajuda na tomada de decisões sobre pontos de entrada e saída e auxilia na distinção entre sinais falsos e reversões genuínas de tendências. Diferentemente dos gráficos de velas tradicionais, as velas Heiken-Ashi são calculadas usando

O OBV (On-Balance Volume) é um indicador técnico que relaciona volume e preço para identificar movimentos de preço. A ideia básica por trás do OBV é que as mudanças no volume geralmente precedem as mudanças de preço. O indicador acumula volumes para períodos em que o preço fecha em alta e subtrai volumes para períodos em que o preço fecha em baixa. Isso resulta em um valor usado para identificar a direção da tendência do ativo.
A interpretação do OBV é simples: um OBV em alta sugere que os com

No campo da análise técnica, a ParbMA surge como uma ferramenta altamente intuitiva para examinar a tendência do SAR Parabólico . Essa abordagem inovadora utiliza uma linha personalizável, que se distingue por sua versatilidade em opções de cor, forma e largura. Essa flexibilidade aprimora a análise visual e ajuda significativamente na elaboração de estratégias e na tomada de decisões.
O ParbMA (Parabolic Moving Average) é um indicador técnico personalizado que combina os conceitos do Paraboli

Projetado por Welles Wilder para gráficos diários de commodities, o ADXW agora é usado em vários mercados por traders técnicos para avaliar a força de uma tendência ou mesmo uma tendência para negociações de curto ou longo prazo.
O ADXW usa um indicador direcional positivo (DI+) e negativo (DI-) além de sua linha de tendência (ADX).
De acordo com Wilder, uma tendência tem força quando o sinal ADX está acima de 25; a tendência é fraca (ou o preço não tem tendência) quando o ADX está abaixo de
O Mercado MetaTrader oferece um local conveniente e seguro para comprar aplicativos para a plataforma MetaTrader. Faça download de versões de demonstração gratuitas de Expert Advisors e indicadores a partir do seu terminal para testes no Testador de Estratégia.
Teste os aplicativos em diferentes modos para monitoramento do desempenho e assim fazer um pagamento para o produto que você deseja, usando o sistema de pagamento MQL5.community.
Você está perdendo oportunidades de negociação:
- Aplicativos de negociação gratuitos
- 8 000+ sinais para cópia
- Notícias econômicas para análise dos mercados financeiros
Registro
Login
Se você não tem uma conta, por favor registre-se
Para login e uso do site MQL5.com, você deve ativar o uso de cookies.
Ative esta opção no seu navegador, caso contrário você não poderá fazer login.