Conheça o Mercado MQL5 no YouTube, assista aos vídeos tutoriais
Como comprar um robô de negociação ou indicador?
Execute seu EA na
hospedagem virtual
hospedagem virtual
Teste indicadores/robôs de negociação antes de comprá-los
Quer ganhar dinheiro no Mercado?
Como apresentar um produto para o consumidor final?
Novos Indicadores Técnicos para MetaTrader 5 - 25

FRB Força - Indicador mostra a força atual do ativo entre compradores e vendedores. - Muito importante para quem opera através do Fluxo e também que deseja fazer Scalp. - Se a força vendedora for alta e o preço não cai, isto significa que os compradores estão segurando o preço sem agredir. Este é um sinal para uma possível entrada de compra. - Se a força compradora for alta e o preço não sobe, isto significa que os vendedores estão segurando o preço sem agredir. Este é um sinal para uma possíve
FREE

Signaling is a very interesting trend indicator. The Destroyer of Chaos indicator helps to identify either a new or an existing trend. One of the main definitions for monitoring the currency market is a trend, which is why this indicator was created. Its signals are based on a reliable algorithm. When used simultaneously on multiple timeframes, this indicator truly "makes the trend your friend". With it, you can follow trends on multiple timeframes in real time. One of the advantages of the indi

Provided Trend is a complex signal formation indicator. As a result of the work of internal algorithms, you can see only three types of signals on your chart. The first is a buy signal, the second is a sell signal, and the third is a market exit signal.
Options: CalcFlatSlow - The first parameter that controls the main function of splitting the price chart into waves. CalcFlatFast - The second parameter that controls the main function of splitting the price chart into waves. CalcFlatAvg - Par

We publish the indicator as a useful tool in trading and call this indicator the "Swiss Army Knife" because it provides many possibilities and combinations to help understand the material on the "Masters of Risk" trading system. The indicator itself is not part of the tools used in the "Masters of Risk" trading system.
The indicator consists of 3 separate multi-timeframe indicators, which in combination with each other help to reduce the "noise" of false signals. The first of the indicators ar

Able Turn indicator.
Currency pairs never rise or fall in a straight line. Their ups and downs are interspersed with rollbacks and reversals. Every rise and fall is reflected in your emotional state: hope is replaced by fear, and when it passes, hope appears again. The market uses your fear to prevent you from taking advantage of a strong position. At such moments you are most vulnerable.
Everything will change if you use the Able Turn indicator.
The Able Turn indicator was created to neu

The Trend A indicator is a forward-looking arrow indicator that reliably tracks the market trend, ignoring sharp market fluctuations and noise around the average price. It catches the trend and shows favorable moments of entering the market with arrows. The indicator can be used both for pipsing on short periods and for long-term trading. The indicator implements a kind of technical analysis based on the idea that the market is cyclical in nature.

Your Helper is a global trend indicator. The indicator should be used on a period not less than H1, H4 and higher is recommended. Despite the apparent simplicity of the indicator, it has complex analytical algorithms inside, with the help of which the system determines the moments of entries. The indicator gives accurate and timely signals to enter and exit a trade that appear on the current candle.
The main purpose of this indicator is to determine the moments of entries and exits from trans

Impulse Fibo indicator is used to determine price levels after some price impulse occurs. How to use it you can see in screenshots and video. In the indicator setup you can fix two different setups for two different patterns. For drawing convenience also two different rectangles can be easy put on the screen to draw support/resistance levels. .
Inputs Draw pattern 1 Line color - choose color from dropdown menu
Line style - choose style from dropdown menu
Line width - enter integer number 1,2

Perfect Sniper! is a triple indicator with support resistance detection, downtrend channel, uptrend channel Bands included! where he hunts the rebounds in the red lines for sale, in the green lines mark purchase, in the lower bands that are the breaks gives another second entry either buy or sell, perfect to take advantage of the double entrance, It is used in any temporality, It is used to scalp and long on h1 or h4 to D1. It works for Forex markets, All pairs. It is used for the synthetic inde

BandSniper! band indicator , programmed %100 to hunt rebounds on the bands both bounce for the downside and bounce for the upside,, It serves to hunt trends too! where you can see in the photo marked with arrows the buy and sell signals. can be used at any time, Ideal for scalping and long h1 or h4! works for all Forex pairs! and for all pairs of synthetic indices ! World Investor. Good profit
One of the basic needs of every trader is to have a checklist to enter every position. Of course, using pen and paper may not be convenient forever. With this indicator, you can have a small checklist next to the screen for each of your charts and use it for better use in your trades.
By pressing the r button, you can return everything to the original state.
MT4 Version
This indicator will have many updates and special settings will be added to it.
You can contact us via Instagram, Telegram

MACD (short for M oving A verage C onvergence/ D ivergence) is a popular trading indicator used in technical analysis of securities prices. It is designed to identify changes in the strength, direction, momentum, and duration of a trend in a security's price.
History Gerald Appel created the MACD line in the late 1970s. Thomas Aspray added the histogram feature to Appel's MACD in 1986.
The three major components and their formula 1. The MACD line: First, "PM Colored MACD" employs two
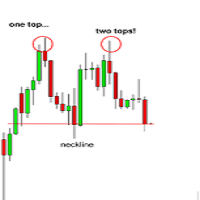
Hello all!
This is indicator 2 top and 2 bottom It will send alert to your phone when price hit top or bottom input uint InpMinHeight = 10; // Minumum Height/Depth input uint InpMaxDist = 20; // Maximum distance between the twin tops/bottoms input uint InpMinBars = 3; // Maximum number of bars after the top/bottom input string Inp_TOP_stringDOWN ="Signal Sell";// TOP: Level UP label input string Inp_BOTTOM_stringUP =
With dynamic Moving average, you can estimate the price movement, predict the next trend of price and have a better decision. Parameters setup: Period start <= Period Stop Period start >= 1
Maximum lines is 100 You can customize Moving average method: Simple averaging, Exponential averaging, Smoothed averaging, Linear-weighted averaging and price to apply: PRICE_CLOSE: Close price
PRICE_OPEN: Open price
PRICE_HIGH: The maximum price for the period
PRICE_LOW: The minimum price for the period
The Scalping Project EA follows a scalping breakout strategy. It trades the breakouts from relative highs and lows. For the entry stop orders are used for the fastest possible execution. Profits can be secured by the adjustable trailing stop. Since the strategy works with small average profits it is highly suggested to trade with a low spread and commission broker. Trading costs are crucial here! The backtests shown in the screenshots were done with the default settings. There might be better or
ONLY 3 COPIES OUT OF 10 LEFT AT $299! After that, the price will be raised to $349. IMPORTANT! Contact me immediately after the purchase to get instructions and a bonus! Advanced Fibo levels is a trading robot for the trading on forex. This is a Fibonacci system that designed to trade for most popular Fibonacci strategy that's completely automated. Warning:
I only sell EA's through MQL5.com. If someone contacts you saying it is me trying to sell you something, they are a Scammer. Block and rep

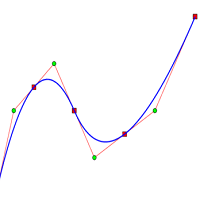
Fit line supports to extrapolation next movement of market, support for buy/sell decision. Indicator using spline algorithm to extrapolation. You can change number of spline with parameter "PointsNumber" and number of extrapolation point with "ExtrapolateBars". Eextrapolation points will be save into csv format, with prefix in parameter "PointsPrefix", and store in folder File of Data Folder.

Magnetic levels for MT5 is a great addition to your trading strategy if you use support and resistance levels, supply and demand zones. The price very often gives good entry points to the position exactly at the round levels and near them.
The indicator is fully customizable and easy to use: -Choose the number of levels to be displayed -Choose the distance Between The levels -Choose the color of the levels.
Can be added to your trading system for more confluence. Works very well when combin

To get access to MT4 version please click here . This is the exact conversion from TradingView: "Supertrend" by " KivancOzbilgic ". This is a light-load processing and non-repaint indicator. You can message in private chat for further changes you need. Here is the source code of a simple Expert Advisor operating based on signals from Supertrend . #include <Trade\Trade.mqh> CTrade trade; int handle_supertrend= 0 ; input group "EA Setting" input int magic_number= 123456 ; //magic number input dou

Este é um indicador muito simples e fácil de usar para todos. No entanto, é muito visual, útil e eficaz. É adequado para todos os símbolos Forex e qualquer período de tempo. Mas, com base em meus testes e investigações, não recomendo usá-lo com os prazos M1, M5, M15. Contexto. - Escolha alerta On/Off (padrão ON). - Selecione o tempo (segundos) entre 2 alertas. O padrão é 30 segundos Como funciona? - Uptrend—Quando a cor da barra é verde. - Tendência de baixa—Quando a cor da barra é laranja. - U
FREE

Este indicador exibe informações de preço filtradas na forma de três histogramas coloridos e uma linha colorida comum. Este é um indicador muito colorido e bonito. Ótimo para determinar a força e a direção do movimento dos preços. Este indicador tem configurações muito simples: 1) escolha de três opções para o cálculo do indicador: - original, - demarcador, - volume de equilíbrio. 2) seleção de cinco períodos diferentes. 3) seleção da cor exibida. 4) escolha da precisão. ///////////////////////
UR PulseScalp MT5 Um indicador de negociação calibrado para cambistas que buscam a vantagem máxima em mercados de ritmo acelerado
O UR PulseScalp MT5 é uma solução de negociação de ponta para cambistas que buscam a melhor vantagem em mercados de ritmo acelerado. Este indicador inovador é construído em uma fórmula cientificamente calibrada que combina o poder da Volatilidade, MoneyFlow e Força Relativa para criar um sinal altamente preciso e confiável.
Vantagens de usar o UR PulseScalp MT5:

TILLSON MOVING AVERAGE Também conhecido como indicador TMA ou T3. É uma média móvel que usa EMA e DEMA em sua fórmula e é calculada com uma expansão binomial de 3º grau . ... int handle1; //Handle of the Tillson TMA T3.EX5 custom indicator double euBuff1[]; int TMAperiod= 12 ; int TMSshift= 0 ; double VolumeFactor= 0.618 ; int OnInit () { ... handle1= iCustom ( NULL , PERIOD_CURRENT , "Market\\Tillson TMA T3.EX5" ,0,TMAperiod,0,0,TMSshift,0,0,VolumeFac
FREE

DONCHIAN CHANNEL DC É um indicador de tendência desenvolvido pela “Richard Donchian”, composto por 3 camadas, o canal superior, o canal inferior e o canal do meio. Ele é criado no Canal Donchian traçando os preços mais altos e mais baixos alcançados no período passado no gráfico de preços. Também é usado para medir a volatilidade do mercado, pois é um canal de expansão/contração de acordo com o aumento/diminuição da volatilidade dos preços. Method 0; Desenho do indicador do canal Donchian. Sinai
FREE
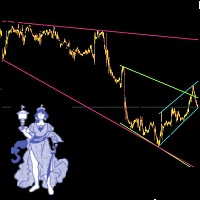
Leave a comment if you would like me to write an EA to trade these trendlines... if enough interest, will write an EA. Automatic Trendlines, updated automatically. To Set up 3 different (or mroe) Trendlines on chart, simply load the indicator as many times and name it differntly.. the example in the picture below is indicator 1 (loaded 1st time): Name: Long, StartBar: 50, BarCount: 500, Color: Pink indicator 2 (loaded 2nd time): Name: Short, StartBar: 20, BarCount: 200, Color: Green indicator 3
FREE

Indicador de múltiplas moedas e multiprazos Inside Bar (IB). Nos parâmetros, você pode especificar quaisquer moedas e prazos desejados. O painel exibe o último padrão da barra interna (e da barra mãe) encontrado, a posição atual do preço e o rompimento dos níveis das barras mãe e interna. Você pode definir o tamanho e a cor das barras e do texto nas células. O indicador também pode enviar notificações quando os níveis são quebrados. Ao clicar em uma célula com ponto final, o símbolo e ponto fin

- Times and Trades, também chamado de Time and Sales ou histórico de negócios, é uma ferramenta essencial para quem opera através do Tape Reading (Fluxo). - O Metatrader 5 não informa os dados das corretoras, sendo assim, impossível diferenciar quem enviou a ordem. - Os dados só podem ser usados por corretoras que informam os dados dos volumes de negociação, como a B3. No mercado forex não é possível usar.
FREE

To get access to MT4 version please click here . - This is the exact conversion from TradingView: "Twin Range Filter" by " colinmck ". - This is a light-load processing and non-repaint indicator. - All input options are available. - Buffers are available for processing in EAs. - You can message in private chat for further changes you need. Thanks for downloading

FRB Trader - Nossa missão é proporcionar o melhor suporte para os clientes através do conteúdo e ferramentas para que eles consigam os resultados esperados
FRB Suporte e Resistência - Indicador coloca linhas no gráfico para mostrar as regiões de Suporte e Resistência. - Você pode escolher o tempo gráfico que deseja fazer o cálculo, como também as cores das linhas. - Algoritmo calcula os pontos onde são considerados pontos fortes do ativo e são de extrema importância para tomada de decisões.
FREE

FRB Times and Trades Free
- Times and Trades, também chamado de Time and Sales ou histórico de negócios, é uma ferramenta essencial para quem opera através do Tape Reading (Fluxo). - O Metatrader 5 não informa os dados das corretoras, sendo assim, impossível diferenciar quem enviou a ordem. - Os dados só podem ser usados por corretoras que informam os dados dos volumes de negociação, como a B3. No mercado forex não é possível usar. VERSÃO PRO : https://www.mql5.com/pt/market/product/93726
FREE

Pivot Point Supertrend (corresponds to Pivot Point Super Trend indicator from Trading View) Pivot Point Period: Pivot point defined as highest high and highest low... input 2 = defining highest high and highest low with 2 bars on each side which are lower (for highest high) and are higher (for lowest low calculation) ATR Length : the ATR calculation is based on 10 periods ATR Factor: ATR multiplied by 3
FREE

The idea behind this indicator is to find all currency pairs that are over-bought or over-sold according to the RSI indicator at one go.
The RSI uses the default period of 14 (this can be changed in the settings) and scans all symbols to find the RSI level you will have specified. Once currency pairs that meet the specification are found, the indicator will open those charts for you incase those charts aren't open and proceed to write the full list of currencies on the experts tab.
FREE

Sniper Zones are our best kept secret for trading the forex markets profitably and extremely simple ! After years of profitable trading we are launching it to the public !
After thousands of hours of testing, we have developed an indicator that simplifies trading to the point where anyone can become a profitable trader. There exists certain zones and areas in the market that are used by institutions to move price and cause retail traders to lose their money ! We have done the hardwork and m

Get ALERTS for break of your TRENDLINES, SUPPORT LINES, RESISTANCE LINE, ANY LINE!!
1. Draw a line on the chart (Trend, support, resistance, whatever you like) and give it a name (e.g. MY EURUSD line) 2. Load the Indicator and input the Line Name the same name in Indicator INPUT so system knows the name of your line (= MY EURUSD line) 3. Get Alerts when Price breaks the line and closes Works on All Time frames and charts LEAVE A COMMENT AND IF THERE IS ENOUGH INTEREST I WILL WRITE AN EA WHICH
FREE
Volatility Crusher Indicator is a Non-Lag MT5 indicator which detect trades on any time frame. The indicator has alerts to buy and sell once a trade has been detected. It will also send pop-up signal to your mobile phone and you can trade anywhere you are with your phone while its generating signals for you on PC connected to VPS. Its recommended on m5 to h4 time frame on any pair on Deriv MT5 Broker. Pairs recommended: Volatility Index 10, Volatility Index 25, Volatility Index 100 Volatility I
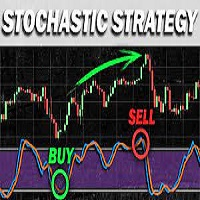
Stochastic cross alert signal overlay is indicator show signal buy and sell you can attach it easy in your chart mt5, it work all time frame it work all time frame Setting: input int KPeriod=5; input int DPeriod=3; input int Slowing=3; input ENUM_MA_METHOD MA_Method=MODE_SMA; Contact me immediately after the purchase to get the settings and a personal bonus!

Mean Reversal Heikin Ashi Indicator calculates special trade reversal points based on Heikin Ashi candlesticks patterns. This indicator can be used on all symbols, even in Forex or B3 Brazillian Markets. You can configure just the position of each arrow. Then, after include the indicator on the graphic, pay attention on each arrow that indicates a long or short trade.
Multi-Timeframe Moving Average Indicator Provides you a simple edge. How? Let me explain.. Have you ever tried using Moving Average Strategy to trade but you find those entries too late? Have you ever tried to trade with moving averages on 1 Timeframe chart (example 4h) and when i try to lower the timeframe, moving averages change position? If you answered Yes to Both questions , This indicator is the solution for you! 1- You can visualize lower timeframes moving averages on higher timeframes ex
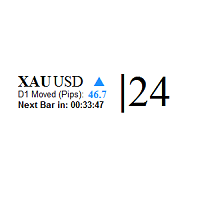
This indicator shows: The market spread Current candle time left to be closed and the pips of market movement from the beginning of the day play sound when candle is going to be closed This is an extremely useful tool for watching the spread rise and fall, allowing you to enter the market at just the right time. This indicator will help you stay out of the market when the spread begins to rise and help you get into the market as the spread begins to fall again.
very useful for day trading and
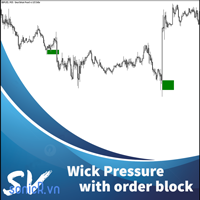
Multiple Wicks forming at OverSold & OverBought levels create Buying and Selling Pressure. This indicator tries to capture the essence of the buy and sell pressure created by those wicks. Wick pressure shows that the trend is Exhausted. Order block should display when buying or selling pressure wick. When price go inside buy order block and up to outside order block, trader should consider a buy order. If price go inside buy order block and down to outside order block, trader should consider a s
Quantile Moving Average Channels "KNOW WHERE OTHER MARKET PARTICIPANTS ACT"
General See where zones of interest exist with quantile MA channels. It plots three lines on the main chart: two outer lines and a mid line.
Most of all commonly used moving averages are between the upper and the lower band, if the input parameters are chosen properly.
This means that if the channel is relatively small, other market participants that rely on moving averages may act if the price action is near the mi

ICT, SMC, SMART MONEY CONCEPTS, SMART MONEY, Smart Money Concept, Support and Resistance, Trend Analysis, Price Action, Market Structure, Order Blocks, BOS/CHoCH, Breaker Blocks , Momentum Shift, Supply&Demand Zone/Order Blocks , Strong Imbalance, HH/LL/HL/LH, Fair Value Gap, FVG, Premium & Discount Zones, Fibonacci Retracement, OTE, Buy Side Liquidity, Sell Side Liquidity, BSL/SSL Taken, Equal Highs & Lows, MTF Dashboard, Multiple Time Frame, BigBar, HTF OB, HTF Market Structure

** All Symbols x All Timeframes scan just by pressing scanner button ** *** Contact me after the purchase to send you instructions and add you in "Trend Reversal group" for sharing or seeing experiences with other users. Introduction: Trendlines are the most famous technical analysis in trading . Trendlines continually form on the charts of markets across all the different timeframes providing huge opportunities for traders to jump in and profit on the action. In the other hand, The tre

Versão MT4 | Indicador Trend Monitor VZ | Indicador Owl Smart Levels | Estratégia Owl Smart Levels | FAQ A teoria das ondas de Elliott é uma interpretação dos processos nos mercados financeiros que se baseia em um modelo visual de ondas em gráficos de preços. O indicador Valable ZigZag exibe a estrutura de onda do mercado, na qual você pode confiar para tomar decisões comerciais. O indicador Valable ZigZag é mais estável e muitas vezes não muda sua direção como o indicador ZigZag clá
FREE

Versão MT4 | FAQ O Indicador Owl Smart Levels é um sistema de negociação completo dentro de um indicador que inclui ferramentas populares de análise de mercado, como fractais avançados de Bill Williams , Valable ZigZag que constrói a estrutura de onda correta do mercado e níveis de Fibonacci que marcam os níveis exatos de entrada no mercado e lugares para obter lucros. Descrição detalhada da estratégia Instruções para trabalhar com o indicador Consultor de negociação Owl Helper Chat privado d

MT4 version | Indicador Owl Smart Levels | Estratégia Owl Smart Levels | FAQ
O Indicador Fractals é um dos elementos da estratégia de negociação do autor de Bill Williams . É utilizado para buscar pontos de reversão de preços no gráfico de preços e, consequentemente, níveis de suporte e resistência. O Indicador Full Fractals é um Fractals aprimorado que está disponível no kit de ferramentas de quase todos os terminais de negociação. A única diferença é que para construir u
FREE

Bem-vindo ao RSI Colored Candles, um indicador inovador projetado para aprimorar sua experiência de negociação integrando o Índice de Força Relativa (RSI) diretamente em seu gráfico de preços! Ao contrário dos indicadores RSI tradicionais, o RSI Colored Candles utiliza um esquema de quatro cores para representar os níveis de RSI diretamente em suas velas, fornecendo insights valiosos com apenas um olhar! Características e Benefícios: Design Economizador de Espaço: Adeus às janelas de indicadores
FREE

O indicador KPL Swing é um sistema de negociação mecânica seguindo a tendência simples que automatiza a entrada e saída. O sistema funciona com uma perda stop dura e uma perda stop com rastreamento para sair com negociações rentáveis. Não há objetivos dados, já que ninguém sabe até onde (ou baixo) o preço pode se mover. Uma perda stop com rastreamento trava os ganhos e remove as emoções da negociação. Convertido a partir do indicador Amibroker com modificações. Perfeito se combinar com KPL Char
FREE

Este indicador pode identificar mais de 60 padrões de candles no gráfico, incluindo suas variantes de alta e baixa. Basta escolher nas configurações o padrão que deseja.
Padrões Disponíveis 2 Crows Gravestone Doji On Neck 3 Black Crows Hammer Piercing 3 Inside Hanging Man Rick Shawman 3 Line Strike Harami Rising and Falling Three Method 3 Outside Harami Cross Separating Lines 3 Stars in South High Wave Shooting Star 3 White Soldiers Hikkake Short Line Abandoned Baby Hikkake Modified Spinning T

UR Gama (alimentado por cálculos semelhantes encontrados em sistemas de aprendizado de máquina)
O UR Gamma é uma ferramenta de análise financeira de ponta que oferece uma visão nova e aprimorada do clássico indicador WaveTrend. Ao incorporar técnicas avançadas de Processamento de Sinal Digital, o UR Gamma aborda algumas das limitações dos algoritmos WaveTrend tradicionais e fornece uma abordagem mais precisa, robusta e dinâmica para identificar e medir tendências na ação do preço.
Vantagens
Bandas UR (com uma fórmula usada em sistemas de aprendizado de máquina)
UR Bands é um indicador derivado por meio de uma fórmula que incorpora a volatilidade do mercado e é semelhante, em princípio, aos usados em sistemas de aprendizado de máquina. Essa representação matemática das condições de mercado oferece uma análise precisa das tendências e dinâmicas dos preços, levando em consideração a volatilidade inerente aos mercados financeiros. Ao incorporar a volatilidade como uma variável, o in

Pivot Classic, Woodie, Camarilla, Fibonacci and Demark Floor/Classic Pontos pivô, ou simplesmente pivôs, são úteis para identificar possíveis níveis de suporte/resistência, faixas de negociação, reversões de tendência e sentimento do mercado, examinando os valores alto, baixo e de fechamento de um ativo. Os Pontos Pivot Floor/Classic podem ser calculados da seguinte forma. Pivot Point (P) = (High + Low + Close)/3 S1 = P * 2 - High S2 = P - (High - Low) S3 = Low – 2*(High - P) R1 = P * 2 - Low R2
FREE

FRB Candle de Agressão Oposta
Este indicador mostra quando o candle possui direção oposta ao saldo de agressão do mesmo período. Não serve para ser usado no mercado Forex. Uso apenas de mercados que possuem informação de volume e agressão, como a B3 (Brasil)
Configurações Cor - Definir a cor que será mostrada do candle ( Cor 1 - Quando o candle for positivo e o saldo de agressão negativo / Cor 2 - Quando o candle for negativo e o saldo da agressão positivo )
FREE

FRB Candle Time
Indicador que mostra o tempo que falta para o próximo candle Você pode editar a cor e o tamanho da fonte. Para movimentar o tempo, basta clicar em cima e mover o mouse para onde você quiser deixá-lo. Após posicionar o tempo onde você deseja, clique novamente ou aperte "ESC" e o horário ficará onde você deixou.
Configuração Cor da Fonte Tamanho da Fonte Cor de Fundo
FREE

FRB Time Indicador que mostra o Horário do servidor de operação. Você pode editar a cor e o tamanho da fonte do horário.
Configuração Cor da Fonte Tamanho da Fonte Cor de Fundo
Para movimentar o Horário, basta clicar em cima e mover o mouse para onde você quiser deixá-lo. Após posicionar o Horário onde você deseja, clique novamente ou aperte "ESC" e o horário ficará onde você deixou.
FREE

After working during many months, with the help of Neural Networks, we have perfected the ultimate tool you are going to need for identifying key price levels (Supports and Resistances) and Supply and Demand zones. Perfectly suitable to trigger your trades, set up your future actions, decide your Take Profit and Stop Loss levels, and confirm the market direction. Price will always move between those levels, bouncing or breaking; from one zone to another, all the remaining movements are just mark
Imagine a way to automatically and clearly recognize the direction of the current market. Uptrend or Downtrend?
Forget about moving averages, there is a simple way to determine that. Welcome to the world of statistics. Welcome to the simple yet powerful world of Linear Regression. Just a complicated name for a genius and simple measurement.
Calibrating this indicator is pretty clear and obvious since the degree of freedom is total and deep.
Once calibrated to your desired Symbol/Asset,

Display your Local Time on your charts
Now available for MT5 with new features! Display your local time instead of (or along with) MT5 server time.
Display crosshair to highlight current candle time.
Automatically adjusts based on chart zoom (zooming in or out).
Displays on every timeframe (M1 - Month, including all MT5 timeframes), and auto-adjusts as chart timeframe is changed.
Handles special ½ hour time zones , such as India.
Renders fast (no lag) as you scroll charts.

Ichimoku technic . is a candlestick indicator, which captures bullish and bearish trends according to its sail color! where there are breaks, it also captures with candle colors, The 2 most important colors to hunt trends are red and aqua, where clearly by color it tells you when it goes up or down, Serve for all seasons! It works for the forex markets and synthetic indices, also crypto! World Investor. Good profit!

Supply and demand Professional. It is an indicator of supply and demand clearly, It indicates with colors where it marks the different areas of supply and demand, trading volume. support zone low , support zone high , resistance zone low , resistance zone high works for all seasons works for forex markets and synthetic indices! It works for scalping and longs! World Investor Good profit!

Parabolic Professional. is a parabolic sar indicator, programmed better to better catch the entries, where it throws red dots, gives upload input, where it puts gray dots, gives point of sale, perfect for making lengths of H4, and H1 It is also used for scalping, It works at any time. suitable for forex and synthetic indices, also crypto, World Investor , Good profit

Step ma, It has a band indicator where it gives you inputs, when the candle leaves the band, it's called step ma, It is used in all temporalities, ideal for scalping, long can also be done It has 2 colors of bands on the lower side and red on the upper side and the rebound line is blue. works for forex markets works for synthetic index markets ! for all pairs! World Investor, Good Profit!

ATR Professional. is an indicator similar to the bollinger, but this back is more advanced to scalp and long in h4 or h1, It has its bands, the strategy is that it marks entry when the candle leaves the band, or does it bounce on the upper roof or lower floor, works for all seasons! works for forex markets and synthetic indices also crypto! Good profit! World Investor.

ICT Core Content Concepts turned into indicator plus all previous tools known from the Position Smart Indicator . This makes it the Full PSI Private Version ( read more ) restricted up to now but available only after the Mentorship Core Content was made public on YouTube. You will find many price action study tools like: Central Bank Dealing Range - CBDR Asian Range FLOUT Profiles and SD targets on the CBRD, Asian Range and Flout both on the wicks and on the bodies Seek & Destroy Prof

Macd Sar! is a gcd indicator combined with the parabolic sar indicator! It has the strategy of breaks, where the gray line crosses above the pink lines, and exchange of parabolic sar points, it is marking purchase for sale is vice versa, works for all seasons! It is good for scalping, and to do lengths suitable for forex markets and synthetic indices! Good profit! World Investor.

Super Treend! It is an indicator whose strategy is based on line breaks giving a signal for sale or purchase, How well it looks when you are marking a sale, it puts a red dot on you, when you make a purchase, it marks a green dot, Accompanying with blue lines that sets the trend for sale, and the aqua line that sets the shopping trend for you, works for all seasons works for forex markets and synthetic indices! Good profit! World Investor.

Range Move It is an indicator that clearly shows you the supports, resistances and trend lines. to each candle that is running, said changing, the lines are changing accommodating the trend to have a better entrance! the indicator is for forex markets for synthetic index markets ! and for crypto too! It is used in all temporalities! Good profit! World Investor.

Channel Oscillator It is an oscillator indicator, which goes from strategy marking the high points, and the low points where it is accompanied by a band that marks those points, where it marks you with a signal of a block in the upper band when it is for sale, and it marks you with a block in the bearish band when it is bought. works for forex markets and synthetic indices It also works for crypto markets ideal for scalping, good profit World Investor.

The Double Stochastic RSI Indicator is a momentum indicator which is based on the Stochastic Oscillator and the Relative Strength Index (RSI). It is used help traders identify overbought and oversold markets as well as its potential reversal signals. This indicator is an oscillator type of technical indicator which plots a line that oscillates within the range of zero to 100. It also has markers at levels 20 and 80 represented by a dashed line. The area below 20 represents the oversold area, wh

Macd diverge! It is a macd indicator where it goes with the divergence indicator and arrows that mark the sale and purchase of the pair! It is very easy to use and at first glance you can see that you don't have to do a lot of analysis since the divergence marks the sail too! It can be used in all seasons! It is used for scalping! works for forex markets for crypto and synthetic index markets too! Good profit! World Investor.
O Mercado MetaTrader é um site simples e prático, onde os desenvolvedores podem vender seus aplicativos de negociação.
Nós iremos ajudá-lo a postar e explicar como descrever o seu produto para o mercado. Todos os aplicativos no Mercado são protegidos por criptografia e somente podem ser executados no computador de um comprador. Cópia ilegal é impossível.
Você está perdendo oportunidades de negociação:
- Aplicativos de negociação gratuitos
- 8 000+ sinais para cópia
- Notícias econômicas para análise dos mercados financeiros
Registro
Login
Se você não tem uma conta, por favor registre-se
Para login e uso do site MQL5.com, você deve ativar o uso de cookies.
Ative esta opção no seu navegador, caso contrário você não poderá fazer login.