Conheça o Mercado MQL5 no YouTube, assista aos vídeos tutoriais
Como comprar um robô de negociação ou indicador?
Execute seu EA na
hospedagem virtual
hospedagem virtual
Teste indicadores/robôs de negociação antes de comprá-los
Quer ganhar dinheiro no Mercado?
Como apresentar um produto para o consumidor final?
Novos Indicadores Técnicos para MetaTrader 5 - 34

Accelerator Oscillator by Bill Williams with the ability to fine-tune and replace the averaging algorithms of the indicator, which significantly expands the possibilities of using this oscillator in algorithmic trading and brings it closer in its properties to such an indicator as MACD.
To reduce price noise, the final indicator is processed with an additional Smooth averaging. The indicator has the ability to give alerts, send mail messages and push signals when the direction of movement
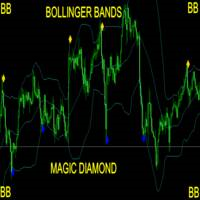
Take Your Trading Experience To the Next Level ! and get the Magic Bollinger Bands Diamond Indicator MagicBB Diamond Indicator is MT5 Indicator which can suggest signals for you while on MT5. The indicator is created with Non Lag Bollinger Bands strategy for the best entries. This is a system to target 10 to 20 pips per trade. The indicator will give alerts on the pair where signal was originated including timeframe. If signal sent, you then enter your trade and set the recommended pips targ

Trend driver bars is the manual trading system, which defines current trend continue or it's pull-back/reverse. "Driver" bars - are price action patterns that has powerfull affect on market, defining it's near future direction. Generally, driver bars represents trend "skeleton" and often anticipates new market impulse. System plots arrows when market shows 3 pattenrs in a row(most powerfull combo-pattern), and makes fast scalping of incomming movement. Loss positions closes by common profit. Lot

The indicator calculates the correlation coefficient of 2 instruments, shifts the chart of the 2nd instrument relative to the 1st and displays the charts of both instruments on the current chart. The maximum positive and negative deltas and the current delta as a percentage of the maximum are calculated. It is possible for signals to set a delta for entry and exit with displaying the direction of entry into trade for each instrument. The space between the charts is also filled with different col

The indicator calculates intraday levels based on the average daily price range, builds support and resistance levels that may be reversal.
Parameters Period ATR - period of the ATR indicator Shift time - time offset for the opening of the day Color opening of day - color of the opening line of the day Color 1AR, -1AS - line color 1AR, -1AS Color AR 1/2, AS -1/2 - line color AR 1/2, AS Color AR 1/4, AS -1/4 - line color AR 1/4, AS -1/4 Color AR 3/4, AS -3/4 - line color AR 3/4, AS -3/4 Colo
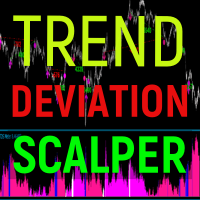
Trend deviation scalper - is the manual system to scalp choppy market places. Indicator defines bull/bear trend and it's force. Inside exact trend system also defines "weak" places, when trend is ready to reverse. So as a rule, system plots a sell arrow when bull trend becomes weak and possibly reverses to bear trend. For buy arrow is opposite : arrow is plotted on bear weak trend. Such arrangement allows you to get a favorable price and stand up market noise. Loss arrows are closing by common p
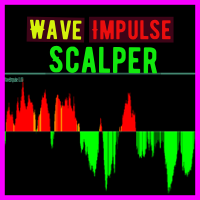
Wave Impulse OmegaScalper - is the manual system for scalping. In many cases Indicator "eats" almost all possible trend wave. System defines up price wave and down price wave. Inside the exact wave - system defines true trend movement and choppy market. Indicator plots signals while market is trending, powerfull and has quiet good volatility. This is complete system with enter and exit points. Main Indicator's Features Signals are not repaint,non-late or disappear(exept cases when system recalcu

Reverse side scalper is the manual trading system, that works on choppy(anti-trend) market. As a rule markets are on 80% choppy and only 20% is trend phase. System is based on custom step Moving and RSI and reverse pattern. System defines up movement, down movement, trend / choppy phases. Indicator plots Buy signal arrow when current direction is down and phase is trend, Sell signal arrow is plotted when currently is up movement and phase is trend. As a rule it allows to "catch" local maximum/mi

Welcome to Investment Castle products This product is exclusively available in the MQL5 market and is not available and will not be available anywehere else. The Combined indicator is a multi-time frame indicator and it is built using 3 indicators: Bands indicator which draws the support and resistance key levels using up to 5 different time frames Patterns indicator which draws the chart patterns using up to 6 different time frames Spots indicator which shows the common candlestick patterns Yo
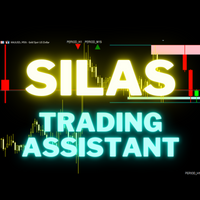
Silas is a trading assistant for multi-timeframes traders. It show on the screen, in a very clear way, all the informations needed to suits to your trading. It show : - Supply and demand zone from 2 timeframes of your choice - Setups based of market structure from 2 timeframes of your choice - Daily current high and low points - The last 2 closed candles and the current candle from an higher time frame on the right of the graph. - Actual daily candle on the left Everything is customisable !

В основу алгоритма этого осциллятора положен анализ веера сигнальных линий технического индикатора RSI . Алгоритм вычисления сигнальных линий выглядит следующим образом. В качестве исходных данных имеем входные параметры индикатора: StartLength - минимальное стартовое значение первой сигнальной линии; Step - шаг изменения периода; StepsTotal - количество изменений периода. Любое значение периода из множества сигнальных линий вычисляется по формуле арифметической прогрессии: SignalPeriod(Number)

** All Symbols x All Time frames scan just by pressing scanner button ** *** Contact me after purchase to send you instructions and add you in "Divergence group" for sharing or seeing experiences with other users. Introduction MACD divergence is a main technique used to determine trend reversing when it’s time to sell or buy because prices are likely to drop or pick in the charts. The MACD Divergence indicator can help you locate the top and bottom of the market. This indicator finds Regular div
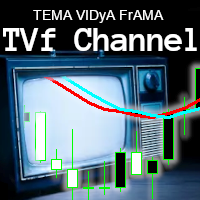
I really like this indicator. But I made it, so of course I would.. NOW FREE. But please consider supporting me by buying my 2 for sale indicators. You can multiply the weight of each indicator used to give more emphasis on it's value when averaging between the 3. Boost fast TEMA and it can move the indicator faster. Boost slow FrAMA and watch it smooth out. I like to use them as open/close lines and set them up so they move quick, but have the FrAMA smooth it out more.
Check out my other ind

Индикатор iVeles_Perfect_Oscilator является опережающим и одним из самых лучших осциляторов на сегодняшний день, использует специализированный расчет текущих цен графика. Очень качественно и своевременно показывает смену направления, очень точный подход к уровням перекупленности и перепроданности, что позволяет своевременно принять решение по сделке. Работает качественно на любом ТФ и с любым инструментом. Параметры: Period - период расчетов Average - усреднение МА Method - применяемый мето

В основу алгоритма этого трендового индикатора положен анализ веера сигнальных линий универсального мувинга I . Алгоритм вычисления сигнальных линий выглядит следующим образом. В качестве исходных данных имеем входные параметры индикатора: StartLength - минимальное стартовое значение первой сигнальной линии; Step - шаг изменения периода; StepsTotal - количество изменений периода. Любое значение периода из множества сигнальных линий вычисляется по формуле арифметической прогрессии: SignalPeriod(

Top indicator for MT5 providing accurate signals to enter Trades.
This Indicator will provide pretty accurate trading signals and tell you when it's best to open a trade by giving alerts to buy or sell. Mainly was created to target Volatility Index on Deriv broker however, the Spot Detector Arrow Indicator can be applied to any financial assets(Forex, Crypto, Indices, Volatilities) on MT5 Brokers.
HOW TO BUY Wait for signal Alert to Buy will be sent to your MT5 Terminal Blue arrow facin

Inventory Retracement Trade it is designed based on one of the most popular tradingview indicator. This is mostly combined with other popurlar trend indicator to confirm the strength of the movement. Definition Inventory Retracement Trade is quickly becoming one of the most popular ways to identify where short-term counter trend institutional inventory has subsided and when it’s time to re-enter into a trade’s original trend direction.

Angle of Moving Averages This indicator is very simple yet powerful concept which constantly calculate the slope of the current bar moving average with respect to the N bar before moving average value. This no only give a good entry and exit signal but also it shows traders the strength of the signal. It shows positive green histogram when market is moving toward upward direction and red histograms for downtrend. When large histograms found means market has very strong trend. Inputs Available
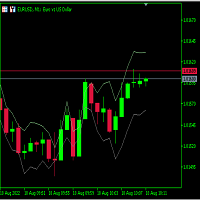
Just learning how to create an indicator from this tutorial .
its just a garbage text to fill the descriptions. Hello there. Hello there Hello there Hello there Hello there Hello there Hello there Hello there Hello there Hello there Hello there Hello there Hello there Hello there Hello there Hello there Hello there Hello there Hello there Hello there Hello there
FREE

The FX Stewards EA Signals Alert Financials Indicator works with every trading instrument(if used on synthetics, performance will not be optimum). Do not use on synthetics. Synthetics are not affected by fundamental analysis. The signals indicator assists with choosing which instrument to trade and the direction to take(follow the trend - the trend is your friend), making it easer for you to enter, re-enter or exit a trade with confidence(you're, however, still required to confirm entry before e

Wink IND is an indicator that tell you: -when MACD is saying buy or sell -when RSI is saying buy or sell -work on multi timeframes MT4 Version
by Wink IND: you don't need to have Knowledge about MACD or RSI don't need to check and compare MACD and RSI respectly don't need to check all of timeframes and compare the resaults don't lose time, save more time for your decisions in trading
Wink IND: multi timeframe indicator multi currency indicator show the positions by graphic shapes, arrows an

The indicator very accurately determines the levels of the possible end of the trend and profit fixing. The method of determining levels is based on the ideas of W.D.Gann, using an algorithm developed by his follower Kirill Borovsky. Extremely high reliability of reaching levels (according to K. Borovsky - 80-90%) Indispensable for any trading strategy – every trader needs to determine the exit point from the market! Precisely determines targets on any timeframes and any instruments (forex, met

Momentador UR
O UR Momenter calcula perfeitamente o momento do preço em correlação com o esgotamento do movimento do preço representado como um oscilador. Portanto, isso nos dá sinais realmente iniciais de possíveis reversões ou retrações. Esta fórmula foi descoberta em 2018 após o estouro da bolha do mercado.
Vantagens de usar o UR Momenter:
Sem parâmetros Você tem 2 linhas que descrevem o movimento do preço - Linha Branca que é o Momentum do preço em correlação com o desvio da média m

Uma das sequências numéricas é chamada de "Forest Fire Sequence". Foi reconhecida como uma das mais belas novas sequências. Sua principal característica é que essa sequência evita tendências lineares, mesmo as mais curtas. É esta propriedade que formou a base deste indicador. Ao analisar uma série temporal financeira, este indicador tenta rejeitar todas as opções de tendência possíveis. E somente se ele falhar, ele reconhece a presença de uma tendência e dá o sinal apropriado. Esta abordagem pe

Indicadores Quânticos rápidos baseados no modelo SSC inovador e rastreamento em tempo real buscam os níveis de suporte e resistência. É uma iniciativa inovadora negociada em todos os tipos de mercados. Fast Quantum Indicators is a innovate initiate SSC model Real time tracking pursuit trend , based on innovate SSC model and Real time tracking pursuit the breakouts of support and resistance levels. It's a innovate initiate traded on all types of markets. Fast Quantum AI Expert Tradi

Indicadores Quânticos rápidos baseados no modelo SSC inovador e rastreamento em tempo real buscam os níveis de suporte e resistência. É uma iniciativa inovadora negociada em todos os tipos de mercados. Fast Quantum Indicators is a innovate initiate SSC model Real time tracking pursuit trend , based on innovate SSC model and Real time tracking pursuit the breakouts of support and resistance levels. It's a innovate initiate traded on all types of markets. Fast Quantum AI Expert Tradin

UR Front-EndBack-End
UR FrontEndBackEnd é minha fórmula favorita para encontrar os níveis mais precisos de suporte e resistência. Eu também os dividi em diferentes categorias (linhas tracejadas, linhas sólidas e áreas) para marcar o quão fortes eles são. Tudo é armazenado em buffers para que sejam fáceis de acessar e implementar em outras ferramentas.
Acréscimo: A ferramenta pode necessitar de ser ajustada ao ativo sobre o qual é aplicada - os ativos diferem em termos de nr de dígitos no

O Weis Wave Chart para MT5 é um um indicador de Preço e Volume.
A leitura de Preço e Volume foi amplamente divulgada através de Richard Demille Wyckoff com base nas três leis criadas por ele: Oferta e Demanda, Causa e Efeito e Esforço x Resultado.
Em 1900 R.Wyckoff já utilizava o gráfico de Ondas em suas análises.
Muitos anos depois, por volta de 1990 , David Weis Automatizou o gráfico de ondas de R. Wyckoff e hoje nós trazemos a evolução do gráfico de ondas de David Weis.
Ele most

O Weis Wave Chart Forex para MT 5 é um um indicador de Preço e Volume.
A leitura de Preço e Volume foi amplamente divulgada através de Richard Demille Wyckoff com base nas três leis criadas por ele: Oferta e Demanda, Causa e Efeito e Esforço x Resultado.
Em 1900 R.Wyckoff já utilizava o gráfico de Ondas em suas análises.
Muitos anos depois, por volta de 1990 , David Weis Automatizou o gráfico de ondas de R. Wyckoff e hoje nós trazemos a evolução do gráfico de ondas de David Weis.
Ele mo

YOU CAN NOW DOWNLOAD FREE VERSIONS OF OUR PAID INDICATORS . IT'S OUR WAY OF GIVING BACK TO THE COMMUNITY ! >>> GO HERE TO DOWNLOAD
More About Advanced Currency Meter Every good forex system has the following basic components: Ability to recognize the trend direction. Ability to identify the strength of the trend and answer the basic question Is the market trending or is it in a range? Ability to identify safe entry points that will give a perfect risk to reward (RR) ratio on every position
FREE

Signal provider based on RSI Divergences
from a higher timeframe.
First 3 buffers export a signal.
Timeframe for which divergences are detected is optional, see
'RSI divergences timeframe' parameter.
The indicator uses different algorithms for divergences detection:
'Fast' algorithm is the simplest solution that works the fastest.
'Strict' algorithm filters out more noise but works slower than the previous one.
'Full' algorithm uses recursive functions and provides with lots of d
FREE
Simple RSI indicator.
User can choose TimeFrame for the RSI.
For example, you are using chart with M5 data
but want to see RSI from different fimeframe H4 drawn below the main chart window.
RSIhtf.ex5(iRSI.ex5 - another name) (h = higher, tf = timeframe) is designed specifically for this case.
Exports 1 buffer with indicator data.
The indicator is part of TS_DayTrader system.
FREE

iFrankenstein - an essential part of TS_DayTrader trading system( Frank.ex5 / FrankPro.ex5 / Frankenstein.ex5 ).
The indicator provides with 10 pattern-based signals.
For each of the 10 patterns there's a number of internal indicators and filters used:
Fractals
KeyLevels
RSI Divergences
BollingerBands
ATR
Technical Pocket
Pattern-specific volatility filters
The first 30 buffers of the indicator export a signal
that consists of TakeProfit, StopLoss, Price values, for each of the

This product generates signals at closing bars thanks to channel scaling. It visualizes these signals with an arrow. The color of the arrow indicates the direction of the trade. The default settings are valid for the H1 period. You can backtest for each period and product. The code content of the indicator has been applied in accordance with price movements as much as possible. For this reason, it detects trend beginnings and ends well.
Parameter descriptions:
PER: Indicates the number of b

Smart Market Scanner and Dashboard The trend is very important when trading a financial instrument. The trend can be identified by checking various of structures and indicators. Trend shifts can be identified by trendline breakouts and horizontal support/resistance levels. Scanner will scan the selected symbols and show you the direction/trend on selected timeframes. Algo is based on: Price Cycles, Fractals, Order Blocks, Hi-Lo
Advantages: Multi timeframe Multi instruments including Currencies
Indicator iPatterns.ex5 detects 8 different classes of volatility patterns.
DD, SD, RD, SSD are the so-called "bottoms".
DV, SV, RV, SSV are "peaks".
User can set up an Alert to be notified about a new pattern detected.
Parameters 'Pattern maximal height' and 'Pattern minimal height' work
as filters.
'iBB period' and 'iBB deviation' parameters regulate performance of
BollingerBands indicator - it provides one of the signals
forming already mentioned above 8 patterns.
iPatter

This tool is useful for indicating resistance and support levels It bases on zone in setting to identify top/bottom of candles and and draw rectangle according to those resistance/support level Beside user can edit the zone via dialog on specific timeframe and that value will be saved and loaded automatically. User can determine what strong resistance and support and make the order reasonably.
FREE

Gatotkaca Support Resistance Trendline Indicator is a simple indicator that detects support, resistance and trendlines. It will helps you find breakout momentum based on lines calculated by this indicator. This is conceptually based on fractals, but with customizable periods. Compatible for any timeframes. You can customize how this indicator work by setting up the period input.
FREE
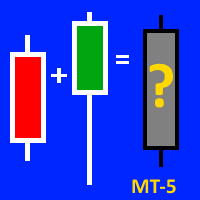
This indicator will be VERY USEFUL for anyone who works with candlestick patterns. This indicator is designed to display the average figure from two adjacent candles (current and previous). Accordingly, it shows IN CONTEXT the strength or weakness of bulls / bears (!). But please, don't forget about the classical basics of technical analysis (!). All indicators are just an auxiliary tool for reading a chart (!). A demo version on the example of mt-4 can be found here: https://www.mql5.com/ru/ma

RISK TO REWARD TOOL for MT5 with UI on chart: (creates similar RR boxes like on tradingview) -creates and deletes draggable boxes on chart, ANY SYMBOL, ANY TF. Menu buttons:
NEW BUY, NEW SELL, DELETE ALL, ( and minimize) -draggable target TP level
-draggable SL limit level
-text labels with pips SL TP, RR ratio-there is no limit of boxes
-but program remembers first 100 boxes after changing input. there is parameter "delete_on_init" so false = every created box stays as it is,

Nade com os grandes ou evite-os a todo custo. Com esse indicador, a escolha é sua! Indicador por coloração de barras, com respostas simples se os "grandes" estão negociando ou não. Saiba quando agir se o mercado está calmo ou agitado, de forma simples, pelo valor de retorno do indicador ou pela aparência das barras.
Indispensável indicador para a construção do seu robô ou para seu setup. Resultado do Indicador: 0 - 5. Participantes do mercado: 0 e 1 = Big Players! 2 e 3 = Dia normal. 4 e 5 = M

Three Triple Exponential Average oscillators merged into one. Fast period will pull on the slower period, and the slower will smooth out the faster and avoid early positions. You can use 2 fast and 1 slow, or Fibonacci range or 2 slow, 1 fast. NOW FREE. But please consider supporting me by buying my 2 for sale indicators.
You can use this as an entry indicator and exit indicator. Open when the tripleTRIX line crosses the zero line and close when it starts to reverse. When the peaks get bigger,

Book Map Order Flow shows the price and volume, processing the DOM. See the volume in a better way. See the support and resistance and the possibility of breakouts of them. Input up to 20 price levels to see where the volume is trading and what side. The indicator was made from an EA by denkir but it needed include files to work so I developed and indictor from this out of MQL5 how to cookbook article here: https://www.mql5.com/en/articles/1793 . It can be an easy and valuable tool for all.

Zigzag Indicator For RSI, To easily identify the highs and lows of the rsi signal. It is easier to observe divergent and convergent signals. Default setting: InpRsi =14 //Rsi Period InpDepth =12; // Depth InpDeviation =5; // Deviation InpBackstep =3; // Back Step
If you want open Exness account try this link : https://one.exness-track.com/a/teg5teg5 Dev buy taphu: Ha Van Tan - hatatrata - Trader's profile - MQL5 community Email: tan.ha@outlook.com
FREE

** All Symbols x All Timeframes scan just by pressing scanner button ** ***Contact me after purchase to send you instructions and add you in "123 scanner group" for sharing or seeing experiences with other users. After 17 years of experience in the markets and programming, Winner indicator is ready. I would like to share with you! Introduction The 123 Pattern Scanner indicator with a special enhanced algorithm is a very repetitive common pattern finder with a high success rate . Interestingly,

Momentum Reversal é uma ferramenta poderosa para detectar possíveis pontos de reversão e iniciar a correção, com base na análise da intensidade dos movimentos de preços e nas formações de barras.
_________________________________
Como usar os sinais indicadores:
O indicador forma um sinal após o aparecimento de uma nova barra de preços. Recomenda-se usar o sinal gerado após o preço romper o ponto crítico na direção especificada. O indicador não redesenha seus sinais.
___________________
FREE

Acceleration Points-uma poderosa ferramenta de detecção de pontos críticos de movimento de preços, com base na idéia de calcular a aceleração das flutuações de preços.
_________________________________
Como usar os sinais indicadores:
O indicador forma um sinal após o aparecimento de uma nova barra de preços. Recomenda-se usar o sinal gerado após o preço romper o ponto crítico na direção especificada. O indicador não redesenha seus sinais.
_________________________________
Os parâmet
FREE

Correction Breakthrough - uma ferramenta poderosa para detectar possíveis pontos de ruptura de um corredor correcional ou comercial, com base na análise de formações de preços e inércia dos movimentos de preços.
_________________________________
Como usar os sinais indicadores:
O indicador forma um sinal durante a barra de preços atual. Recomenda-se usar o sinal gerado após o fechamento da barra de sinal acima/abaixo da seta de sinal. O indicador não redesenha seus sinais.
____________
FREE

A Market Palette é uma poderosa ferramenta de Filtragem de decisões de negociação baseada na inércia e na aceleração das flutuações de preços.
_________________________________
Como usar os sinais indicadores:
O indicador forma sinais de histograma, três cores diferentes. No esquema de cores padrão, quando aparecem colunas azuis, recomenda - se manter apenas posições longas, quando aparecem colunas vermelhas - apenas curtas, quando aparecem colunas cinzentas-abster-se de ações de negociaç
FREE

Points of Inertia é uma poderosa ferramenta para detectar pontos críticos de movimento de preços, com base na idéia de calcular a inércia das flutuações de preços.
_________________________________
Como usar os sinais indicadores:
O indicador forma um sinal após o aparecimento de uma nova barra de preços. Recomenda-se usar o sinal gerado após o preço romper o ponto crítico na direção especificada. O indicador não redesenha seus sinais.
_________________________________
Os parâmetros
FREE

** All Symbols x All Timeframes scan just by pressing scanner button ** ***Contact me after purchase to send you instructions and add you in "RSI scanner group" for sharing or seeing experiences with other users. Introduction RSI divergence is a main technique used to determine trend reversing when it’s time to sell or buy because prices are likely to drop or pick in the charts. The RSI Divergence indicator can help you locate the top and bottom of the market. This indicator finds Regular diver

M & W Pattern Pro is an advanced scanner for M and W patters , it uses extra filters to ensure scanned patterns are profitable.
The indicator can be used with all symbols and time frames.
The indicator is a non repaint indicator with accurate statistics calculations.
To use , simply scan the most profitable pair using the statistics dashboard accuracy , then enter trades on signal arrow and exit at the TP and SL levels.
STATISTICS : Accuracy 1 : This is the percentage of the times price hit

Market Profile 3 MetaTrader 5 indicator version 4.70— is a classic Market Profile implementation that can show the price density over time, outlining the most important price levels, value area, and control value of a given trading session. This indicator can be attached to timeframes between M1 and D1 and will show the Market Profile for daily, weekly, monthly, or even intraday sessions. Lower timeframes offer higher precision. Higher timeframes are recommended for better visibility. It is als
FREE

Of all the tasks that a trader faces when entering a market, the main task is to determine the direction of the trend. The Artificial Power indicator will help you with this task. Whatever goal the trader sets for himself, the tool to achieve it will be mainly trend indicators.
The Artificial Power indicator without delay and redrawing is used by traders in trend strategies in trading on financial markets (Forex, CFD, binary options). This indicator is designed to detect trends in price movem

Flag Pattern pro is a Price Action (PA) analytical tool that scans the continuation patterns known as "Flag and Pennant Patterns" .
Flag and Pennant patterns are continuation patterns characterized by a move in a previous trend direction after a shallow retracement usually below 50% of the original move . Deep retracements can however be sometimes found at the 61.8 % levels. The original move is know as the flag pole and the retracement is called the flag.
Indicator Fun

This indicator scans the 1-3 Trendline pattern . The indicator is a 100 % non repaint low risk breakout system . The patterns are formed around swing high and swing lows which make them a low risk pattern with high reward.
PATTERN BACKGROUND The 1-3 Trendline Breakout pattern is formed by four(4) points which are composed of three (3) primary points and the pattern neck. A trendline is always formed by the point 1 and the neck of the pattern . When price breaks out of the trendline formed ,
TRACKINGLEVELS (SUPPORTS AND RESISTANCES)
TrackingLevels is a useful indicator that saves considerable time when a trader starts analyzing a chart. This indicator draw on the chart all the resistances and supports that the market is creating. The resistance and support levels are very important, this levels define areas where there can be a considerable accumulation of sell or buy orders. These are a key areas that every trader must know and keep in mind all the time. This indicator helps the

The currency strength momentum has a lot of similarities with currency strength meter presented in the previous page, but the difference are much more pronounced. You can try putting both in the same chart and see the difference in results. Currency strength momentum measures strength of a currency based on (you guess it) it's momentum relative to other currencies, while currency strength meter measures the strength of a currency based on pips it has moved in a certain direction.
FREE

Balance Weighted Moving Hedge System- is the trend following manual system for forex/crypto market. Indicator represents custom balance-weighted moving average indicator. The main advantagies : very stable moving with really early signals, defines current trend power, ignores market noise. The more width of indicator line - the more expressive trend is. On the other hand thin moving line shows unstable / choppy market. Indicator can be used as single b alance weighted moving or with hedge strate
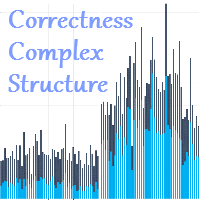
The Correctness Complex Structure indicator displays the complex structure of the bar, taking into account tick volumes in digital terms. How to interpret the information provided by the indicator. It's very simple, it's enough to analyze the chart. We will explain the work using an example, take the EURUSD instrument on the D1 timeframe, install this indicator and analyze the information provided by the indicator. The indicator works in the bottom of the chart and gives the result in the form
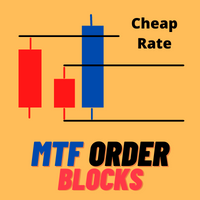
30% OFF ONLY 10 COPIES HURRY UP! 8 LEFT COPIES Very precise patterns to detect High Accurate Order Blocks: It Draw zone after market Structure Breakout with a high Accuracy, institutional orders with the potential to change the price’s direction and keep moving towards it, have been placed. Features Auto Order Blocks Draw MTF Order Blocks Double Signal One Alert Signal Second Long Wick Rejection Signal Market Structure BOS LINE How to show MTF order Block Go on indicator setting at the en

Hello;
This indicator provides input and output signals of real volume levels with some mathematical calculations. It is simple and safe to use. As a result of the intersection of real volume levels with averages, it creates buy and count signals.
Indicator parameter descriptions:
A-PERIOD: Indicates the number of bars to be calculated.
B-GAMMA: A fixed Fibonacci trend average of 0.618 is used.
Use C-VOLUME TYPE:Tick volume as a constant.
D-HIGH LEVEL 2: Represents the level of the
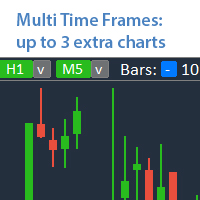
Analyze up to 3 additional charts of other timeframes , without switching the main chart. My #1 Utility : includes 65+ functions | Contact me if you have any questions The indicator opens in a separate window: The window can be moved to any place on the chart (using the [<M>] button). The window can also be minimized to save space ( [ <^>] button) In the window that appears, you can configure: The period of the 1st chart (left);
The period of the 2nd chart (center); The peri

В основе индикатора EasyBands лежит тот же принцип, что и при построении Bollinger Band. Однако, данная модификация индикатора использует вместо стандартного отклонения средний торговый диапазон (Average True Range). Соответственно, с данныи индикатором абсолютно аналогично можно использовать все стратегии, которые применяются с Bollinger Band. В данной версии индикатора используется двенадцать уровней и средняя линия (белый цвет). Индикация тренда выполнена в виде окраски свечей в зависимости
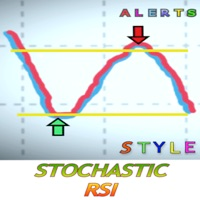
O que é o RSI estocástico?
O RSI Stochastic (StochRSI) é um indicador utilizado na análise técnica que varia entre zero e um (ou zero e 100 em algumas plataformas gráficas) e é criado através da aplicação da fórmula do oscilador Stochastic a um conjunto de valores de índice de força relativa (RSI) em vez de a dados de preços padrão. Esta versão inclui alertas para não perder oportunidades realmente boas. Define-se o parâmetro quando se pretende receber uma ordem de compra de sinal ou ordem de

Este é um indicador de tendência. O indicador reflete milhares de mudanças nos preços de mercado usando uma linha real vermelha e verde. A mudança na cor da linha real indica que o mercado mudou e é altamente provável que haja uma reversão! A linha verde indica que o preço de mercado está em um período de alta. A linha vermelha indica que o preço de mercado está em um período de baixa.

本指标 基于 Zigzag 基础上... 增加了: 1.增加了箭头指示,使图表更鲜明 2.增加了价格显示,使大家更清楚的看清价格. 3.增加了报警等设置,可以支持邮件发送 原指标特性: 1.基本的波段指标构型. 2.最近的2个ZIGZAG点不具有稳定性,随着行情而改变,(就是网友所说的未来函数) 3.原指标适合分析历史拐点,波段特性,对于价格波动有一定的指导性.
Zigzag的使用方法一 丈量一段行情的起点和终点 (1)用ZigZag标注的折点作为起点和终点之后,行情的走势方向就被确立了(空头趋势); (2)根据道氏理论的逻辑,行情会按照波峰浪谷的锯齿形运行,行情确立之后会走回撤行情,回撤的过程中ZigZag会再次形成折点,就是回撤点; (3)在回撤点选择机会进场,等待行情再次启动,止损可以放到回撤的高点。 一套交易系统基本的框架就建立起来了。 Zigzag的使用方法二 作为画趋势线的连接点 趋势线是很常见的技术指标,在技术分析中被广泛地使用。 但一直以来趋势线在实战中都存在一个BUG,那就是难以保证划线的一致性。 在图表上有很多的高低点,到底该连接哪一个呢?不同的书上画趋势线的方
FREE

Gann 9+ Indicator Introduction The "Gann Matrix Chart" is the most simple and clear technical analysis in Gann theory, which is the calculation tool that Gann has always been committed to using. It is the essence of Gann's whole life. The Gann 9+ indicator uses the matrix chart to find the future high or low points of stocks or futures. Indicator Input: The base and step size can be set as 1 by default; When the multiple is -1, the multiple will be automatically obtained, or it can be filled in

Este é um indicador de agressão comprador e vendedor que analisa o formato de cada vela e projeta esses dados em forma de histograma.
Há 4 histogramas em um só. Na parte frontal temos dois: Superior - força compradora Inferior - força vendedor Na parte de trás temos também dois histogramas, ambos da mesma cor. Eles medem a força conjunta dos compradores e vendedores. Esses histogramas podem ser desativados nos Parâmetros de Entrada. É possível também ter o volume real ou de tick para fazer essa
FREE

Presentation
Another indicator that makes scalping on tick charts easier, it displays an Heiken Ashi graph in Ticks.
It allows to detect entry points and trend reversals. Recommended number of ticks in a candle : 5, 13 or 21.
Parameters Ticks in candle: Number of ticks in a candle (default 5), Displays Trend arrows : displays a trend arrow based on EMA8 and EMA20 crossing, Displays MM50, Displays MM100, Max Candle (CPU): number of candles max to manage, low value will save ressources of
FREE
Saiba como comprar um robô de negociação na AppStore do MetaTrader, a loja de aplicativos para a plataforma MetaTrader.
O Sistema de Pagamento MQL5.community permite transações através WebMoney, PayPay, ePayments e sistemas de pagamento populares. Nós recomendamos que você teste o robô de negociação antes de comprá-lo para uma melhor experiência como cliente.
Você está perdendo oportunidades de negociação:
- Aplicativos de negociação gratuitos
- 8 000+ sinais para cópia
- Notícias econômicas para análise dos mercados financeiros
Registro
Login
Se você não tem uma conta, por favor registre-se
Para login e uso do site MQL5.com, você deve ativar o uso de cookies.
Ative esta opção no seu navegador, caso contrário você não poderá fazer login.