Conjunto de ferramentas para marcação manual de gráficos e negociação (Parte II). Fazendo a marcação

Introdução
No artigo anterior decidi criar uma ferramenta conveniente para mim mesmo que permitia desenhar linhas retas rapidamente em gráficos usando atalhos de teclado. Há também um vídeo mostrando como funciona a solução pronta.
Na implementação atual não há GUI (embora esteja planejado para o futuro). O programa simplesmente desenha linhas usando os atalhos de teclado e também acelera o acesso a ações como alterar o "nível" atual do gráfico ("Z-index"), alternar entre timeframes e mudar de modo de desenho de linha reta (raio/segmento).
A posição do ponteiro do mouse determina onde é desenhado o objeto. Se o ponteiro estiver acima do preço, os extremos com base no High do candle são selecionados como pontos base. Se o ponteiro estiver abaixo do preço, serão usados os preços Low.
Objetos que a versão atual da biblioteca pode desenhar:
- Linhas retas simples ("sem fim") - linhas horizontais e verticais.
- Linhas de tendência normais (ao longo dos dois extremos mais próximos do mouse). Podemos personalizar se a linha é um raio ou apenas um segmento. Se a linha estiver na forma de um segmento, podemos definir o modo em que será uma extremidade no futuro. Neste caso, o tamanho da linha é igual à distância entre os extremos multiplicada por um certo coeficiente, que pode ser ajustado nos parâmetros EA.
- Níveis horizontais de um certo comprimento (não infinito). Podemos desenhar curtos e "alongados" - com uma determinada proporção relativamente curta.
- Linha vertical com marcas de nível.
- Leque de Fibonacci. Os parâmetros dos níveis podem ser ajustados, mas eu uso uma versão que modifiquei ligeiramente, e que foi mostrada uma vez no "Onix" por alguem com o apelido de Vadimcha. Nesse site chamam esse leque de VFan, e no meu código eu mantenho esse nome.
- Conjunto de Will Andrews consistindo em três objetos.
A estrutura do projeto é bastante simples. A biblioteca possui cinco arquivos relacionados: "GlobalVariables.mqh", "Graphics.mqh", "Mouse.mqh", "Shortcuts.mqh", "Utilites.mqh". Todos os arquivos estão localizados na pasta "Shortcuts" no diretório padrão "Include".
O arquivo principal é "Shortcuts.mqh", todos os outros arquivos são anexados a ele. Ele também cria uma instância da classe CShortcuts, o que torna mais fácil conectar a biblioteca ao seu EA principal.
No artigo anterior, me concentrei no arquivo auxiliar "Utilites.mqh", desta vez eu me focarei no arquivo "Graphics.mqh" que tem a lógica de desenho.
Arquivo de configurações globais
Na segunda versão da biblioteca, as opções de configurações são significativamente ampliadas, pois há mais objetos que podem ser influenciados. Código completo da versão atual:
//+------------------------------------------------------------------+
//|                                              GlobalVariables.mqh |
//|                        Copyright 2020, MetaQuotes Software Corp. |
//|                            https://www.mql5.com/en/articles/7908 |
//+------------------------------------------------------------------+
#property copyright "Copyright 2020, MetaQuotes Software Corp."
#property link      "https://www.mql5.com/en/articles/7908"
//+------------------------------------------------------------------+
//| File describing parameters available to the user                 |
//+------------------------------------------------------------------+
#define VERSION 2.0 // Not #property but a constant. A bit more convenient.
//+------------------------------------------------------------------+
//| Key settings                                                     |
//+------------------------------------------------------------------+
input string   Keys="=== Key settings ===";
input string   Up_Key="U";                          // Switch timeframe up
input string   Down_Key="D";                        // Switch timeframe down
input string   Trend_Line_Key="T";                  // Trend line
input string   Switch_Trend_Ray_Key="R";            // Indication of a trend line ray
input string   Z_Index_Key="Z";                     // Indication of the chart on top
input string   Vertical_With_Short_Levels_Key="V";  // Vertical segment
input string   Short_Level_Key="S";                 // Short level
input string   Long_Level_Key="L";                  // Extended level
input string   Simple_Horizontal_Line_Key="H";      // Simple horizontal line
input string   Simple_Vertical_Line_Key="I";        // Simple vertical line
input string   VFun_Key="F";                        // Fibonacci fan
input string   Pitchfork_Key="P";                   // Andrews' pitchfork

//+------------------------------------------------------------------+
//| Color setting                                                    |
//+------------------------------------------------------------------+
input string   Colors="=== Color Settings ===";
input color    VFan_Color=clrLightGray;            // Color of the fan lines
                                                   //   (and an additional
                                                   //    one for special cases)
//---
input color    Pitchfork_Main_Color = clrBlue;     // Andrews' pitchfork color
input color    Pitchfork_Shiff_Color = clrRed;     // Schiff pitchfork color
input color    Pitchfork_Reverce_Color = clrYellow;// "Reverse" pitchfork color

//+------------------------------------------------------------------+
//| Size settings                                                    |
//+------------------------------------------------------------------+
input string   Dimensions="=== Size settings ===";
input int      Short_Level_Length=12;     // Short level length (bar)
input int      Short_Level_Width=1;       // Line width for the short level
input int      Long_Level_Width=2;        // Line width for the long level
input int      Vertical_With_Short_Levels_Width=1; // Vertical line width with levels
input int      Short_Level_7_8_Width=1;   // Level 7/8 line width
input int      Short_Level_14_8_Width=1;  // Level 14/8 line width
input int      Simple_Vertical_Width=1;   // Simple vertical line width
input int      Simple_Horizontal_Width=1; // Simple horizontal line width
input int      Trend_Line_Width=2;        // Trend line width

//+------------------------------------------------------------------+
//| Display styles                                                   |
//+------------------------------------------------------------------+
input string   Styles="=== Display styles ===";
input ENUM_LINE_STYLE      Vertical_With_Short_Levels_Style=STYLE_SOLID; // Vertical Line style
                                                                         // with levels
input ENUM_LINE_STYLE      Short_Level_Style=STYLE_SOLID;      // Short Level style
input ENUM_LINE_STYLE      Long_Level_Style=STYLE_SOLID;       // Long level style
input ENUM_LINE_STYLE      Short_Level_7_8_Style=STYLE_SOLID;  // Level 7/8 style
input ENUM_LINE_STYLE      Short_Level_14_8_Style=STYLE_DOT;   // Level 14/8 style
input ENUM_LINE_STYLE      Simple_Vertical_Style=STYLE_DOT;    // Simple Vertical style
input ENUM_LINE_STYLE      Simple_Horizontal_Style=STYLE_DOT;  // Simple Horizontal style
input ENUM_LINE_STYLE      VFun_Levels_Style=STYLE_SOLID;      // Fan Style
input ENUM_LINE_STYLE      Trend_Line_Style=STYLE_SOLID;       // Trend line style
//---
input ENUM_LINE_STYLE      Pitchfork_Main_Style = STYLE_SOLID;    // Andrews' Pitchfork style
input ENUM_LINE_STYLE      Pitchfork_Shiff_Style = STYLE_SOLID;   // Shiff Pitchfork style
input ENUM_LINE_STYLE      Pitchfork_Reverce_Style = STYLE_SOLID; // Reverse Pitchfork style
//+------------------------------------------------------------------+
//| Pitchfork extrema parameters                                     |
//+------------------------------------------------------------------+
input string               Pitchforks="=== Pitchfork Extrema Parameters ===";
//---
input int                  Pitchfork_First_Point_Left_Bars=6;   // Pitchfork - 1st point, bars on the left
input int                  Pitchfork_First_Point_Right_Bars=6;  // Pitchfork - 1st point, bars on the left
//---
input int                  Pitchfork_Second_Point_Left_Bars=6;  // Pitchfork - 2nd point, bars on the left
input int                  Pitchfork_Second_Point_Right_Bars=6; // Pitchfork - 2nd point, bars on the right
//---
input int                  Pitchfork_Third_Point_Left_Bars=6;   // Pitchfork - 3rd point, bars on the left
input int                  Pitchfork_Third_Point_Right_Bars=2;  // Pitchfork - 3rd point, bars on the right
//+------------------------------------------------------------------+
//| Other parameters                                                 |
//+------------------------------------------------------------------+
input string               Others="=== Other Parameters ===";
input double               Vertical_Short_Level_Coefficient=0.825;  // Coefficient of vertical levels
input double               Long_Level_Multiplicator=2;              // Multiplier for the long level
input int                  Trend_Length_Coefficient=4;              // Coefficient for the trend line length
input bool                 Is_Trend_Ray=false;                      // Trend line - ray
input bool                 Is_Change_Timeframe_On_Create = true;    // Hide objects on higher timeframes?
                                                                    //   (true - hide, false - show)
input bool                 Is_Select_On_Create=true;                // Select upon creation
input bool                 Is_Different_Colors=true;                // Change colors for times

// Number of bars on the left and on the right
// for trend line and fan extreme points
input int                  Fractal_Size_Left=1;                     // Size of the left fractal
input int                  Fractal_Size_Right=1;                    // Size of the right fractal

input bool                 Pitchfork_Show_Main = true;     // Display Andrews' pitchfork
input bool                 Pitchfork_Show_Shiff = true;    // Display Shiff pitchfork
input bool                 Pitchfork_Show_Reverce = true;  // Display "Reverse" pitchfork
input bool                 Print_Warning_Messages=true;    // Display error messages
input string               VFun_Levels="-1.5,-0.618,-0.236,"+
                                       "  0,0.236,0.382,"+
                                       "  0.618,0.786,0.886,0.942";  // Fan levels
input string               Array_Delimiter=",";            // Array elements separator
//---

//+------------------------------------------------------------------+
//| Name prefixes of drawn shapes (can be change only in code,       |
//| not visible in EA parameters)                                    |
//+------------------------------------------------------------------+
//string   Prefixes="=== Prefixes ===";
//string   Vertical_With_Short_Levels_Prefix="Vertical_";  // Prefix for vertical lines with levels
//string   Short_Level_Prefix="Short_Level_";              // Prefix for short levels
//string   Long_Level_Prefix="Long_Level_";                // Prefix for long levels
//string   Simple_Horizontal_Prefix="Simple_H_";           // Prefix for simple horizontal lines
//string   Simple_Vertical_Prefix="Simple_V_";             // Prefix for simple vertical lines
//string   VFan_Prefix="VFan_";                            // Prefix for fan
//string   Trend_Line_Prefix="Trend_";                     // Prefix for trend lines
//string   Pitchfork_Prefix="Pitchfork_";                  // Prefix for pitchfork
string   allPrefixes[] =      // Prefixes for object names
  {
   "Trend_",            // 0 - Prefix for trend lines
   "Simple_H_",         // 1 - Prefix for simple horizontal lines
   "Simple_V_",         // 2 - Prefix for simple vertical lines
   "VFan_",             // 3 - Prefix for fan
   "Pitchfork_",        // 4 - Prefix for pitchfork
   "Vertical_",         // 5 - Prefix for vertical lines with levels
   "Short_Level_",      // 6 - Prefix for short levels
   "Long_Level_"        // 7 - Prefix for long levels
  };

//+------------------------------------------------------------------+
//| Colors for objects of one timeframe (can be changed only in code,|
//| not visible in EA parameters)                                    |
//+------------------------------------------------------------------+
// string TimeframeColors="=== Standard Colors for Timeframes  ===";
color mn1_color=clrCrimson;
color w1_color=clrDarkOrange;
color d1_color=clrGoldenrod;
color h4_color=clrLimeGreen;
color h1_color=clrLime;
color m30_color=clrDeepSkyBlue;
color m15_color=clrBlue;
color m5_color=clrViolet;
color m1_color=clrDarkViolet;
color common_color=clrGray;

//--- Auxiliary constant for displaying error messages
#define DEBUG_MESSAGE_PREFIX "=== ",__FUNCTION__," === "

//--- Constants for describing the main timeframes when drawing
//--- For compatibility with version 4, timeframes that do not exist
//---    in the toolbar are excluded.
#define PERIOD_LOWER_M5 OBJ_PERIOD_M1|OBJ_PERIOD_M5
#define PERIOD_LOWER_M15 PERIOD_LOWER_M5|OBJ_PERIOD_M15
#define PERIOD_LOWER_M30 PERIOD_LOWER_M15|OBJ_PERIOD_M30
#define PERIOD_LOWER_H1 PERIOD_LOWER_M30|OBJ_PERIOD_H1
#define PERIOD_LOWER_H4 PERIOD_LOWER_H1|OBJ_PERIOD_H4
#define PERIOD_LOWER_D1 PERIOD_LOWER_H4|OBJ_PERIOD_D1
#define PERIOD_LOWER_W1 PERIOD_LOWER_D1|OBJ_PERIOD_W1
//+------------------------------------------------------------------+
Nesta lista, são destacados em amarelo os recursos que não estavam disponíveis na versão anterior. Eles permitirão personalizar não apenas linhas retas, mas também outros objetos que aparecem na tela.
Coloquei os nomes dos prefixos dos objetos numa matriz para que seja mais conveniente usá-los posteriormente. Por exemplo, planejamos uma função para remover objetos complexos (digamos, verticais com níveis) - a matriz será mais conveniente de usar.
Agora que descobrimos as configurações, podemos começar a desenhar.
Desenho de "primitivas": vertical e horizontal
O primeiro objeto que desejamos criar é as linhas de nível e as de tempo (linhas horizontais e verticais infinitas). Na verdade, a biblioteca começou com elas.
Aqui está o código:
//+------------------------------------------------------------------+
//| Draws simple straight lines (vertical and horizontal) in the     |
//| position specified by mouse or parameters                        |
//| Parameters:                                                      |
//|   _object_type - object type. Can be OBJ_VLINE or OBJ_HLINE      |
//|   _time - time.  If not specified, mouse time is used            |
//|   _price - price. If not specified, price under index is used.   |
//+------------------------------------------------------------------+
void              CGraphics::DrawSimple(
   ENUM_OBJECT _object_type, // Object type
   datetime    _time=-1,     // Time
   double      _price=-1     // Price
)
  {
//---
   string Current_Object_Name;   // The name of the future object
   color Current_Object_Color=   // Color (depends on the "standard" color of the timeframe)
      CUtilites::GetTimeFrameColor(CUtilites::GetAllLowerTimeframes());
   datetime Current_Object_Time; // Starting point time
   double Current_Object_Price;  // Starting point price
   ENUM_LINE_STYLE Current_Object_Style=STYLE_DOT; // Line style
   int Current_Object_Width=1;   // Line width
   int window=0;                 // Subwindow number

//--- Set up line parameters depending on the type
   if(_object_type==OBJ_VLINE)   // For vertical lines
     {
      Current_Object_Name=       // Generate the name
         CUtilites::GetCurrentObjectName(
            Simple_Vertical_Prefix,
            _object_type
         );
      // style - according to global parameters
      Current_Object_Style=Simple_Vertical_Style;
      // width - according to global parameters
      Current_Object_Width=Simple_Vertical_Width;
     }
   else
      if(_object_type==OBJ_HLINE)// For horizontal lines
        {
         Current_Object_Name=    // Generate the name
            CUtilites::GetCurrentObjectName(
               Simple_Horizontal_Prefix,
               _object_type
            );
         // style - according to global parameters
         Current_Object_Style=Simple_Horizontal_Style;
         // width - according to global parameters
         Current_Object_Width=Simple_Horizontal_Width;
        }
      else  // This function only draws horizontal and vertical lines.
        {
         // If something else is passed in parameters...
         if(Print_Warning_Messages)
           {
            // ...report an error...
            Print(DEBUG_MESSAGE_PREFIX,"Error, wrong object type");
           }
         // ...and exit.
         return;
        }

//--- If coordinates are not specified in the parameters, use the coordinates of the mouse
   Current_Object_Price = _price==-1 ? CMouse::Price() : _price;
   Current_Object_Time = _time==-1 ? CMouse::Time() : _time;

//--- Create the object
   ObjectCreate(
      0,
      Current_Object_Name,
      _object_type,
      0,
      Current_Object_Time,
      Current_Object_Price
   );

//--- Set display parameters for the created object
   CurrentObjectDecorate(
      Current_Object_Name,
      Current_Object_Color,
      Current_Object_Width,
      Current_Object_Style
   );

//--- Redraw the chart and complete
   ChartRedraw(0);
  }
As operações são triviais. Geramos um nome, pegamos as configurações das variáveis input descritas no arquivo "GlobalVariables.mqh", obtemos as coordenadas do ponto de partida do objeto (seja a partir dos parâmetros da função, ou simplesmente como as coordenadas do mouse). Agora, nosso objeto está pronto.
Viva, camaradas!
Resta adicionar esta função ao cabeçalho do arquivo
//+------------------------------------------------------------------+
//|                                                     Graphics.mqh |
//|                        Copyright 2020, MetaQuotes Software Corp. |
//|                            https://www.mql5.com/es/articles/7468 |
//+------------------------------------------------------------------+

// ...

//+------------------------------------------------------------------+
//| Class for plotting graphic objects                               |
//+------------------------------------------------------------------+
class CGraphics
  {

   // ...

public:

   // ...

   //--- Draws simple straight lines (vertical and horizontal)
   void              CGraphics::DrawSimple(
      ENUM_OBJECT _object_type, // Object type
      datetime    _time=-1,     // Time
      double      _price=-1     // Price
   )

   // ...
  }
;
//+------------------------------------------------------------------+
Bem, e também falta adicionar a manipulação para pressionar as teclas correspondentes:
//+------------------------------------------------------------------+
//|                                                    Shortcuts.mqh |
//+------------------------------------------------------------------+

// ...

//+------------------------------------------------------------------+
//| Event handling function                                          |
//+------------------------------------------------------------------+
void CShortcuts::OnChartEvent(
   const int id,
   const long &lparam,
   const double &dparam,
   const string &sparam
)
  {
//---
   int window = 0;
//---
   switch(id)
     {

      // ...

      //--- Handle keystrokes
      case CHARTEVENT_KEYDOWN:

         // ...

         //--- Draw a simple vertical line
         if(CUtilites::GetCurrentOperationChar(Simple_Vertical_Line_Key) == lparam)
           {
            m_graphics.DrawSimple(OBJ_VLINE);
           }
         //--- Draw a simple horizontal line
         if(CUtilites::GetCurrentOperationChar(Simple_Horizontal_Line_Key) == lparam)
           {
            m_graphics.DrawSimple(OBJ_HLINE);
           }

         // ...

         break;
         //---

     }
  }
No futuro, a fim de economizar espaço na tela e focar na essência, ao adicionar uma descrição de funções, eu, via de regra, não escreverei registros de cabeçalhos, e ao adicionar comandos simplesmente usarei as linhas correspondentes (destacadas em amarelo).
Como resultado, após todas as adições e compilação, obtivemos um resultado muito simples: dois comandos que desenham primitivas gráficas em qualquer lugar da janela atual:

As teclas correspondentes a essas linhas retas são, por padrão, designadas como "I" (i) e "H" (h).
Também quero lembrar que ao criar todos os objetos, dependendo do timeframe atual, a cor dos objetos será diferente. Além disso, os objetos timeframes mais baixos não serão exibidos em períodos mais altos (com as configurações padrão).


Para compatibilidade com MQL4, são usados apenas os timeframes da barra de ferramentas padrão, que são exibidos por padrão. Os mesmos timeframes são escolhidos usando o atalho "U" "D" (quando pressionamos essas teclas, o timeframe muda, respectivamente, para um quadro acima e um quadro abaixo - veja a função CUtilites::ChangeTimeframes).
VFun é o mesmo leque de Fibonacci
A próxima figura que eu queria desenhar era o leque de Fibonacci. Eu uso com bastante frequência, para mim dá jeito, mas lembrar-me de todos os seus raios toda vez que me sentava em outro terminal quando, digamos, mudava de sistema, era muito inconveniente. Por isso, pensei que, como agora tenho um Expert Advisor tão legal, seria simplesmente um pecado não usar esta oportunidade 🙂.
Enquanto eu estava pensando sobre isso, tive a ideia de que seria bom ter uma função universal que define os níveis de Fibonacci para qualquer objeto (leque, canal ou nível horizontal) que desenharei usando minha biblioteca. Esta é a função.
//+------------------------------------------------------------------+
//| Sets level values and form in any Fibonacci object               |
//|    Uses colors and styles from the class fields                  |
//| Parameters:                                                      |
//|    _object_name - the name of the Fibonacci object               |
//|    _levels_values[] - array of level values                      |
//+------------------------------------------------------------------+
void CGraphics::SetFiboLevels(
   string _object_name,                      // Object name
   const double &_levels_values[]            // Array of values
)
  {
   int i,                                      // Current level counter
       levels_count=ArraySize(_levels_values); // Total number of levels

//--- Check if the number of values in the array exceeds the allowed range
   if(levels_count>32 || levels_count==0)
     {
      Print(DEBUG_MESSAGE_PREFIX,": Levels cannot be set! Data array is incorrectly. ");
      return;
     }

//--- Proceed with the implementation

//--- Set the number of levels for the current object
   ObjectSetInteger(0,_object_name,OBJPROP_LEVELS,levels_count);
//--- Set value, color and style for each level.
   for(i=0; i<levels_count; i++)
     {
      ObjectSetDouble(0,_object_name,OBJPROP_LEVELVALUE,i,_levels_values[i]);
      ObjectSetInteger(0,_object_name,OBJPROP_LEVELCOLOR,i,m_Fibo_Default_Color);
      ObjectSetInteger(0,_object_name,OBJPROP_LEVELSTYLE,i,m_Fibo_Default_Style);
     }
//--- Redraw the chart before finishing
   ChartRedraw(0);
  }
Como parâmetros da função são passados o nome do objeto que deve receber os níveis e, basicamente, a matriz de valores de todos os níveis.
Primeiro, a função verifica quantos níveis foram passados para ela. Se a matriz for muito grande, a função presume que ocorreu um erro e não faz nada. Da mesma maneira ocorre a saída se não houver nenhum elemento na matriz.
Bem, se tudo estiver em ordem e o número de elementos na matriz não exceder o número permitido de níveis, então começamos a adicionar. Como o nome do objeto é especificado nos parâmetros, simplesmente definimos a propriedade correspondente do objeto igual ao número de elementos da matriz - iteramos sobre a matriz inteira, definindo os níveis em questão.
MQL5 também implementa a capacidade de definir diferentes parâmetros para níveis diferentes. Por exemplo, ao pintar um em verde, outro em amarelo e o terceiro em vermelho ou roxo. Bem como, ao fazer níveis de diferentes estilos (na forma de pontos, traços, sólidos...). Esses recursos não existem em MQL4. Mas, mesmo assim, adicionei ao ciclo linhas que definem cores e estilos de níveis. Elas não interferem na compilação e adicionam universalidade à MQL5.
As variáveis que descrevem os parâmetros padrão são descritas como membros privados da classe CGraphics e são inicializadas no construtor desta classe com os valores dos parâmetros do Expert Advisor.
//+------------------------------------------------------------------+
//|                                                     Graphics.mqh |
//+------------------------------------------------------------------+
//+------------------------------------------------------------------+
//| Class for plotting graphic objects                               |
//+------------------------------------------------------------------+
class CGraphics
  {
   //--- Fields
private:
   // ...
   color             m_Fibo_Default_Color;
   ENUM_LINE_STYLE   m_Fibo_Default_Style;
   // ...
//+------------------------------------------------------------------+
//| Default constructor                                              |
//+------------------------------------------------------------------+
CGraphics::CGraphics(void)
  {
   //...
   m_Fibo_Default_Color = Fibo_Default_Color;
   m_Fibo_Default_Style = VFun_Levels_Style;
  }
   // ...
Para aqueles que não se importam com a compatibilidade, adicionei uma substituição dessa função ao código. Esta implementa a capacidade de definir parâmetros para cada nível, usando matrizes passadas nos parâmetros da própria função. Mas para os que entendem como funciona (ou para os que entenderam cuidadosamente o meu código e conseguiram fazê-lo) não há nada de especial, por isso, se alguém precisar de uma descrição, escreva comentários. No arquivo, está incluída uma substituição desta função.
Vou dar mais uma função que define as descrições de níveis para qualquer objeto Fibonacci.
//+------------------------------------------------------------------+
//| Sets descriptions of levels in any Fibonacci object              |
//|    _object_name - the name of the Fibonacci object               |
//|    _levels_descriptions[] - array of level descriptions          |
//+------------------------------------------------------------------+
void CGraphics::SetFiboDescriptions(
   string _object_name,                  // Object name
   const string &_levels_descriptions[]  // Array of descriptions
)
  {
   int i,                                                                  // Current level counter
       levels_count=(int)ObjectGetInteger(0,_object_name,OBJPROP_LEVELS),  // The real number of levels
       array_size=ArraySize(_levels_descriptions);                         // The number of received descriptions
//--- Loop  through all levels
   for(i=0; i<levels_count; i++)
     {
      if(array_size>0 && i<array_size) // Choose a description from the array
        {
         //--- and write it to the level
         ObjectSetString(0,_object_name,OBJPROP_LEVELTEXT,i,_levels_descriptions[i]);
        }
      else // If the descriptions are not enough,
        {
         ObjectSetString(0,_object_name,OBJPROP_LEVELTEXT,i,""); // leave the description empty
        }
     }
//--- Redraw the chart before finishing
   ChartRedraw(0);
  }
Isso não é nada complicado. A única condição é que, no momento em que esta função é chamada, os níveis do objeto já devem ter sido especificados. Assim, a função simplesmente percorrerá esses níveis e atribuirá a descrição de cada valor correspondente a partir da matriz. Se não houver dados suficientes na matriz, todos os níveis "extras" simplesmente permanecerão sem descrição.
Agora, quando os níveis se tornaram fáceis de adicionar, podemos escrever a função de adição de leque.
//+------------------------------------------------------------------+
//| Draws a Fibonacci fan from the nearest local extremum.           |
//+------------------------------------------------------------------+
void CGraphics::DrawVFan(void)
  {
//---
   double levels_values[];                 // Array of level values
   string levels_descriptions[] = {};      // Array of level descriptions
   int p1=0,                               // Bar number for the fan starting point
       p2=0;                               // Bar number for the fan ending point
   double price1=0,                        // First point price
          price2=0;                        // Second point price
   string fun_name =                       // Fan name
      CUtilites::GetCurrentObjectName(allPrefixes[3],OBJ_FIBOFAN),
      fun_0_name =
         CUtilites::GetCurrentObjectName(allPrefixes[3]+"0_",OBJ_TREND);

//--- Get data for the fan from the parameter string
   CUtilites::StringToDoubleArray(VFun_Levels,levels_values);

//--- Find the extreme points closest to the mouse
   if(CMouse::Below())     // If the mouse cursor is below the price
     {
      CUtilites::SetExtremumsBarsNumbers(false,p1,p2);
      price1=iLow(Symbol(),PERIOD_CURRENT,p1);
      price2=iLow(Symbol(),PERIOD_CURRENT,p2);
     }
   else
      if(CMouse::Above())  // If the mouse cursor is above the price
        {
         CUtilites::SetExtremumsBarsNumbers(true,p1,p2);
         price1=iHigh(Symbol(),PERIOD_CURRENT,p1);
         price2=iHigh(Symbol(),PERIOD_CURRENT,p2);
        }
//--- Create the fan object
   ObjectCreate(
      0,fun_name,OBJ_FIBOFAN,0,
      iTime(Symbol(),PERIOD_CURRENT,p1),
      price1,
      iTime(Symbol(),PERIOD_CURRENT,p2),
      price2
   );

//--- The zero ray of this object is denoted by a colored line (for compatibility with MT4)
   TrendCreate(
      0,
      fun_0_name,
      0,
      iTime(Symbol(),PERIOD_CURRENT,p1),
      price1,
      iTime(Symbol(),PERIOD_CURRENT,p2),
      price2,
      CUtilites::GetTimeFrameColor(CUtilites::GetAllLowerTimeframes()),
      0,1,false,true,true
   );

//--- Describe the fan levels
   SetFiboLevels(fun_name,levels_values);
   SetFiboDescriptions(fun_name, levels_descriptions);

//--- Set standard parameters (such as timeframes and selection after creation)
   CurrentObjectDecorate(fun_name,m_Fibo_Default_Color);
//--- Also make out the "substitute" ray
   CurrentObjectDecorate(
      fun_0_name,
      CUtilites::GetTimeFrameColor(
         CUtilites::GetAllLowerTimeframes()
      )
   );

//---
   ChartRedraw(0);
  }
É conveniente para mim que o raio do qual é formado o leque se destaque numa cor em relação aos outros raios. Para implementar isso em MQL4, devemos desenhar uma linha reta regular sobre o leque, como no artigo anterior.
Neste caso, não preciso das legendas de nível, por isso uso uma matriz vazia.
Já a matriz de valores é criada a partir dos parâmetros do Expert Advisor usando a função-utilitário
CUtilites::StringToDoubleArray(VFun_Levels,levels_values);
Este utilitário para converter uma string numa matriz de números foi descrito no primeiro artigo da série.
Adicionamos um comando para desenhar um leque à lista de descrições de comandos:
//+------------------------------------------------------------------+
//|                                                   Shortcuts.mqhh |
//+------------------------------------------------------------------+

   //...
//--- Draw a Fibonacci fan (VFun)
         if(CUtilites::GetCurrentOperationChar(VFun_Key) == lparam)
           {
            m_graphics.DrawVFan();
           }
         break;
   //...
Compilamos e verificamos o que aconteceu. Para fazer isso, temos de ir para o terminal e selecionar o gráfico desejado.
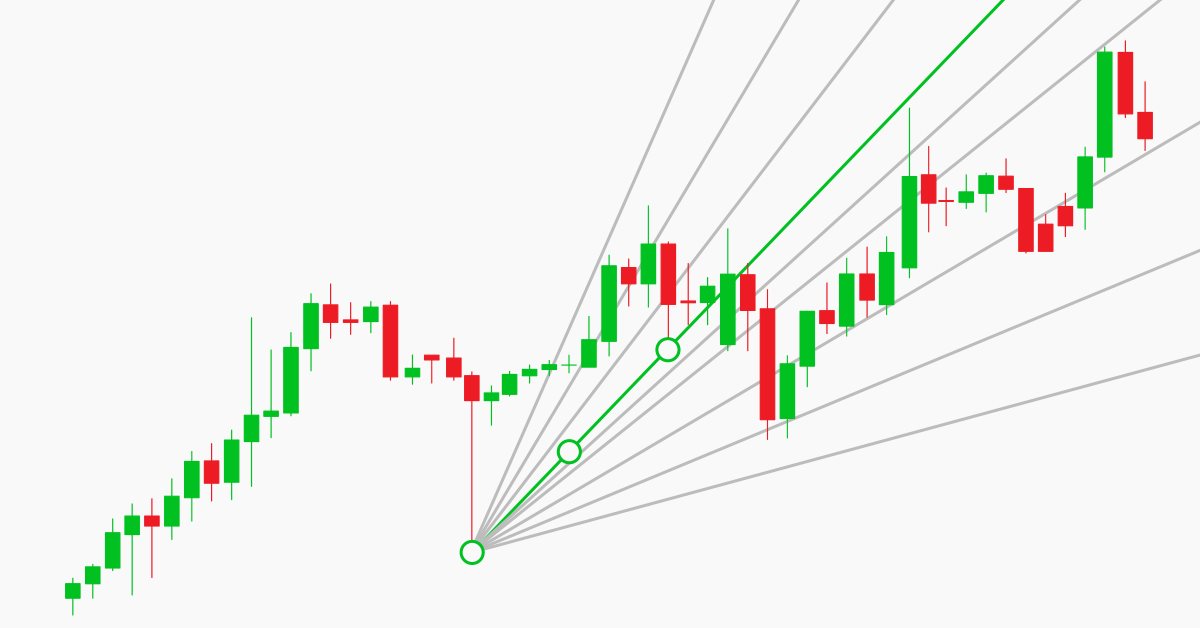
Como de costume, movemos o mouse da parte superior ou inferior do gráfico, ligeiramente para a esquerda do extremo que queremos tomar como base e, em seguida, pressionamos o botão "F"
")
A propósito, olhando para a configuração deste leque específico, presumi que o preço poderia cair muito em breve.
E assim acabou sendo... Mas esta é uma história completamente diferente.
")
Andrews' Pitchfork
Eu uso 3 tipos de garfos.
Para começar, após escolher os extremos de que preciso, desenho um garfo "simples". Os pontos deste garfo estão exatamente nos valores extremos dos preços.

O segundo tipo de garfo que Andrews descreve é o Schiff. Ponto 1 deste garfo é deslocado metade da distância 1-2 de acordo com a tendência. Consequentemente, a inclinação da linha central é menor. Se o movimento se encaixa nesses garfos, muito provavelmente o movimento é lateral, ou seja, o preço fica dentro de um movimento "corretivo".

E, finalmente, o garfo, que chamo de "reverso". Ponto 1 desses garfos é deslocado contra a tendência - da mesma forma, metade da distância 1-2. Esses garfos descrevem bem movimentos rápidos. Normalmente são mais curtos quanto ao tempo, mas vão além quanto ao preço.

Ao realizar análise durante meu trabalho prático, geralmente é mais conveniente quando todos os três tipos de garfos estão no gráfico ao mesmo tempo. Nesse caso, o movimento do preço junto com os pontos-chave dos prováveis extremos futuros é muito mais claro.

Para desenhar esse conjunto, a biblioteca usa duas funções. A primeira é na verdade uma função para desenhar qualquer tipo de "garfo".
//+------------------------------------------------------------------+
//| Creates Andrews' pitchfork using specified coordinates           |
//| Parameters:                                                      |
//|    _name - the name of created pitchfork                         |
//|    _base - the structure containing coordinates of  basic points |
//|    _type - pitchfork type (SIMPLE,SHIFF,REVERCE)                 |
//+------------------------------------------------------------------+
void  CGraphics::MakePitchfork(
   string _name,           // The name of the created object
   PitchforkPoints &_base, // Structure describing pitchfork base points
   PitchforkType _type     // Pitchfork type (SIMPLE,SHIFF,REVERCE)
)
  {
//---
   double price_first;                 // The price of the first point (depends on the type)
   color pitchfork_color;              // Pitchfork color (depends on the type)
   int pitchfork_width;                // Line width (depends on the type)
   ENUM_LINE_STYLE pitchfork_style;    // Line style (depends on the type)
   double fibo_levels[] = {1};         // Add external levels (only for MQL5)
   string fibo_descriptions[] = {""};  // Level description (only for MQL5)

//--- Set type dependent parameters:
   if(_type == SHIFF)      // Schiff pitchfork
     {
      price_first = _base.shiffMainPointPrice;
      pitchfork_color = Pitchfork_Shiff_Color;
      pitchfork_width = Pitchfork_Shiff_Width;
      pitchfork_style = Pitchfork_Shiff_Style;
     }
   else
      if(_type == REVERCE) // "Reverse" pitchfork
        {
         price_first = _base.reverceMainPointPrice;
         pitchfork_color = Pitchfork_Reverce_Color;
         pitchfork_width = Pitchfork_Reverce_Width;
         pitchfork_style = Pitchfork_Reverce_Style;
        }
      else
        {
         // "classic" pitchfork
         price_first =_base.mainPointPrice;
         pitchfork_color = Pitchfork_Main_Color;
         pitchfork_width = Pitchfork_Main_Width;
         pitchfork_style = Pitchfork_Main_Style;
        }

//--- Draw
   ObjectCreate(0,_name,OBJ_PITCHFORK,0,
                _base.time1,price_first,
                _base.time2,_base.secondPointPrice,
                _base.time3,_base.thirdPointPrice
               );
//--- Set the parameters common for all graphical objects
   CurrentObjectDecorate(
      _name,
      pitchfork_color,
      pitchfork_width,
      pitchfork_style
   );
//--- If MQL5
#ifdef __MQL5__
//--- add external levels (early levels for Andrews' pitchfork)
   SetFiboLevels(_name,fibo_levels);
   SetFiboDescriptions(_name,fibo_descriptions);
#endif

//--- Update the chart picture
   ChartRedraw(0);
  }
A segunda função calcula as coordenadas dos pontos 1, 2 e 3 (bases) para os garfos criados e inicia sequencialmente a renderização de todos os três objetos. A partir desses pontos, o garfo é desenhado usando a função e CGraphics::MakePitchfork descrita acima.
//+------------------------------------------------------------------+
//| Draws set of Andrews' pitchforks on one base. The set includes   |
//|    three pitchfork types: regular, Schiff and reverse Schiff     |
//|    (aka "micmed channel")                                        |
//+------------------------------------------------------------------+
void CGraphics::DrawPitchforksSet(void)
  {
   bool up=true;                             // direction (mouse below or above the price)
   double dropped_price = CMouse::Price();   // "Starting point" price
   int dropped_bar = CMouse::Bar();          // Starting point bar number
   string name = "";                         // The name of the current object
   PitchforkPoints base;                     // Structure for the base coordinates
//---
   if(CMouse::Below())
     {
      up=false;
     }
   else
     {
      if(!CMouse::Above()) // If the mouse pointer is on the candlestick, do nothing
        {
         if(Print_Warning_Messages)
           {
            Print(DEBUG_MESSAGE_PREFIX,": Set a point above or below the bar extreme price");
           }
         return;
        }
     }
//--- Find extremum bar numbers
   int bar_first = CUtilites::GetNearestExtremumBarNumber(
                      dropped_bar,
                      true,
                      up,
                      Pitchfork_First_Point_Left_Bars,
                      Pitchfork_First_Point_Right_Bars
                   );
   int bar_second = CUtilites::GetNearestExtremumBarNumber(
                       bar_first-1,
                       true,
                       !up,
                       Pitchfork_Second_Point_Left_Bars,
                       Pitchfork_Second_Point_Right_Bars
                    );
   int bar_third = CUtilites::GetNearestExtremumBarNumber(
                      bar_second-1,
                      true,
                      up,
                      Pitchfork_Third_Point_Left_Bars,
                      Pitchfork_Third_Point_Right_Bars
                   );
//--- If not found, report an error
   if(bar_first<0||bar_second<0||bar_third<0)
     {
      if(Print_Warning_Messages)
        {
         Print(DEBUG_MESSAGE_PREFIX,": Could not find points that match all conditions.");
        }
      return;
     }

//--- Fill the structure for basic control points
   base.mainPointPrice = up ?                               // Price - first basic point
                         iHigh(Symbol(),PERIOD_CURRENT,bar_first)
                         : iLow(Symbol(),PERIOD_CURRENT,bar_first);
   base.secondPointPrice = up ?                             // Price - second basic point
                           iLow(Symbol(),PERIOD_CURRENT,bar_second)
                           : iHigh(Symbol(),PERIOD_CURRENT,bar_second);
   base.thirdPointPrice = up ?                              // Price - third basic point
                          iHigh(Symbol(),PERIOD_CURRENT,bar_third)
                          : iLow(Symbol(),PERIOD_CURRENT,bar_third);
   base.shiffMainPointPrice = base.mainPointPrice-          // Price - first point of Schiff pitchfork
                              (base.mainPointPrice-base.secondPointPrice)/2;
   base.reverceMainPointPrice = base.mainPointPrice+        // Price - first point of "reverse" pitchfork
                                (base.mainPointPrice-base.secondPointPrice)/2;
   base.time1 = iTime(Symbol(),PERIOD_CURRENT,bar_first);   // Time of the first point
   base.time2 = iTime(Symbol(),PERIOD_CURRENT,bar_second);  // Time of the second point
   base.time3 = iTime(Symbol(),PERIOD_CURRENT,bar_third);   // Time of the third point


//--- Draw "regular" pitchfork
   if(Pitchfork_Show_Main)
     {
      name =CUtilites::GetCurrentObjectName(allPrefixes[4]+"_main",OBJ_PITCHFORK);
      MakePitchfork(name,base,SIMPLE);
     }

//--- Draw Schiff pitchfork
   if(Pitchfork_Show_Shiff)
     {
      name =CUtilites::GetCurrentObjectName(allPrefixes[4]+"_shiff",OBJ_PITCHFORK);
      MakePitchfork(name,base,SHIFF);
     }

//--- Draw "reverse" pitchfork
   if(Pitchfork_Show_Reverce)
     {
      name =CUtilites::GetCurrentObjectName(allPrefixes[4]+"_reverce",OBJ_PITCHFORK);
      MakePitchfork(name,base,REVERCE);
     }
//---
//ChartRedraw(0); not needed here as it is called when drawing each object
  }
Para descrever os tipos de garfos, uso a enumeração:
//+------------------------------------------------------------------+
//| Possible Andrews' pitchfork types                                |
//+------------------------------------------------------------------+
   enum PitchforkType
     {
      SIMPLE,
      SHIFF,
      REVERCE
     };
Eu pus a estrutura dos pontos (PitchforkPoints base;) para que quando chamemos a função de desenho passemos menos parâmetros para ela.
//+------------------------------------------------------------------+
//|  Structure describing a "base" for the Andrews' pitchfork         |
//+------------------------------------------------------------------+
   struct PitchforkPoints
     {
      double            mainPointPrice;        // Price - first base point
      double            shiffMainPointPrice;   // Price - second base point
      double            reverceMainPointPrice; // Price - third base point
      double            secondPointPrice;      // Price - first point of Schiff pitchfork
      double            thirdPointPrice;       // Price - first point of "reverse" pitchfork
      datetime          time1;                 // Time of the first point
      datetime          time2;                 // Time of the second point
      datetime          time3;                 // Time of the third point
     };
Bem, finalmente, adicionamos uma descrição da reação à tecla de controle no arquivo "Shortcuts.mqh":
//+------------------------------------------------------------------+
//|                                                   Shortcuts.mqhh |
//+------------------------------------------------------------------+

   //...
//--- Draw Andrews' Pitchfork
         if(CUtilites::GetCurrentOperationChar(Pitchfork_Key) == lparam)
           {
            m_graphics.DrawPitchforksSet();
           }
         break;
   //...
Compilamos, verificamos...
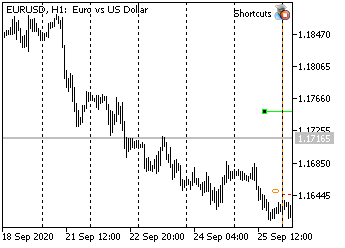
Para que um conjunto de garfos apareça no gráfico, pressionemos o botão "P" (Pitchfork).
Recursos de desenho de linhas de tendência no MetaTrader
Em princípio, os objetos que já descrevi podem ser usados para layout de qualquer coisa: linhas retas, existem garfos de Andrews, leque de Fibonacci, níveis horizontais e verticais...
Exatamente da mesma forma, encontrando pontos extremos à direita ou esquerda do mouse, podemos desenhar canais e níveis de Fibonacci horizontais... Se você desenhar essas coisas de alguma forma padronizada, por analogia com o que já foi escrito, você pode adicionar facilmente os recursos que faltam.
Para mim, o mais difícil nesta biblioteca acabou sendo as linhas retas delimitadas à direita e com um segundo ponto no futuro.
Essas linhas retas são muito convenientes para marcar níveis significativos - tanto segundo preço quanto segundo tempo. Como regra, o preço nota esses níveis e forma pelo menos um extremo local em algum lugar próximo e, muitas vezes, reverte.
Mas ao desenhar, verifica-se que no MetaTrader a função de desenho de linha usa preço e tempo.
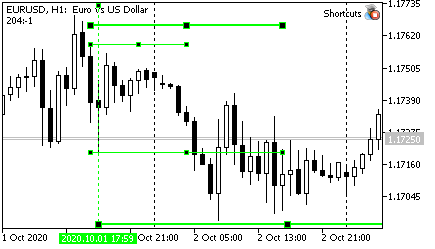
O primeiro problema ocorre quando as linhas são desenhadas na sexta-feira e a borda direita cai na segunda-feira.

Visto que na sexta-feira o MT pensa que deve ser domingo, e já na segunda-feira de repente percebe que não poderia ter negociado naquele dia e que, portanto, é necessário por fora dois dias - a linha traçada pelas coordenadas de tempo será necessariamente reduzida. Isso pode ser visto claramente na imagem acima.
Se eu precisar medir um certo número de barras no gráfico, esse comportamento será inconveniente.
A solução é bastante simples: a data é calculada não com base no calendário, mas, sim, nos pontos. As coordenadas do mouse mostram exatamente o ponto no gráfico, sendo que a distância entre os candles sempre pode ser calculada (por exemplo, conforme descrito na primeira parte, na seção "Distância entre barras adjacentes (em pixels)") - basta contar o número de candles à direita necessário e, em seguida, transformar as coordenadas da tela em tempo e preço usando a função padrão ChartXYToTimePrice. Nós só precisamos traçar essa linha na segunda-feira, não na sexta-feira, para que o "colapso do domingo" não interfira na imagem.
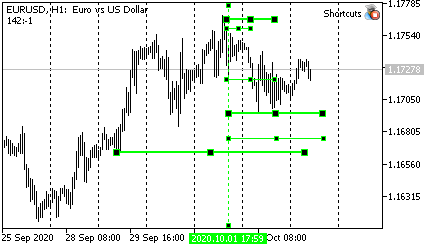
E tudo ficaria bem neste método, mas... O tamanho do espaço em que o MT pode desenhar é limitado. Se tentarmos traçar uma linha maior do que a desenhada pelo programa (por exemplo, perto da borda, como na imagem à esquerda), os efeitos podem ser muito inesperados.
Assim, a figura da direita mostra a mesma linha desenhada pelo autômato, só que agora o gráfico é deslocado para que a borda direita fique visível, e a linha normal é mostrada abaixo, que deveria estar nesta escala. A extremidade direita da linha superior, a julgar por suas propriedades, avançou quase seis meses!
Às vezes, quando havia uma linha inclinada, eu observava como a linha se desdobrava na direção oposta. O MT não conseguiu converter as coordenadas do ponto na data correta, por isso, ele apenas redefiniu para 0 (portanto, a data resultou ser 1º de janeiro de 1970)... Se desenharmos linhas segundo datas, esse efeito não ocorre.
Conclusão: é necessária uma função que calcule datas já num futuro indefinido, para que linhas retas sejam fáceis e agradáveis de traçar.
Então vamos fazer!
Função para obter a data no futuro
Normalmente, há algum ponto no presente ou no passado a partir do qual queremos medir algo (por exemplo, algum tipo de extremo). Além disso, via de regra, sabemos a distância em barras que queremos recuar ou podemos calculá-la facilmente. Ou seja, a tarefa mais frequente desta função será calcular o tempo relativo a algum ponto segundo o deslocamento das barras. No entanto, também gosto do efeito de alongamento/encurtamento dos níveis dependendo da escala, respectivamente, às vezes quero que a função calcule o tempo com base em pontos e não em barras.
Tanto o número de pontos quanto o número de barras são inteiros, portanto, para entender o que fazer, a função precisa de algum tipo de indicação. Vamos começar com isso.
//+------------------------------------------------------------------+
//|                                              GlobalVariables.mqh |
//+------------------------------------------------------------------+

//...
//+------------------------------------------------------------------+
//| The enumeration describes possible options for calculating the   |
//|   time of the next bar                                           |
//|      COUNT_IN_BARS - calculate date by the number of bars        |
//|      COUNT_IN_PIXELS - calculate date by the number of pixels    |
//+------------------------------------------------------------------+
enum ENUM_FUTURE_COUNT {
   COUNT_IN_BARS,    // By bars
   COUNT_IN_PIXELS   // By pixel
};
//...
Todas as descrições de enumerações e variáveis globais estão no arquivo GlobalVariables.mqh. Naturalmente, também é necessário anotar a enumeração de opções para escolher intervalos para nossa função futura.
A função em si não desenha nada e não tem nada a ver com o mouse. Por isso, vais ficar nos seus utilitários!
//+------------------------------------------------------------------+
//|                                                     Utilites.mqh |
//+------------------------------------------------------------------+

//...
class CUtilites
  {
public:
//...
   //--- Calculates a date in the future relative to the start date with the _length interval, specified in pixels or bars
   static datetime          GetTimeInFuture(
      const datetime _start_time,                         // Reference time based on which the future bar is calculated
      const int _length,                                  // Interval length (in bars or pixels)
      const ENUM_FUTURE_COUNT _count_type=COUNT_IN_BARS   // Interval type (pixels or bars).
   );

//...

//+------------------------------------------------------------------+
//| The function tries to calculate date in the future using the     |
//|   screen x and y coordinates                                     |
//| If calculation is unsuccessful (time exceeds limits), calculates |
//|   time with an error: as a sum of dates excluding Sundays.       |
//| Parameters:                                                      |
//|   _current_time,              Source time,                       |
//|   _length,                    Interval length                    |
//|                                 (in bars or in pixels)           |
//|   _count_type=COUNT_IN_BARS   How interval length is measured.   |
//|      COUNT_IN_BARS - the interval is set in bars;                |
//|      COUNT_IN_PIXELS - the interval is set in pixels.            |
//| Returns:                                                         |
//|   Time in the future distant from the _current_time              |
//|      by an interval in pixels or bars (_length)                  |
//+------------------------------------------------------------------+
datetime CUtilites::GetTimeInFuture(
   const datetime _start_time,                         // Reference time based on which the future bar is calculated
   const int _length,                                  // Interval length (in bars or pixels)
   const ENUM_FUTURE_COUNT _count_type=COUNT_IN_BARS   // Interval type (pixels or bars).
)
  {
//---
   datetime
      future_time;      // Variable for result
   int
      bar_distance =  GetBarsPixelDistance(),   // Distance in pixels between two adjacent bars
      current_x,                                // The x coordinate of the starting point
      future_x,                                 // The x coordinate of the result
      current_y,                                // The y coordinate, does not affect the result; needed for the conversion function
      subwindow = 0;                            // Subwindow index
   double current_price;                        // Any initial price, does not affect the result


//--- Convert the time passed in parameters into the screen coordinate x
   ChartTimePriceToXY(0,subwindow,_start_time,CMouse::Price(),current_x,current_y);

//--- Calculate a point in the future in screen coordinates
   if(COUNT_IN_BARS == _count_type) // If the length is specified in bars,
     {
      // then the interval size should be converted to pixels.
      future_x = current_x + _length*bar_distance;
     }
   else // ... If the length is in pixels,
     {
      // use it as is
      future_x = current_x + _length;
     }

//--- Convert screen coordinates into time
   if(ChartGetInteger(0,CHART_WIDTH_IN_PIXELS)>=future_x) // If successful,
     {
      ChartXYToTimePrice(0,future_x,current_y,subwindow,future_time,current_price);  // convert the resulting value
     }
   else // Otherwise, if time cannot be calculated because it exceeds limits
     {
      future_time =        // Calculate time as usual, in seconds
         _start_time       // To the starting time
         +(                // add
            ((COUNT_IN_BARS == _count_type) ? _length : _length/bar_distance) // interval size in bars
            *PeriodSeconds()  // multiplied by the number of seconds in the current period
         );
     }
//--- Return the resulting value
   return future_time;
  }
Porém, ao ser usada, aconteceu que a função descrita na versão anterior nem sempre dava o resultado correto. Por isso, ele teve que ser reescrito. Tudo acabou sendo muito mais simples do que escrevi antes...
//+------------------------------------------------------------------+
//|                                                     Utilites.mqh |
//+------------------------------------------------------------------+
//...
//+------------------------------------------------------------------+
//| Calculates a distance in pixels between two adjacent bars        |
//+------------------------------------------------------------------+
int        CUtilites::GetBarsPixelDistance(void)
  {
//--- Calculate the distance
   return ((int)MathPow(2,ChartGetInteger(0,CHART_SCALE)));
  }
//...
Níveis horizontais limitados
Eu mostrei como eram esses níveis na seção anterior. É simples: um pedaço de pau de um certo comprimento, de preferência, independente de onde você clicar com o mouse. Como ele é desenhado diretamente do ponto para o qual o cursor do mouse está apontando, você precisa selecionar os pontos com um pouco mais de cuidado do que, digamos, para um leque.
É conveniente para mim que esses níveis tenham um comprimento estritamente definido (empiricamente) em pixels. Assim, com escalas diferentes, um número diferente de barras cairá dentro do intervalo desta linha, o que é bastante lógico para mim 😉
Eu também queria poder desenhar, com a mesma escala, um nível de linha "normal" e "alongado".
Eis o que consegui:
//+------------------------------------------------------------------+
//|                                                     Graphics.mqh |
//+------------------------------------------------------------------+

//+------------------------------------------------------------------+
//| Draws a horizontal level                                         |
//| Parameters:                                                      |
//|   _multiplicator - multiplier for determining the length         |
//|                of the larger level (how many times higher)       |
//+------------------------------------------------------------------+
//---
void CGraphics::DrawHorizontalLevel(
   double _multiplicator // Multiplier for the level length
)
  {
//--- Description of variables
   datetime p2_time;          // Time of point 2
   string Level_Name ="";     // Level name

//Color of the current line (equal to  the general color of the current time interval)
   color Level_Color=CUtilites::GetTimeFrameColor(CUtilites::GetAllLowerTimeframes());
   int window = 0;            // The index of the subwindow in which the line is drawn
   ENUM_LINE_STYLE Current_Style = STYLE_SOLID; // Line style
   int Current_Width=1;                         // Line width
   int level_length = 0;                        // Line length

//--- Get the length (in pixels)
   if(Short_Level_Length_In_Pixels)
     {
      // If EA parameters instruct to measure in pixels,
      level_length = Short_Level_Length_Pix; // ...Use the length from parameters
     }
   else
     {
      // Otherwise the number of candlesticks is specified in parameers
      level_length = Short_Level_Length * CUtilites::GetBarsPixelDistance();
     }

//--- Set level parameters
   if(_multiplicator>1) // If the level is extended
     {
      Level_Name = CUtilites::GetCurrentObjectName(allPrefixes[7]);
      Current_Style = Long_Level_Style;
      Current_Width = Long_Level_Width;
     }
   else                 // An if the level is short
     {
      Level_Name = CUtilites::GetCurrentObjectName(allPrefixes[6]);
      Current_Style = Short_Level_Style;
      Current_Width = Short_Level_Width;
     }

//--- Calculate real coordinates (price and time) for the second point
   p2_time = CUtilites::GetTimeInFuture(CMouse::Time(),level_length*_multiplicator,COUNT_IN_PIXELS);


//--- Draw a line using the known coordinates
   TrendCreate(0,
               Level_Name,
               0,
               CMouse::Time(),
               CMouse::Price(),
               p2_time,
               CMouse::Price(),
               Level_Color,
               Current_Style,
               Current_Width
              );
//---

   ChartRedraw(0);
  }
O primeiro ponto da linha é obtido com base no ponteiro do mouse. Ao calcular o segundo ponto, o programa primeiro escolhe se o tamanho da linha mudará quando a escala do gráfico for alterada e, depois, calcula as coordenadas do segundo ponto em pixels e as recalcula em preço e tempo. (Quando há uma função pronta, os cálculos são muito fáceis 🙂.
Resta adicionar comandos de controle ao arquivo Shortcuts.mqh:
//+------------------------------------------------------------------+
//|                                                    Shortcuts.mqh |
//+------------------------------------------------------------------+

// ...

//--- Draw a short limited level
         if(CUtilites::GetCurrentOperationChar(Short_Level_Key) == lparam)
           {
            m_graphics.DrawHorizontalLevel(1);
           }
//--- Draw an extended limited level
         if(CUtilites::GetCurrentOperationChar(Long_Level_Key) == lparam)
           {
            m_graphics.DrawHorizontalLevel(Long_Level_Multiplicator);
           }
// ...
Como resultado, se o parâmetro Short_Level_Length_In_Pixels for true, após pressionar a tecla S (Short) o programa desenhará uma vara horizontal com o comprimento em pixels especificado no parâmetro Short_Level_Length_Pix.
Se Short_Level_Length_In_Pixels == false, o comprimento do nível será medido em velas e será obtido a partir do parâmetro Short_Level_Length.
Se pressionarmos a tecla "L" (Long), o comprimento da linha será duplicado (será multiplicado pelo número especificado no parâmetro Long_Level_Multiplicator)
Linha de tendência limitada
A linha de tendência, em minha opinião, pode levar uma carga dupla.
Por um lado, ela mostra o limite da taxa de mudança de preço ("não mais rápido", se o preço estiver abaixo da linha; ou "não mais lento" , se estiver acima).
Por outro lado, se uma linha reta é limitada com base no preço e tempo (ou seja, não é um raio), ela pode indicar níveis notavelmente (preço e tempo, simultaneamente). Claro, pode-se usar um retângulo ou qualquer outra coisa para esses fins, mas, na minha opinião, a linha diagonal é ainda mais clara.
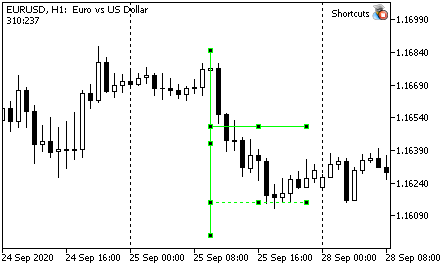
Por isso, eu modifico a função CGraphics::DrawTrendLine. Primeiro, a linha agora continua no futuro por um período limitado de tempo, indicando assim o preço estimado. Em segundo lugar, para maior clareza, adicionei os níveis usuais - horizontal e vertical.
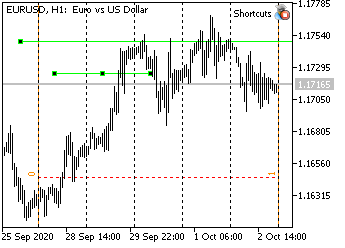
Fica isso:

Claro, o comprimento da linha (quantas vezes o comprimento total é maior que a distância entre os pontos iniciais), o número de barras para valores extremos e outras características da linha reta são configurados nos parâmetros do EA.
//+------------------------------------------------------------------+
//|                                                     Graphics.mqh |
//+------------------------------------------------------------------+

//+------------------------------------------------------------------+
//| Draws a trend line using two nearest extreme points.             |
//|   Extremum length (number of bars on left and right) is set      |
//|   by parameters Fractal_Size_Left and Fractal_Size_Right         |
//|                                                                  |
//| There is a "Trend_Points" variable in the global parameters.     |
//|                                                                  |
//| If the variable value is equal to "TREND_DOTS_EXTREMUMS",        |
//|   end points of the straight line will lie strictly at extrema.  |
//| If the values is "TREND_DOTS_HALF", the line will be             |
//|   extended into the future by a distance of                      |
//|   (p2-p1)*Trend_Length_Coefficient                               |
//+------------------------------------------------------------------+
void              CGraphics::DrawTrendLine(void)
  {
   int dropped_bar_number=CMouse::Bar(); // candlestick number under the mouse
   int p1=0,p2=0;                        // numbers of the first and seconds points
   string trend_name =                   // trend line name
      CUtilites::GetCurrentObjectName(allPrefixes[0],OBJ_TREND);
   double
      price1=0,   // price of the first point
      price2=0,   // price of the second point
      tmp_price;  // variable for temporary storing of the price
   datetime
      time1=0,    // time of the first point
      time2=0,    // time of the second point
      tmp_time;   // a variable to store time


//--- Setting initial parameters
   if(CMouse::Below()) // If a mouse cursor is below the candlestick Low
     {
      //--- Find two extreme points below
      CUtilites::SetExtremumsBarsNumbers(false,p1,p2);

      //--- Determine point prices by Low
      price1=iLow(Symbol(),PERIOD_CURRENT,p1);
      price2=iLow(Symbol(),PERIOD_CURRENT,p2);
     }
   else // otherwise
      if(CMouse::Above()) // If a mouse cursor is below the candlestick High
        {
         //--- Find two extreme points above
         CUtilites::SetExtremumsBarsNumbers(true,p1,p2);

         //--- Determine point prices by High
         price1=iHigh(Symbol(),PERIOD_CURRENT,p1);
         price2=iHigh(Symbol(),PERIOD_CURRENT,p2);
        }
      else
        {
         return;
        }
//--- The time of the first and second points does not depend on the direction
   time1=iTime(Symbol(),PERIOD_CURRENT,p1);
   time2=iTime(Symbol(),PERIOD_CURRENT,p2);

//--- If the line should be extended to the right
   if(Trend_Points == TREND_POINTS_HALF)
     {
      //--- Temporarily save the coordinates of point 2
      tmp_price = price2;
      tmp_time = time2;

      //--- Calculate the time of the second point
      time2 = CUtilites::GetTimeInFuture(time1,(p1-p2)*Trend_Length_Coefficient);

      //--- Calculate the price of the second point
      price2 = NormalizeDouble(price1 + (tmp_price - price1)*Trend_Length_Coefficient,Digits());

      //--- Draw boundary levels by price and time
      DrawSimple(OBJ_HLINE,time2,price2);
      DrawSimple(OBJ_VLINE,time2,price2);
     }

//--- Draw the line
   TrendCreate(0,trend_name,0,
               time1,price1,time2,price2,
               CUtilites::GetTimeFrameColor(CUtilites::GetAllLowerTimeframes()),
               0,Trend_Line_Width,false,true,m_Is_Trend_Ray
              );

//--- Redrawing the chart
   ChartRedraw(0);
  }
As principais mudanças no código estão destacadas em amarelo.
Bem, depois, tudo é simples. O número de barras entre os pontos é igual (p1-p2) (lembramo-nos que os números das barras aumentam para a direita), o coeficiente permite calcular quanto precisamos para alongar o intervalo e, em seguida, basta chamarmos a função de utilitários, mesmo sem o terceiro parâmetro, pois permite a contagem em barras por padrão.
Em seguida, calculamos o preço, desenhamos os níveis usando a função descrita anteriormente DrawSimple, que está na mesma classe, e desenhamos a linha principal.
Após ler um código semelhante, os iniciantes às vezes querem saber como é que a função "sabe" onde adicionar o preço: para cima ou para baixo? Se a linha vai de cima para baixo, o preço deve ser subtraído, e se de baixo para cima, deve ser adicionado...
Observe que, uma vez que não é importante para nós se estamos ancorados nos mínimos ou nos máximos (já verificamos isso, no início da função), a direção é determinada exclusivamente pela expressão price1 + (tmp_price - price1).
Se a linha vem de cima, entãoprice1 será mais do que o preço do segundo ponto e, portanto, a expressão (tmp_price - price1) será negativa. Assim, a partir do preço inicial, nós subtraímos a distância de que precisamos.
Se a linha vem de baixo para cima, o preço que define o segundo ponto será maior que o primeiro e, portanto, a expressão entre colchetes será positiva, e a distância será adicionada ao preço inicial.
A última nuance desta função que quero ressaltar também é uma explicação para iniciantes. Se os preços forem calculados na função, então os dados devem ser normalizados, ou seja, devemos nos certificar de que o número que recebemos tem o mesmo número de casas decimais que as cotações no gráfico. Caso contrário, na maioria dos casos, o terminal não poderá vender ou comprar. É para essa normalização que é utilizada a função NormalizeDouble.
No arquivo Shortcuts.mqh não é necessária nenhuma mudança. A linha ainda é desenhada usando o "T" (Trend), e para desenhá-lo, só precisamos chamar a função acima.
//+------------------------------------------------------------------+
//|                                                    Shortcuts.mqh |
//+------------------------------------------------------------------+

//...
//--- Draw a trend line
         if(CUtilites::GetCurrentOperationChar(Trend_Line_Key) == lparam)
           {
            m_graphics.DrawTrendLine();
           }
//...
Desenho de níveis verticais
Uma vez que os mercados são propensos a tendências e o movimento do preço não é totalmente acidental, na maioria das vezes para negociar podemos usar a regra de que o preço sempre tende a percorrer a mesma distância que já fez. Qual a direção é uma questão separada, que não é relevante dentro deste artigo. Frequentemente, rompendo, digamos, a borda de uma barra de alfinetes ou de algum candle grande, o preço se move na mesma distância que foi medida por essa barra e depois se inverte.
No entanto, muitos grandes traders (que em última análise determinam a direção) preferem sair da posição um pouco antes do nível de 100% ser atingido. Assim, o preço muitas vezes não atinge os níveis conhecidos pela maioria, às vezes um pouco, mas ainda assim...
Portanto, também uso níveis fracionários para negociação. Os níveis 7/8 me ajudam, eu uso o resto com muita menos frequência... Para visualizar esses níveis na tela, foi criado o último instrumento considerado no artigo.
Após tudo isso, a função de desenhar níveis parece completamente trivial.
//+------------------------------------------------------------------+
//|                                                     Graphics.mqh |
//+------------------------------------------------------------------+

//+------------------------------------------------------------------+
//| Draws a vertical line at levels 7/8 and 14/8 of the              |
//|   current candlestick size                                       |
//+------------------------------------------------------------------+
void CGraphics::DrawVerticalLevels(void)
  {
//--- Description of variables
   string
   Current_Vertical_Name =   // The name of the basic vertical line
      CUtilites::GetCurrentObjectName(allPrefixes[5]),
      Current_Level_Name =          // The name of the current level
         CUtilites::GetCurrentObjectName(allPrefixes[5]+"7_8_");
   double
   Current_Line_Lenth,           // The length of the current line (level or vertical)
   Current_Extremum,             // Working extremum (High or Low, depending on the mouse position
   Level_Price,                  // Level price
   High = iHigh(Symbol(),PERIOD_CURRENT,CMouse::Bar()), // The High price of the current candlestick
   Low =  iLow(Symbol(),PERIOD_CURRENT,CMouse::Bar());  // The Low price of the current candlestick
   int
   direction=0;                  // Price increment sign
   long timeframes;                 // List of working timeframes
   datetime
   Current_Date =                // Time of the current bar
      iTime(Symbol(),PERIOD_CURRENT,CMouse::Bar()),
      Right_End_Time =              // Time of the right border of the level
         CUtilites::GetTimeInFuture(Current_Date,Short_Level_Length);

//--- Calculating candlestick length
   Current_Line_Lenth = (High-Low)*2;

//--- Initialization of the main variables depending on the desired drawing direction
   if(CMouse::Above()) // If the mouse is above
     {
      Current_Extremum = High;   // The main price is High
      direction = -1;            // Drawing direction - downward
     }
   else              // Otherwise
     {
      if(CMouse::Below()) // If the mouse is below
        {
         Current_Extremum = Low; // The main price is Low
         direction = 1;          // Drawing direction is upward
        }
      else         // If the mouse is in the middle of the candlestick, exit
        {
         return;
        }
     }

//--- Vertical line
   TrendCreate(0,
               Current_Vertical_Name,
               0,
               Current_Date,
               Current_Extremum,
               Current_Date,
               Current_Extremum+(Current_Line_Lenth*2)*direction,
               CUtilites::GetTimeFrameColor(CUtilites::GetAllLowerTimeframes()),
               Vertical_With_Short_Levels_Style,
               Vertical_With_Short_Levels_Width
              );
//--- First level (7/8)
   Level_Price = Current_Extremum+(Current_Line_Lenth*Vertical_Short_Level_Coefficient)*direction;
   TrendCreate(0,
               Current_Level_Name,
               0,
               Current_Date,
               Level_Price,
               Right_End_Time,
               Level_Price,
               CUtilites::GetTimeFrameColor(CUtilites::GetAllLowerTimeframes()),
               Short_Level_7_8_Style,
               Short_Level_7_8_Width
              );
//--- Second level (14/8)
   Current_Level_Name = CUtilites::GetCurrentObjectName(allPrefixes[5]+"14_8_");
   Level_Price = Current_Extremum+(Current_Line_Lenth*2*Vertical_Short_Level_Coefficient)*direction;
   TrendCreate(0,
               Current_Level_Name,
               0,
               Current_Date,
               Level_Price,
               Right_End_Time,
               Level_Price,
               CUtilites::GetTimeFrameColor(CUtilites::GetAllLowerTimeframes()),
               Short_Level_14_8_Style,
               Short_Level_14_8_Width
              );
  }
Deixe-me chamar sua atenção para dois momentos. Em primeiro lugar, eu sempre calculo o tempo destes níveis segundo as barras. O número necessário de barras é obtido da variável Short_Level_Length, portanto, sempre sei quantas barras serão medidas.
Em segundo lugar, aqui você tem que calcular o preço com base em apenas um ponto. Por isso é necessário definir parâmetros dependentes da direção, para que não precisemos verificar e escrever códigos duplos todas as vezes. Em particular, o parâmetro direction pelo qual cada termo é multiplicado, exceto para o primeiro ponto. Assim, novamente consigo usar uma expressão que descreve o comportamento da linha, mas o sinal dos termos nesta expressão depende de onde está o mouse: acima ou abaixo do candle...
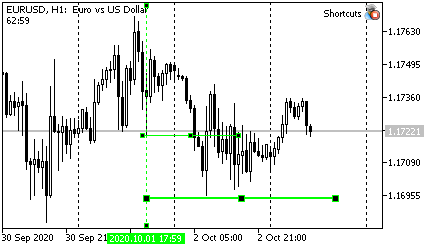
A forma final é como a mostrada.
Ao arquivo Shortcuts.mqh adicionamos uma estrutura de controle:
//+------------------------------------------------------------------+
//|                                                    Shortcuts.mqh |
//+------------------------------------------------------------------+

//...
//--- Draw a vertical line with 7/8 levels
         if(CUtilites::GetCurrentOperationChar(Vertical_With_Short_Levels_Key)  == lparam)
           {
            m_graphics.DrawVerticalLevels();
           }
         break;
Tecla para desenho - V (Vertical).
Teclas usadas na implementação atual da biblioteca
| Ação | Teclas | Da palavra em inglês |
|---|---|---|
| Ir para um timeframe acima segundo os períodos principais (do painel de períodos) | U | Up |
| Ir para um timeframe abaixo | D | Down |
| Alterar o nível Z do gráfico (gráfico acima ou abaixo dos objetos) | Z | Z order |
| Desenhar uma linha de tendência inclinada segundo dois extremos unidirecionais mais próximos do mouse | T | Trend line |
| Alternar o modo raio para novas retas | R key | Ray |
| Desenhar uma barra vertical simples | I(i) | [Only visual vertical] |
| Desenhar uma barra horizontal simples | H | Horizontal |
| Desenhar um conjunto de garfos de Andrews | P | Pitchfork |
| Desenhar um leque de Fibonacci (VFun) | F key | Fun |
| Desenhar um nível horizontal curto | S | Short |
| Desenhar um nível horizontal estendido | L key | Long |
| Desenhar uma barra vertical com marcas de nível | V | Vertical |
Fim do artigo
Como muitos outros, espero que o artigo seja útil para você, mas não garanto nada 🙂. Como resultado obtivemos uma ferramenta muito flexível, adequada para trabalhar em qualquer um dos mercados com que me deparei pessoalmente, mas se todos que lerem este artigo o usarem com as configurações padrão, terão de considerar que provavelmente alguns mercados podem mudar... Certamente a mudança não será muito significativa, porque ela é a essência do mercado...
Escreva comentários e mensagens privadas, com certeza vou lê-los, no entanto, não garanto isso de imediato.
E desejo que obtenha lucros estáveis!
Traduzido do russo pela MetaQuotes Ltd.
Artigo original: https://www.mql5.com/ru/articles/7908
 Redes neurais de Maneira Fácil (Parte 6): Experimentos com a taxa de aprendizado da rede neural
 Redes Neurais de Maneira Fácil (Parte 5): Cálculos em Paralelo com o OpenCL
 Gradient Boosting (CatBoost) no desenvolvimento de sistemas de negociação. Uma abordagem ingênua
 Como ganhar US$ 1 000 000 por meio do trading algorítmico? Nos serviços MQL5.com!
- Aplicativos de negociação gratuitos
- 8 000+ sinais para cópia
- Notícias econômicas para análise dos mercados financeiros
Você concorda com a política do site e com os termos de uso