Manual charting and trading toolkit (Part II). Chart graphics drawing tools

Introduction
The purpose of my previous article was to create a convenient toolkit allowing to quickly draw straight lines on charts using keyboard shortcuts. The first article includes a video demonstrating how the ready-made solution works.
There is no GUI in the current implementation (although it is planned for the future). The program simply draws lines based on the keyboard shortcut. It speeds up access to such actions as changing the current chart "level" (Z-index), switching timeframes and switching the straight line drawing mode (ray/segment).
The mouse position determines the place where the objects should be drawn. If the pointer is above the price, the candlestick Highs are selected as base points. If the pointer is below the price, then Low prices are used.
The current library version can draw the following objects:
- Simple ("endless") straight lines — horizontal and vertical lines.
- Regular trend lines (by two extreme points closest to the mouse). You can set the line to be drawn as a segment or as a ray. If the line is a segment, a special mode allows setting its end to a point in the future. In this case, the line size is equal to the distance between the extremes multiplied by a certain coefficient, which can be specified in the EA parameters.
- Horizontal levels of a certain length (not endless). The toolkit can draw short and "extended" lines, for which you specify a ratio relatively to the short line.
- A vertical line with level labels.
- Fibonacci fan. The level parameters are configurable, but I use a slightly modified version, which once was shown on "Onyx" by a man with the nickname Vadimcha. They called this fan VFan, which name I continue using in my code.
- Andrews' Pitchfork set consisting of three objects.
The project structure is pretty simple. The library has five related files: "GlobalVariables.mqh", "Graphics.mqh", "Mouse.mqh", "Shortcuts.mqh", "Utilites.mqh". All files are located in one Shortcuts folder in the standard Include directory.
The main file is "Shortcuts.mqh", to which all other files are connected. An instance of the CShortcuts class is created in this file, enabling an easy connection of the library to your main Expert Advisor.
In the previous article, I focused on the helper file "Utilites.mqh". In this article, we will mainly deal with the "Graphics.mqh" file containing drawing logic.
Global Settings File
The second library version provides significantly expanded configuration options, since it has more objects that can be affected. The full code of the current version is as follows:
//+------------------------------------------------------------------+
//|                                              GlobalVariables.mqh |
//|                        Copyright 2020, MetaQuotes Software Corp. |
//|                            https://www.mql5.com/en/articles/7908 |
//+------------------------------------------------------------------+
#property copyright "Copyright 2020, MetaQuotes Software Corp."
#property link      "https://www.mql5.com/en/articles/7908"
//+------------------------------------------------------------------+
//| File describing parameters available to the user                 |
//+------------------------------------------------------------------+
#define VERSION 2.0 // Not #property but a constant. A bit more convenient.
//+------------------------------------------------------------------+
//| Key settings                                                     |
//+------------------------------------------------------------------+
input string   Keys="=== Key settings ===";
input string   Up_Key="U";                          // Switch timeframe up
input string   Down_Key="D";                        // Switch timeframe down
input string   Trend_Line_Key="T";                  // Trend line
input string   Switch_Trend_Ray_Key="R";            // Indication of a trend line ray
input string   Z_Index_Key="Z";                     // Indication of the chart on top
input string   Vertical_With_Short_Levels_Key="V";  // Vertical segment
input string   Short_Level_Key="S";                 // Short level
input string   Long_Level_Key="L";                  // Extended level
input string   Simple_Horizontal_Line_Key="H";      // Simple horizontal line
input string   Simple_Vertical_Line_Key="I";        // Simple vertical line
input string   VFun_Key="F";                        // Fibonacci fan
input string   Pitchfork_Key="P";                   // Andrews' pitchfork

//+------------------------------------------------------------------+
//| Color setting                                                    |
//+------------------------------------------------------------------+
input string   Colors="=== Color Settings ===";
input color    VFan_Color=clrLightGray;            // Color of the fan lines
                                                   //   (and an additional
                                                   //    one for special cases)
//---
input color    Pitchfork_Main_Color = clrBlue;     // Andrews' pitchfork color
input color    Pitchfork_Shiff_Color = clrRed;     // Schiff pitchfork color
input color    Pitchfork_Reverce_Color = clrYellow;// "Reverse" pitchfork color

//+------------------------------------------------------------------+
//| Size settings                                                    |
//+------------------------------------------------------------------+
input string   Dimensions="=== Size settings ===";
input int      Short_Level_Length=12;     // Short level length (bar)
input int      Short_Level_Width=1;       // Line width for the short level
input int      Long_Level_Width=2;        // Line width for the long level
input int      Vertical_With_Short_Levels_Width=1; // Vertical line width with levels
input int      Short_Level_7_8_Width=1;   // Level 7/8 line width
input int      Short_Level_14_8_Width=1;  // Level 14/8 line width
input int      Simple_Vertical_Width=1;   // Simple vertical line width
input int      Simple_Horizontal_Width=1; // Simple horizontal line width
input int      Trend_Line_Width=2;        // Trend line width

//+------------------------------------------------------------------+
//| Display styles                                                   |
//+------------------------------------------------------------------+
input string   Styles="=== Display styles ===";
input ENUM_LINE_STYLE      Vertical_With_Short_Levels_Style=STYLE_SOLID; // Vertical Line style
                                                                         // with levels
input ENUM_LINE_STYLE      Short_Level_Style=STYLE_SOLID;      // Short Level style
input ENUM_LINE_STYLE      Long_Level_Style=STYLE_SOLID;       // Long level style
input ENUM_LINE_STYLE      Short_Level_7_8_Style=STYLE_SOLID;  // Level 7/8 style
input ENUM_LINE_STYLE      Short_Level_14_8_Style=STYLE_DOT;   // Level 14/8 style
input ENUM_LINE_STYLE      Simple_Vertical_Style=STYLE_DOT;    // Simple Vertical style
input ENUM_LINE_STYLE      Simple_Horizontal_Style=STYLE_DOT;  // Simple Horizontal style
input ENUM_LINE_STYLE      VFun_Levels_Style=STYLE_SOLID;      // Fan Style
input ENUM_LINE_STYLE      Trend_Line_Style=STYLE_SOLID;       // Trend line style
//---
input ENUM_LINE_STYLE      Pitchfork_Main_Style = STYLE_SOLID;    // Andrews' Pitchfork style
input ENUM_LINE_STYLE      Pitchfork_Shiff_Style = STYLE_SOLID;   // Schiff Pitchfork style
input ENUM_LINE_STYLE      Pitchfork_Reverce_Style = STYLE_SOLID; // Reverse Pitchfork style
//+------------------------------------------------------------------+
//| Pitchfork extrema parameters                                     |
//+------------------------------------------------------------------+
input string               Pitchforks="=== Pitchfork Extrema Parameters ===";
//---
input int                  Pitchfork_First_Point_Left_Bars=6;   // Pitchfork - 1st point, bars on the left
input int                  Pitchfork_First_Point_Right_Bars=6;  // Pitchfork - 1st point, bars on the left
//---
input int                  Pitchfork_Second_Point_Left_Bars=6;  // Pitchfork - 2nd point, bars on the left
input int                  Pitchfork_Second_Point_Right_Bars=6; // Pitchfork - 2nd point, bars on the right
//---
input int                  Pitchfork_Third_Point_Left_Bars=6;   // Pitchfork - 3rd point, bars on the left
input int                  Pitchfork_Third_Point_Right_Bars=2;  // Pitchfork - 3rd point, bars on the right
//+------------------------------------------------------------------+
//| Other parameters                                                 |
//+------------------------------------------------------------------+
input string               Others="=== Other Parameters ===";
input double               Vertical_Short_Level_Coefficient=0.825;  // Coefficient of vertical levels
input double               Long_Level_Multiplicator=2;              // Multiplier for the long level
input int                  Trend_Length_Coefficient=4;              // Coefficient for the trend line length
input bool                 Is_Trend_Ray=false;                      // Trend line - ray
input bool                 Is_Change_Timeframe_On_Create = true;    // Hide objects on higher timeframes?
                                                                    //   (true - hide, false - show)
input bool                 Is_Select_On_Create=true;                // Select upon creation
input bool                 Is_Different_Colors=true;                // Change colors for times

// Number of bars on the left and on the right
// for trend line and fan extreme points
input int                  Fractal_Size_Left=1;                     // Size of the left fractal
input int                  Fractal_Size_Right=1;                    // Size of the right fractal

input bool                 Pitchfork_Show_Main = true;     // Display Andrews' pitchfork
input bool                 Pitchfork_Show_Shiff = true;    // Display Schiff pitchfork
input bool                 Pitchfork_Show_Reverce = true;  // Display "Reverse" pitchfork
input bool                 Print_Warning_Messages=true;    // Display error messages
input string               VFun_Levels="-1.5,-0.618,-0.236,"+
                                       "  0,0.236,0.382,"+
                                       "  0.618,0.786,0.886,0.942";  // Fan levels
input string               Array_Delimiter=",";            // Array elements separator
//---

//+------------------------------------------------------------------+
//| Name prefixes of drawn shapes (can be change only in code,       |
//| not visible in EA parameters)                                    |
//+------------------------------------------------------------------+
//string   Prefixes="=== Prefixes ===";
//string   Vertical_With_Short_Levels_Prefix="Vertical_";  // Prefix for vertical lines with levels
//string   Short_Level_Prefix="Short_Level_";              // Prefix for short levels
//string   Long_Level_Prefix="Long_Level_";                // Prefix for long levels
//string   Simple_Horizontal_Prefix="Simple_H_";           // Prefix for simple horizontal lines
//string   Simple_Vertical_Prefix="Simple_V_";             // Prefix for simple vertical lines
//string   VFan_Prefix="VFan_";                            // Prefix for fan
//string   Trend_Line_Prefix="Trend_";                     // Prefix for trend lines
//string   Pitchfork_Prefix="Pitchfork_";                  // Prefix for pitchfork
string   allPrefixes[] =      // Prefixes for object names
  {
   "Trend_",            // 0 - Prefix for trend lines
   "Simple_H_",         // 1 - Prefix for simple horizontal lines
   "Simple_V_",         // 2 - Prefix for simple vertical lines
   "VFan_",             // 3 - Prefix for fan
   "Pitchfork_",        // 4 - Prefix for pitchfork
   "Vertical_",         // 5 - Prefix for vertical lines with levels
   "Short_Level_",      // 6 - Prefix for short levels
   "Long_Level_"        // 7 - Prefix for long levels
  };

//+------------------------------------------------------------------+
//| Colors for objects of one timeframe (can be changed only in code,|
//| not visible in EA parameters)                                    |
//+------------------------------------------------------------------+
// string TimeframeColors="=== Standard Colors for Timeframes  ===";
color mn1_color=clrCrimson;
color w1_color=clrDarkOrange;
color d1_color=clrGoldenrod;
color h4_color=clrLimeGreen;
color h1_color=clrLime;
color m30_color=clrDeepSkyBlue;
color m15_color=clrBlue;
color m5_color=clrViolet;
color m1_color=clrDarkViolet;
color common_color=clrGray;

//--- Auxiliary constant for displaying error messages
#define DEBUG_MESSAGE_PREFIX "=== ",__FUNCTION__," === "

//--- Constants for describing the main timeframes when drawing
//--- For compatibility with version 4, timeframes that do not exist
//---    in the toolbar are excluded.
#define PERIOD_LOWER_M5 OBJ_PERIOD_M1|OBJ_PERIOD_M5
#define PERIOD_LOWER_M15 PERIOD_LOWER_M5|OBJ_PERIOD_M15
#define PERIOD_LOWER_M30 PERIOD_LOWER_M15|OBJ_PERIOD_M30
#define PERIOD_LOWER_H1 PERIOD_LOWER_M30|OBJ_PERIOD_H1
#define PERIOD_LOWER_H4 PERIOD_LOWER_H1|OBJ_PERIOD_H4
#define PERIOD_LOWER_D1 PERIOD_LOWER_H4|OBJ_PERIOD_D1
#define PERIOD_LOWER_W1 PERIOD_LOWER_D1|OBJ_PERIOD_W1
//+------------------------------------------------------------------+
All new additions compared to the previous version are highlighted in yellow. These new features allow configuring not only straight lines, but also other objects that appear on the screen.
I put the names of object prefixes in an array so that it would be more convenient to use them later. For example, I plan to add a function for deleting complex objects (say, vertical lines with levels). The array will be more convenient for such cases.
Now that we have considered the settings, we can proceed with graphics.
Drawing "primitives": vertical and horizontal lines
The first object that you may want to create is the level and time lines (infinite horizontal and vertical lines). Actually, the library began with these lines.
Here is the code:
//+------------------------------------------------------------------+
//| Draws simple straight lines (vertical and horizontal) in the     |
//| position specified by mouse or parameters                        |
//| Parameters:                                                      |
//|   _object_type - object type. Can be OBJ_VLINE or OBJ_HLINE      |
//|   _time - time.  If not specified, mouse time is used            |
//|   _price - price. If not specified, price under index is used.   |
//+------------------------------------------------------------------+
void              CGraphics::DrawSimple(
   ENUM_OBJECT _object_type, // Object type
   datetime    _time=-1,     // Time
   double      _price=-1     // Price
)
  {
//---
   string Current_Object_Name;   // The name of the future object
   color Current_Object_Color=   // Color (depends on the "standard" color of the timeframe)
      CUtilites::GetTimeFrameColor(CUtilites::GetAllLowerTimeframes());
   datetime Current_Object_Time; // Starting point time
   double Current_Object_Price;  // Starting point price
   ENUM_LINE_STYLE Current_Object_Style=STYLE_DOT; // Line style
   int Current_Object_Width=1;   // Line width
   int window=0;                 // Subwindow number

//--- Set up line parameters depending on the type
   if(_object_type==OBJ_VLINE)   // For vertical lines
     {
      Current_Object_Name=       // Generate the name
         CUtilites::GetCurrentObjectName(
            Simple_Vertical_Prefix,
            _object_type
         );
      // style - according to global parameters
      Current_Object_Style=Simple_Vertical_Style;
      // width - according to global parameters
      Current_Object_Width=Simple_Vertical_Width;
     }
   else
      if(_object_type==OBJ_HLINE)// For horizontal lines
        {
         Current_Object_Name=    // Generate the name
            CUtilites::GetCurrentObjectName(
               Simple_Horizontal_Prefix,
               _object_type
            );
         // style - according to global parameters
         Current_Object_Style=Simple_Horizontal_Style;
         // width - according to global parameters
         Current_Object_Width=Simple_Horizontal_Width;
        }
      else  // This function only draws horizontal and vertical lines.
        {
         // If something else is passed in parameters...
         if(Print_Warning_Messages)
           {
            // ...report an error...
            Print(DEBUG_MESSAGE_PREFIX,"Error, wrong object type");
           }
         // ...and exit.
         return;
        }

//--- If coordinates are not specified in the parameters, use the coordinates of the mouse
   Current_Object_Price = _price==-1 ? CMouse::Price() : _price;
   Current_Object_Time = _time==-1 ? CMouse::Time() : _time;

//--- Create the object
   ObjectCreate(
      0,
      Current_Object_Name,
      _object_type,
      0,
      Current_Object_Time,
      Current_Object_Price
   );

//--- Set display parameters for the created object
   CurrentObjectDecorate(
      Current_Object_Name,
      Current_Object_Color,
      Current_Object_Width,
      Current_Object_Style
   );

//--- Redraw the chart and complete
   ChartRedraw(0);
  }
The operations are very simple. Generate a name, take the settings from input variables described in the "GlobalVariables.mqh" file, get the coordinates of the starting point of the object (either from the function parameters or simply using the coordinates of the mouse) and the object is ready.
That is all!
Now we need to add this function to the file header
//+------------------------------------------------------------------+
//|                                                     Graphics.mqh |
//|                        Copyright 2020, MetaQuotes Software Corp. |
//|                            https://www.mql5.com/es/articles/7468 |
//+------------------------------------------------------------------+

// ...

//+------------------------------------------------------------------+
//| Class for plotting graphic objects                               |
//+------------------------------------------------------------------+
class CGraphics
  {

   // ...

public:

   // ...

   //--- Draws simple straight lines (vertical and horizontal)
   void              CGraphics::DrawSimple(
      ENUM_OBJECT _object_type, // Object type
      datetime    _time=-1,     // Time
      double      _price=-1     // Price
   )

   // ...
  }
;
//+------------------------------------------------------------------+
Also, add handling for corresponding key press:
//+------------------------------------------------------------------+
//|                                                    Shortcuts.mqh |
//+------------------------------------------------------------------+

// ...

//+------------------------------------------------------------------+
//| Event handling function                                          |
//+------------------------------------------------------------------+
void CShortcuts::OnChartEvent(
   const int id,
   const long &lparam,
   const double &dparam,
   const string &sparam
)
  {
//---
   int window = 0;
//---
   switch(id)
     {

      // ...

      //--- Handle keystrokes
      case CHARTEVENT_KEYDOWN:

         // ...

         //--- Draw a simple vertical line
         if(CUtilites::GetCurrentOperationChar(Simple_Vertical_Line_Key) == lparam)
           {
            m_graphics.DrawSimple(OBJ_VLINE);
           }
         //--- Draw a simple horizontal line
         if(CUtilites::GetCurrentOperationChar(Simple_Horizontal_Line_Key) == lparam)
           {
            m_graphics.DrawSimple(OBJ_HLINE);
           }

         // ...

         break;
         //---

     }
  }
In the future, in order to save the screen space and to focus on the main ideas, I will not write header entries when adding function descriptions, I will show appropriate lines (highlighted in yellow) for newly added commands.
The result of all additions and compilation is very simple: two commands that draw graphic primitives anywhere in the current window:

The default key shortcuts for these lines are "I" (i) and "H" (h).
Do not forget, that the color of created objects will be different, depending on the current timeframe. And objects from lower times are not displayed on higher times (with default settings).


For compatibility with MQL4, we use only timeframes from the standard toolbar, which are displayed by default. These timeframes can be selected if you scroll through them using "U" and "D" keys (pressing these keys changes the chart period one timeframe up or down; please see the CUtilites::ChangeTimeframes function).
VFun, or Fibonacci Fan
The next shape is the Fibonacci fan. I use it quite often. But it was very inconvenient to remember all its rays every time have to use a different terminal. Therefore, I decided to add this tool to my wonderful EA.
I developed the idea further and decided to implement a universal function which can set Fibonacci levels for any object (fan channel or horizontal Fibo levels) drawn using the library. Here is the function.
//+------------------------------------------------------------------+
//| Sets level values and form in any Fibonacci object               |
//|    Uses colors and styles from the class fields                  |
//| Parameters:                                                      |
//|    _object_name - the name of the Fibonacci object               |
//|    _levels_values[] - array of level values                      |
//+------------------------------------------------------------------+
void CGraphics::SetFiboLevels(
   string _object_name,                      // Object name
   const double &_levels_values[]            // Array of values
)
  {
   int i,                                      // Current level counter
       levels_count=ArraySize(_levels_values); // Total number of levels

//--- Check if the number of values in the array exceeds the allowed range
   if(levels_count>32 || levels_count==0)
     {
      Print(DEBUG_MESSAGE_PREFIX,": Levels cannot be set! Data array is incorrectly. ");
      return;
     }

//--- Proceed with the implementation

//--- Set the number of levels for the current object
   ObjectSetInteger(0,_object_name,OBJPROP_LEVELS,levels_count);
//--- Set value, color and style for each level.
   for(i=0; i<levels_count; i++)
     {
      ObjectSetDouble(0,_object_name,OBJPROP_LEVELVALUE,i,_levels_values[i]);
      ObjectSetInteger(0,_object_name,OBJPROP_LEVELCOLOR,i,m_Fibo_Default_Color);
      ObjectSetInteger(0,_object_name,OBJPROP_LEVELSTYLE,i,m_Fibo_Default_Style);
     }
//--- Redraw the chart before finishing
   ChartRedraw(0);
  }
The passed function parameters include the name of the object for which the levels are set and the array of all level values.
First, the function checks the number of passed levels. If the array is too large, then the function assumes that an error has occurred and does nothing. It also exits if the array has no elements.
Well, if everything is ok and the number of elements in the array does not exceed the allowed range, then we start adding the levels. The name of the object is specified in the parameters, so we simply set the corresponding property of the object equal to the number of array elements, and iterate over the entire array while setting the appropriate levels.
MQL5 also allows setting different parameters to different levels. For example, we can set different colors. Also we can use different styles (solid, dashed, and so on. MQL4 does not provide such options. Nevertheless, I have added to the loop the lines that define level colors and styles. They do not affect compilation while adding universality in MQL5.
The variables describing the default parameters are described as private members of the CGraphics class and are initialized in the class constructor with the values from the EA parameters.
//+------------------------------------------------------------------+
//|                                                     Graphics.mqh |
//+------------------------------------------------------------------+
//+------------------------------------------------------------------+
//| Class for plotting graphic objects                               |
//+------------------------------------------------------------------+
class CGraphics
  {
   //--- Fields
private:
   // ...
   color             m_Fibo_Default_Color;
   ENUM_LINE_STYLE   m_Fibo_Default_Style;
   // ...
//+------------------------------------------------------------------+
//| Default constructor                                              |
//+------------------------------------------------------------------+
CGraphics::CGraphics(void)
  {
   //...
   m_Fibo_Default_Color = Fibo_Default_Color;
   m_Fibo_Default_Style = VFun_Levels_Style;
  }
   // ...
For those who do not care about compatibility, I have added an override of this function. It allows setting parameters for each level using arrays passed in the function parameters. I think everything is clear from the code. If you need further explanation, please write an appropriate comment. The function override is enabled in the attached zip.
Here is another function that sets level descriptions for any Fibonacci object.
//+------------------------------------------------------------------+
//| Sets descriptions of levels in any Fibonacci object              |
//|    _object_name - the name of the Fibonacci object               |
//|    _levels_descriptions[] - array of level descriptions          |
//+------------------------------------------------------------------+
void CGraphics::SetFiboDescriptions(
   string _object_name,                  // Object name
   const string &_levels_descriptions[]  // Array of descriptions
)
  {
   int i,                                                                  // Current level counter
       levels_count=(int)ObjectGetInteger(0,_object_name,OBJPROP_LEVELS),  // The real number of levels
       array_size=ArraySize(_levels_descriptions);                         // The number of received descriptions
//--- Loop  through all levels
   for(i=0; i<levels_count; i++)
     {
      if(array_size>0 && i<array_size) // Choose a description from the array
        {
         //--- and write it to the level
         ObjectSetString(0,_object_name,OBJPROP_LEVELTEXT,i,_levels_descriptions[i]);
        }
      else // If the descriptions are not enough,
        {
         ObjectSetString(0,_object_name,OBJPROP_LEVELTEXT,i,""); // leave the description empty
        }
     }
//--- Redraw the chart before finishing
   ChartRedraw(0);
  }
There is nothing complicated here. The only condition is that by the time this function is called, the object levels must have already been set. And the function will simply loop through these levels and will assign a corresponding value from the array to the description of each of them. If data in the array is not enough, some of the levels will remain without a description.
And now, when adding a level has become easy, we can write the function that adds a Fibonacci fan.
//+------------------------------------------------------------------+
//| Draws a Fibonacci fan from the nearest local extremum.           |
//+------------------------------------------------------------------+
void CGraphics::DrawVFan(void)
  {
//---
   double levels_values[];                 // Array of level values
   string levels_descriptions[] = {};      // Array of level descriptions
   int p1=0,                               // Bar number for the fan starting point
       p2=0;                               // Bar number for the fan ending point
   double price1=0,                        // First point price
          price2=0;                        // Second point price
   string fun_name =                       // Fan name
      CUtilites::GetCurrentObjectName(allPrefixes[3],OBJ_FIBOFAN),
      fun_0_name =
         CUtilites::GetCurrentObjectName(allPrefixes[3]+"0_",OBJ_TREND);

//--- Get data for the fan from the parameter string
   CUtilites::StringToDoubleArray(VFun_Levels,levels_values);

//--- Find the extreme points closest to the mouse
   if(CMouse::Below())     // If the mouse cursor is below the price
     {
      CUtilites::SetExtremumsBarsNumbers(false,p1,p2);
      price1=iLow(Symbol(),PERIOD_CURRENT,p1);
      price2=iLow(Symbol(),PERIOD_CURRENT,p2);
     }
   else
      if(CMouse::Above())  // If the mouse cursor is above the price
        {
         CUtilites::SetExtremumsBarsNumbers(true,p1,p2);
         price1=iHigh(Symbol(),PERIOD_CURRENT,p1);
         price2=iHigh(Symbol(),PERIOD_CURRENT,p2);
        }
//--- Create the fan object
   ObjectCreate(
      0,fun_name,OBJ_FIBOFAN,0,
      iTime(Symbol(),PERIOD_CURRENT,p1),
      price1,
      iTime(Symbol(),PERIOD_CURRENT,p2),
      price2
   );

//--- The zero ray of this object is denoted by a colored line (for compatibility with MT4)
   TrendCreate(
      0,
      fun_0_name,
      0,
      iTime(Symbol(),PERIOD_CURRENT,p1),
      price1,
      iTime(Symbol(),PERIOD_CURRENT,p2),
      price2,
      CUtilites::GetTimeFrameColor(CUtilites::GetAllLowerTimeframes()),
      0,1,false,true,true
   );

//--- Describe the fan levels
   SetFiboLevels(fun_name,levels_values);
   SetFiboDescriptions(fun_name, levels_descriptions);

//--- Set standard parameters (such as timeframes and selection after creation)
   CurrentObjectDecorate(fun_name,m_Fibo_Default_Color);
//--- Also make out the "substitute" ray
   CurrentObjectDecorate(
      fun_0_name,
      CUtilites::GetTimeFrameColor(
         CUtilites::GetAllLowerTimeframes()
      )
   );

//---
   ChartRedraw(0);
  }
I think it is convenient when the ray from which the fan is formed has a different color. To implement this ability in MQL4, we have to draw a regular straight line over the fan, as in the previous article.
In this case, we do not need level captions, so I simply use an empty array.
The array of values is created from the EA parameters using the utility function
CUtilites::StringToDoubleArray(VFun_Levels,levels_values);
This utility that converts a string to an array of numbers, was described in the first article.
Add a fan drawing command to the list of command descriptions:
//+------------------------------------------------------------------+
//|                                                   Shortcuts.mqhh |
//+------------------------------------------------------------------+

   //...
//--- Draw a Fibonacci fan (VFun)
         if(CUtilites::GetCurrentOperationChar(VFun_Key) == lparam)
           {
            m_graphics.DrawVFan();
           }
         break;
   //...
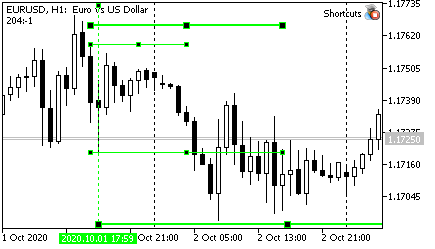
Compile and check the result. Open the terminal and open the desired chart.
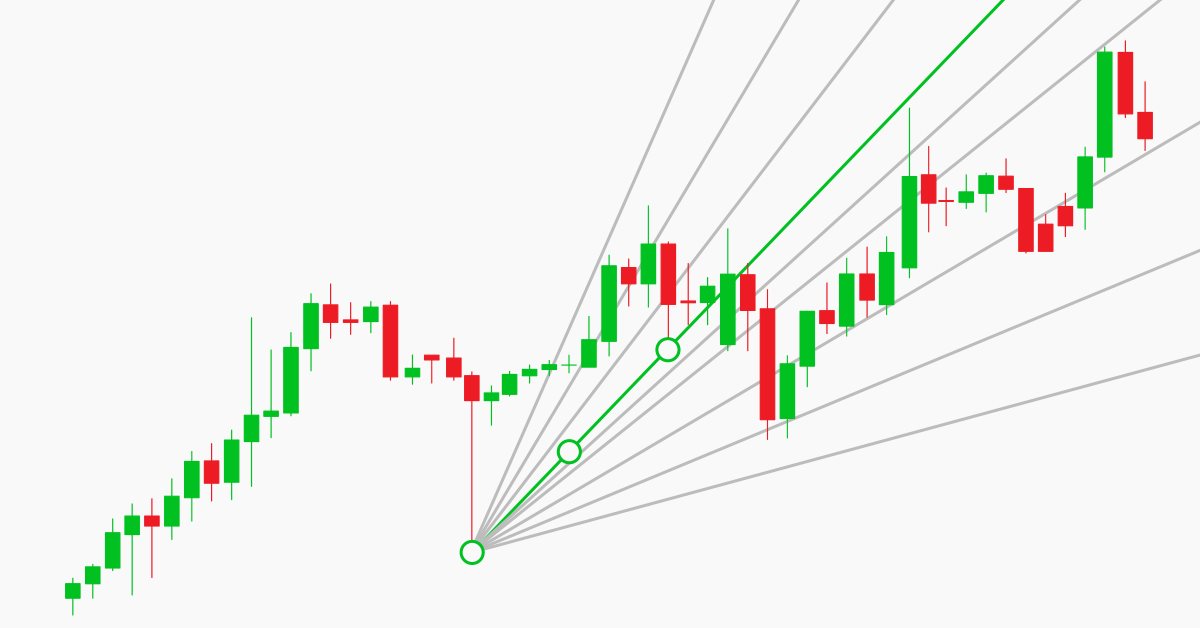
Move the mouse from the top or from the bottom of the chart, to the left of the basic extremum, and then press "F".
")
By the way, looking at the configuration of this particular fan, I assumed that the price could go down very soon.
And the price eventually went down.
")
Andrews' Pitchfork
I use 3 types of pitchfork.
First, I choose the required extrema and draw "regular" pitchfork. The points of the pitchfork are right at the extreme price values.

The second type of pitchfork described by Andrews' is the Schiff pitchfork. Here, point 1 is offset by half the distance 1-2 in trend direction. Accordingly, the slope of the center line is smaller. If the movement fits into these pitchforks, the movement is most probably flat, so the price is in a "corrective" movement.

The third type is the "reverse" pitchfork. Point 1 is offset in a counter-trend direction by the same 1-2 distance. This pitchfork type is used for fast movements. Usually they are shorter in time, but they make a greater price distance.

In practical analysis, I like to have all the three types of pitchfork on the chart at the same time. In this case, the price movement, along with the key points of probable future extrema, is much clearer.

Two functions are used to draw such a set. The first is the function that draws one pitchfork of any type.
//+------------------------------------------------------------------+
//| Creates Andrews' pitchfork using specified coordinates           |
//| Parameters:                                                      |
//|    _name - the name of created pitchfork                         |
//|    _base - the structure containing coordinates of  basic points |
//|    _type - pitchfork type (SIMPLE,SHIFF,REVERCE)                 |
//+------------------------------------------------------------------+
void  CGraphics::MakePitchfork(
   string _name,           // The name of the created object
   PitchforkPoints &_base, // Structure describing pitchfork base points
   PitchforkType _type     // Pitchfork type (SIMPLE,SHIFF,REVERCE)
)
  {
//---
   double price_first;                 // The price of the first point (depends on the type)
   color pitchfork_color;              // Pitchfork color (depends on the type)
   int pitchfork_width;                // Line width (depends on the type)
   ENUM_LINE_STYLE pitchfork_style;    // Line style (depends on the type)
   double fibo_levels[] = {1};         // Add external levels (only for MQL5)
   string fibo_descriptions[] = {""};  // Level description (only for MQL5)

//--- Set type dependent parameters:
   if(_type == SHIFF)      // Schiff pitchfork
     {
      price_first = _base.shiffMainPointPrice;
      pitchfork_color = Pitchfork_Shiff_Color;
      pitchfork_width = Pitchfork_Shiff_Width;
      pitchfork_style = Pitchfork_Shiff_Style;
     }
   else
      if(_type == REVERCE) // "Reverse" pitchfork
        {
         price_first = _base.reverceMainPointPrice;
         pitchfork_color = Pitchfork_Reverce_Color;
         pitchfork_width = Pitchfork_Reverce_Width;
         pitchfork_style = Pitchfork_Reverce_Style;
        }
      else
        {
         // "classic" pitchfork
         price_first =_base.mainPointPrice;
         pitchfork_color = Pitchfork_Main_Color;
         pitchfork_width = Pitchfork_Main_Width;
         pitchfork_style = Pitchfork_Main_Style;
        }

//--- Draw
   ObjectCreate(0,_name,OBJ_PITCHFORK,0,
                _base.time1,price_first,
                _base.time2,_base.secondPointPrice,
                _base.time3,_base.thirdPointPrice
               );
//--- Set the parameters common for all graphical objects
   CurrentObjectDecorate(
      _name,
      pitchfork_color,
      pitchfork_width,
      pitchfork_style
   );
//--- If MQL5
#ifdef __MQL5__
//--- add external levels (early levels for Andrews' pitchfork)
   SetFiboLevels(_name,fibo_levels);
   SetFiboDescriptions(_name,fibo_descriptions);
#endif

//--- Update the chart picture
   ChartRedraw(0);
  }
The second function calculates the coordinates of points 1, 2, and 3 (base) for the created pitchfork and sequentially starts drawing of all three objects. The pitchfork is drawn based on this function, using the above CGraphics::MakePitchfork function.
//+------------------------------------------------------------------+
//| Draws set of Andrews' pitchforks on one base. The set includes   |
//|    three pitchfork types: regular, Schiff and reverse Schiff     |
//|    (aka "micmed channel")                                        |
//+------------------------------------------------------------------+
void CGraphics::DrawPitchforksSet(void)
  {
   bool up=true;                             // direction (mouse below or above the price)
   double dropped_price = CMouse::Price();   // "Starting point" price
   int dropped_bar = CMouse::Bar();          // Starting point bar number
   string name = "";                         // The name of the current object
   PitchforkPoints base;                     // Structure for the base coordinates
//---
   if(CMouse::Below())
     {
      up=false;
     }
   else
     {
      if(!CMouse::Above()) // If the mouse pointer is on the candlestick, do nothing
        {
         if(Print_Warning_Messages)
           {
            Print(DEBUG_MESSAGE_PREFIX,": Set a point above or below the bar extreme price");
           }
         return;
        }
     }
//--- Find extremum bar numbers
   int bar_first = CUtilites::GetNearestExtremumBarNumber(
                      dropped_bar,
                      true,
                      up,
                      Pitchfork_First_Point_Left_Bars,
                      Pitchfork_First_Point_Right_Bars
                   );
   int bar_second = CUtilites::GetNearestExtremumBarNumber(
                       bar_first-1,
                       true,
                       !up,
                       Pitchfork_Second_Point_Left_Bars,
                       Pitchfork_Second_Point_Right_Bars
                    );
   int bar_third = CUtilites::GetNearestExtremumBarNumber(
                      bar_second-1,
                      true,
                      up,
                      Pitchfork_Third_Point_Left_Bars,
                      Pitchfork_Third_Point_Right_Bars
                   );
//--- If not found, report an error
   if(bar_first<0||bar_second<0||bar_third<0)
     {
      if(Print_Warning_Messages)
        {
         Print(DEBUG_MESSAGE_PREFIX,": Could not find points that match all conditions.");
        }
      return;
     }

//--- Fill the structure for basic control points
   base.mainPointPrice = up ?                               // Price - first basic point
                         iHigh(Symbol(),PERIOD_CURRENT,bar_first)
                         : iLow(Symbol(),PERIOD_CURRENT,bar_first);
   base.secondPointPrice = up ?                             // Price - second basic point
                           iLow(Symbol(),PERIOD_CURRENT,bar_second)
                           : iHigh(Symbol(),PERIOD_CURRENT,bar_second);
   base.thirdPointPrice = up ?                              // Price - third basic point
                          iHigh(Symbol(),PERIOD_CURRENT,bar_third)
                          : iLow(Symbol(),PERIOD_CURRENT,bar_third);
   base.shiffMainPointPrice = base.mainPointPrice-          // Price - first point of Schiff pitchfork
                              (base.mainPointPrice-base.secondPointPrice)/2;
   base.reverceMainPointPrice = base.mainPointPrice+        // Price - first point of "reverse" pitchfork
                                (base.mainPointPrice-base.secondPointPrice)/2;
   base.time1 = iTime(Symbol(),PERIOD_CURRENT,bar_first);   // Time of the first point
   base.time2 = iTime(Symbol(),PERIOD_CURRENT,bar_second);  // Time of the second point
   base.time3 = iTime(Symbol(),PERIOD_CURRENT,bar_third);   // Time of the third point


//--- Draw "regular" pitchfork
   if(Pitchfork_Show_Main)
     {
      name =CUtilites::GetCurrentObjectName(allPrefixes[4]+"_main",OBJ_PITCHFORK);
      MakePitchfork(name,base,SIMPLE);
     }

//--- Draw Schiff pitchfork
   if(Pitchfork_Show_Shiff)
     {
      name =CUtilites::GetCurrentObjectName(allPrefixes[4]+"_shiff",OBJ_PITCHFORK);
      MakePitchfork(name,base,SHIFF);
     }

//--- Draw "reverse" pitchfork
   if(Pitchfork_Show_Reverce)
     {
      name =CUtilites::GetCurrentObjectName(allPrefixes[4]+"_reverce",OBJ_PITCHFORK);
      MakePitchfork(name,base,REVERCE);
     }
//---
//ChartRedraw(0); not needed here as it is called when drawing each object
  }
I use the following enumeration to describe pitchfork types:
//+------------------------------------------------------------------+
//| Possible Andrews' pitchfork types                                 |
//+------------------------------------------------------------------+
   enum PitchforkType
     {
      SIMPLE,
      SHIFF,
      REVERCE
     };
I have added a structure for the points (PitchforkPoints base;) in order to pass fewer parameters to it when calling a drawing function.
//+------------------------------------------------------------------+
//|  Structure describing a "base" for the Andrews' pitchfork        |
//+------------------------------------------------------------------+
   struct PitchforkPoints
     {
      double            mainPointPrice;        // Price - first base point
      double            shiffMainPointPrice;   // Price - second base point
      double            reverceMainPointPrice; // Price - third base point
      double            secondPointPrice;      // Price - first point of Schiff pitchfork
      double            thirdPointPrice;       // Price - first point of "reverse" pitchfork
      datetime          time1;                 // Time of the first point
      datetime          time2;                 // Time of the second point
      datetime          time3;                 // Time of the third point
     };
Finally, add a description of the reaction to the control key in the "Shortcuts.mqh" file:
//+------------------------------------------------------------------+
//|                                                   Shortcuts.mqhh |
//+------------------------------------------------------------------+

   //...
//--- Draw Andrews' Pitchfork
         if(CUtilites::GetCurrentOperationChar(Pitchfork_Key) == lparam)
           {
            m_graphics.DrawPitchforksSet();
           }
         break;
   //...
Compile and check.
To display a pitchfork set on the chart, press the "P" key (Pitchfork).
Trend Line Drawing Features in MetaTrader
Generally, the above described objects can be used for any graphics. The functionality has straight lines, Andres pitchfork, Fibonacci fan, horizontal and vertical levels.
Similarly, by finding extreme points to the right or to the left of the mouse, we can draw channels, horizontal Fibonacci levels, and so on. If you often use these shapes, you can easily implement the required functionality.
For me, the most difficult part of this library concerned the straight lines having an endpoint to the right and a second point in the future.
Such lines are very convenient for marking significant levels, both by price and by time. As a rule, the price notices these levels and forms at least a local extremum somewhere nearby; very often the price reverses.
But it turned out that the line drawing function in MetaTrader uses price and time.
The first problem occurs when lines are drawn on Friday and its right edge is on Monday.

On Friday, MetaTrader thinks that there must be Sunday, but then it understands on Monday, that it could not trade on that day and therefore two days must be discarded. Due to this, a line drawn by time coordinates will be shorter. This is clearly seen in the figure above.
If I need to measure a certain number of bars on the chart, this behavior is inconvenient.
The solution is quite simple: the date can be calculated not by the calendar, but by points. Mouse coordinates show a point on the chart; the distance between candlesticks can always be calculated (for example, as described in the first part, in the section "Distance between adjacent bars (in pixels)"), and then we only need to count to the right the required number of candlesticks and to convert the screen coordinates into time and price using the standard ChartXYToTimePrice function. But such a straight line should be drawn on Monday, not on Friday, in order to avoid the "Sunday collapse".
The method seems good but there is one but. The size of the space on which MetaTrader can draw a line is limited. If you try to draw a line larger than the space allowed by the program (for example, very close to the border, as in the left figure), then the effects can be very unexpected.
The right figure shows the same line drawn automatically, but now the chart is shifted to the right to show the right edge. Below is a normal line which should have been on this scale. Judging by the upper line properties, its right endpoint has gone ahead by almost six months!
Sometimes, with a sloping line, I saw how the line reversed in the opposite direction. MetaTrader could not convert the coordinates of the point to the correct date and simply set it to 0 (accordingly, the date was January 1, 1970). This effect never happens if the line is drawn by dates.
Conclusion: we need a function that calculates dates in an as yet undefined future, allowing easy drawing of straight lines.
So, let us create such a function.
Function for Getting a Future Date
Usually there is some point in the present or in the past, from which we want to measure something (for example, some kind of extremum). In addition, we usually either know the shift distance in bars, or we can easily calculate it. So, the most common task for this function will be to calculate the time relative to some point based on a shift in bars. However, I also like the effect of level lengthening/shortening depending on the scale. So, sometimes I want the function to calculate time by points, and not by bars.
Both the number of points and the number of bars are integers, therefore, the function needs some kind of feature in order to understand what exactly to do. Let us start with this feature.
//+------------------------------------------------------------------+
//|                                              GlobalVariables.mqh |
//+------------------------------------------------------------------+

//...
//+------------------------------------------------------------------+
//| The enumeration describes possible options for calculating the   |
//|   time of the next bar                                           |
//|      COUNT_IN_BARS - calculate date by the number of bars        |
//|      COUNT_IN_PIXELS - calculate date by the number of pixels    |
//+------------------------------------------------------------------+
enum ENUM_FUTURE_COUNT {
   COUNT_IN_BARS,    // By bars
   COUNT_IN_PIXELS   // By pixel
};
//...
All descriptions of enumerations and global variables are in the GlobalVariables.mqh file. The enumeration of possible options for choosing intervals for our future function should also be added to this file.
The function itself does not draw anything and has nothing to do with the mouse. So, it must be a utility.
//+------------------------------------------------------------------+
//|                                                     Utilites.mqh |
//+------------------------------------------------------------------+

//...
class CUtilites
  {
public:
//...
   //--- Calculates a date in the future relative to the start date with the _length interval, specified in pixels or bars
   static datetime          GetTimeInFuture(
      const datetime _start_time,                         // Reference time based on which the future bar is calculated
      const int _length,                                  // Interval length (in bars or pixels)
      const ENUM_FUTURE_COUNT _count_type=COUNT_IN_BARS   // Interval type (pixels or bars).
   );

//...

//+------------------------------------------------------------------+
//| The function tries to calculate date in the future using the     |
//|   screen x and y coordinates                                     |
//| If calculation is unsuccessful (time exceeds limits), calculates |
//|   time with an error: as a sum of dates excluding Sundays.       |
//| Parameters:                                                      |
//|   _current_time,              Source time,                       |
//|   _length,                    Interval length                    |
//|                                 (in bars or in pixels)           |
//|   _count_type=COUNT_IN_BARS   How interval length is measured.   |
//|      COUNT_IN_BARS - the interval is set in bars;                |
//|      COUNT_IN_PIXELS - the interval is set in pixels.            |
//| Returns:                                                         |
//|   Time in the future distant from the _current_time              |
//|      by an interval in pixels or bars (_length)                  |
//+------------------------------------------------------------------+
datetime CUtilites::GetTimeInFuture(
   const datetime _start_time,                         // Reference time based on which the future bar is calculated
   const int _length,                                  // Interval length (in bars or pixels)
   const ENUM_FUTURE_COUNT _count_type=COUNT_IN_BARS   // Interval type (pixels or bars).
)
  {
//---
   datetime
      future_time;      // Variable for result
   int
      bar_distance =  GetBarsPixelDistance(),   // Distance in pixels between two adjacent bars
      current_x,                                // The x coordinate of the starting point
      future_x,                                 // The x coordinate of the result
      current_y,                                // The y coordinate, does not affect the result; needed for the conversion function
      subwindow = 0;                            // Subwindow index
   double current_price;                        // Any initial price, does not affect the result


//--- Convert the time passed in parameters into the screen coordinate x
   ChartTimePriceToXY(0,subwindow,_start_time,CMouse::Price(),current_x,current_y);

//--- Calculate a point in the future in screen coordinates
   if(COUNT_IN_BARS == _count_type) // If the length is specified in bars,
     {
      // then the interval size should be converted to pixels.
      future_x = current_x + _length*bar_distance;
     }
   else // ... If the length is in pixels,
     {
      // use it as is
      future_x = current_x + _length;
     }

//--- Convert screen coordinates into time
   if(ChartGetInteger(0,CHART_WIDTH_IN_PIXELS)>=future_x) // If successful,
     {
      ChartXYToTimePrice(0,future_x,current_y,subwindow,future_time,current_price);  // convert the resulting value
     }
   else // Otherwise, if time cannot be calculated because it exceeds limits
     {
      future_time =        // Calculate time as usual, in seconds
         _start_time       // To the starting time
         +(                // add
            ((COUNT_IN_BARS == _count_type) ? _length : _length/bar_distance) // interval size in bars
            *PeriodSeconds()  // multiplied by the number of seconds in the current period
         );
     }
//--- Return the resulting value
   return future_time;
  }
However, it turned out that the function described in the previous version did not always produce a correct result. That is why I had to rewrite it. Everything turned out to be much simpler.
//+------------------------------------------------------------------+
//|                                                     Utilites.mqh |
//+------------------------------------------------------------------+
//...
//+------------------------------------------------------------------+
//| Calculates a distance in pixels between two adjacent bars        |
//+------------------------------------------------------------------+
int        CUtilites::GetBarsPixelDistance(void)
  {
//--- Calculate the distance
   return ((int)MathPow(2,ChartGetInteger(0,CHART_SCALE)));
  }
//...
Limited Horizontal Levels
I showed these levels in the previous section. It is a line of a certain length, which ideally does not depend on where you pointed the mouse. It is drawn from the point to which the mouse cursor is pointing. Therefore, a point should be selected a bit more carefully than, let's say, for a fan.
I want these levels to have a strictly defined (empirically) length in pixels. Then the line will cover different numbers of bars on different scales.
Also, I want to be able to write a normal line level and an extended one - all on the same scale.
Here's what got:
//+------------------------------------------------------------------+
//|                                                     Graphics.mqh |
//+------------------------------------------------------------------+

//+------------------------------------------------------------------+
//| Draws a horizontal level                                         |
//| Parameters:                                                      |
//|   _multiplicator - multiplier for determining the length         |
//|                of the larger level (how many times higher)       |
//+------------------------------------------------------------------+
//---
void CGraphics::DrawHorizontalLevel(
   double _multiplicator // Multiplier for the level length
)
  {
//--- Description of variables
   datetime p2_time;          // Time of point 2
   string Level_Name ="";     // Level name

//Color of the current line (equal to  the general color of the current time interval)
   color Level_Color=CUtilites::GetTimeFrameColor(CUtilites::GetAllLowerTimeframes());
   int window = 0;            // The index of the subwindow in which the line is drawn
   ENUM_LINE_STYLE Current_Style = STYLE_SOLID; // Line style
   int Current_Width=1;                         // Line width
   int level_length = 0;                        // Line length

//--- Get the length (in pixels)
   if(Short_Level_Length_In_Pixels)
     {
      // If EA parameters instruct to measure in pixels,
      level_length = Short_Level_Length_Pix; // ...Use the length from parameters
     }
   else
     {
      // Otherwise the number of candlesticks is specified in parameters
      level_length = Short_Level_Length * CUtilites::GetBarsPixelDistance();
     }

//--- Set level parameters
   if(_multiplicator>1) // If the level is extended
     {
      Level_Name = CUtilites::GetCurrentObjectName(allPrefixes[7]);
      Current_Style = Long_Level_Style;
      Current_Width = Long_Level_Width;
     }
   else                 // An if the level is short
     {
      Level_Name = CUtilites::GetCurrentObjectName(allPrefixes[6]);
      Current_Style = Short_Level_Style;
      Current_Width = Short_Level_Width;
     }

//--- Calculate real coordinates (price and time) for the second point
   p2_time = CUtilites::GetTimeInFuture(CMouse::Time(),level_length*_multiplicator,COUNT_IN_PIXELS);


//--- Draw a line using the known coordinates
   TrendCreate(0,
               Level_Name,
               0,
               CMouse::Time(),
               CMouse::Price(),
               p2_time,
               CMouse::Price(),
               Level_Color,
               Current_Style,
               Current_Width
              );
//---

   ChartRedraw(0);
  }
The first point is determined by the mouse pointer. When calculating the second point, the program first selects whether the line size should change with the chart scale change, and then it calculates the coordinates of the second point in pixels and recalculates them to price and time. (When you have a ready function, calculations are not very difficult).
Now we need to add control commands to the Shortcuts.mqh file:
//+------------------------------------------------------------------+
//|                                                    Shortcuts.mqh |
//+------------------------------------------------------------------+

// ...

//--- Draw a short limited level
         if(CUtilites::GetCurrentOperationChar(Short_Level_Key) == lparam)
           {
            m_graphics.DrawHorizontalLevel(1);
           }
//--- Draw an extended limited level
         if(CUtilites::GetCurrentOperationChar(Long_Level_Key) == lparam)
           {
            m_graphics.DrawHorizontalLevel(Long_Level_Multiplicator);
           }
// ...
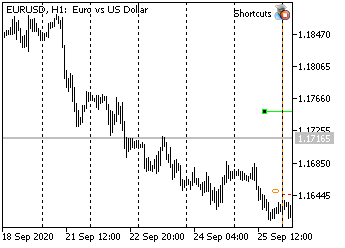
As a result, if the Short_Level_Length_In_Pixels parameter is true, then, when the S (Short) key is pressed, the program draws a horizontal segment with the length in pixels specified in the Short_Level_Length_Pix parameter.
If Short_Level_Length_In_Pixels == false, the level length is measured in candlesticks and is taken from the Short_Level_Length parameter.
If you press "L" (Long), the line length will double (will be multiplied by the number specified in the Long_Level_Multiplicator parameter).
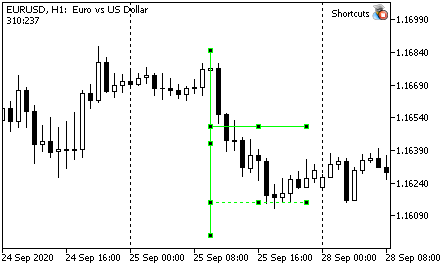
Limited Trend Line
I believe that a trend line can carry a double load.
On the one hand, it shows a limit on the rate of price change ("not faster", if the price is below the line, or "not slower", if the price is above the line).
On the other hand, if the straight line is limited in price and time (is not a ray), then it can indicate levels (both prices and time). Of course, we could use a rectangle or something else for these purposes, but a diagonal line is clearer, in my opinion.
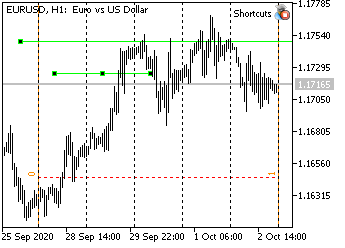
So, I have modified modify the CGraphics::DrawTrendLine function. First, the line now continues into the future for a limited amount of time, thus indicating the estimated price. Secondly, for clarity, I have added usual levels - horizontal and vertical.
It looks like this:

Of course, the length of the line (how many times the total length is greater than the distance between the initial points), the number of bars for extreme values and other features of the straight line are configured in the EA parameters.
//+------------------------------------------------------------------+
//|                                                     Graphics.mqh |
//+------------------------------------------------------------------+

//+------------------------------------------------------------------+
//| Draws a trend line using two nearest extreme points.             |
//|   Extremum length (number of bars on left and right) is set      |
//|   by parameters Fractal_Size_Left and Fractal_Size_Right         |
//|                                                                  |
//| There is a "Trend_Points" variable in the global parameters.     |
//|                                                                  |
//| If the variable value is equal to "TREND_DOTS_EXTREMUMS",        |
//|   end points of the straight line will lie strictly at extrema.  |
//| If the values is "TREND_DOTS_HALF", the line will be             |
//|   extended into the future by a distance of                      |
//|   (p2-p1)*Trend_Length_Coefficient                               |
//+------------------------------------------------------------------+
void              CGraphics::DrawTrendLine(void)
  {
   int dropped_bar_number=CMouse::Bar(); // candlestick number under the mouse
   int p1=0,p2=0;                        // numbers of the first and seconds points
   string trend_name =                   // trend line name
      CUtilites::GetCurrentObjectName(allPrefixes[0],OBJ_TREND);
   double
      price1=0,   // price of the first point
      price2=0,   // price of the second point
      tmp_price;  // variable for temporary storing of the price
   datetime
      time1=0,    // time of the first point
      time2=0,    // time of the second point
      tmp_time;   // a variable to store time


//--- Setting initial parameters
   if(CMouse::Below()) // If a mouse cursor is below the candlestick Low
     {
      //--- Find two extreme points below
      CUtilites::SetExtremumsBarsNumbers(false,p1,p2);

      //--- Determine point prices by Low
      price1=iLow(Symbol(),PERIOD_CURRENT,p1);
      price2=iLow(Symbol(),PERIOD_CURRENT,p2);
     }
   else // otherwise
      if(CMouse::Above()) // If a mouse cursor is below the candlestick High
        {
         //--- Find two extreme points above
         CUtilites::SetExtremumsBarsNumbers(true,p1,p2);

         //--- Determine point prices by High
         price1=iHigh(Symbol(),PERIOD_CURRENT,p1);
         price2=iHigh(Symbol(),PERIOD_CURRENT,p2);
        }
      else
        {
         return;
        }
//--- The time of the first and second points does not depend on the direction
   time1=iTime(Symbol(),PERIOD_CURRENT,p1);
   time2=iTime(Symbol(),PERIOD_CURRENT,p2);

//--- If the line should be extended to the right
   if(Trend_Points == TREND_POINTS_HALF)
     {
      //--- Temporarily save the coordinates of point 2
      tmp_price = price2;
      tmp_time = time2;

      //--- Calculate the time of the second point
      time2 = CUtilites::GetTimeInFuture(time1,(p1-p2)*Trend_Length_Coefficient);

      //--- Calculate the price of the second point
      price2 = NormalizeDouble(price1 + (tmp_price - price1)*Trend_Length_Coefficient,Digits());

      //--- Draw boundary levels by price and time
      DrawSimple(OBJ_HLINE,time2,price2);
      DrawSimple(OBJ_VLINE,time2,price2);
     }

//--- Draw the line
   TrendCreate(0,trend_name,0,
               time1,price1,time2,price2,
               CUtilites::GetTimeFrameColor(CUtilites::GetAllLowerTimeframes()),
               0,Trend_Line_Width,false,true,m_Is_Trend_Ray
              );

//--- Redrawing the chart
   ChartRedraw(0);
  }
Other changes in the code are highlighted in yellow.
The rest is simple. The number of bars between the points is equal to (р1-р2) (do not forget that the bar numbers increase to the right). A coefficient allows calculating by how much an interval should be extended. Then simply call the utility function, even without specifying the third parameters, as it allows the calculation in bars by default.
Then calculate the price, draw the levels using the previously described DrawSimple function, which is in the same class, and draw the main line.
A beginner may ask: "How does the function "know" where the price should be added: up or down? If the line goes from top to bottom, then the price should be subtracted, and if it goes from bottom upwards, then the price should be added."
Please note that since it is not important for us whether we are linked to lows or to highs (we have already checked this at the beginning of the function), the direction is uniquely determined by the expression price1 + (tmp_price - price1).
If the line goes downwards, then price1 will be more than the price of the second point, and, therefore, the expression (tmp_price - price1) will be negative. Thus, the required distance will be deducted from the price.
If the line goes upwards, then the price defining the second point will be greater than the first one, and the expression in brackets will be positive, so the distance will be added to the initial price.
I would like to mention one more feature of this function; this is an explanation for beginners. If a function calculates prices, then the data must be normalized. That is, we need to make sure that the received number has the same number of decimal places as the quotes on the chart. Otherwise, an error will occur. The NormalizeDouble function is used for normalizing prices.
No changes are required in the Shortcuts.mqh file. The line is drawn by pressing the "T" key (Trend). So, the above function should be called to draw the line.
//+------------------------------------------------------------------+
//|                                                    Shortcuts.mqh |
//+------------------------------------------------------------------+

//...
//--- Draw a trend line
         if(CUtilites::GetCurrentOperationChar(Trend_Line_Key) == lparam)
           {
            m_graphics.DrawTrendLine();
           }
//...
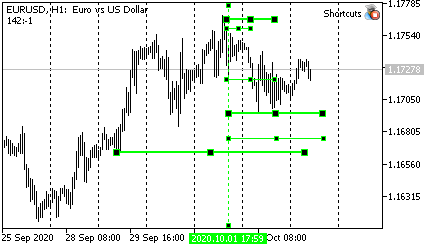
Drawing vertical levels
Since the markets have a trending nature and the price movement is not entirely random, most often the following rule can be used for trading: the price always tends to move by the same distance that it has already passed. The direction of the movement is a separate question. Often, after breaking through, say, the edge of a pin bar or some large candlestick, the price moves the same distance that was measured by this bar, and then reverses.
Nevertheless, many big traders (who might ultimately determine the direction) prefer to exit a position a little earlier than the 100% level is reached. Thus, the price often does not reach the popular levels.
Therefore, I also use fractional levels for trading. The most frequently used one is the level of 7/8. The last tool which we are going to consider in this article is designed to display these levels on the screen.
Now the function that draws the levels should be easy to understand.
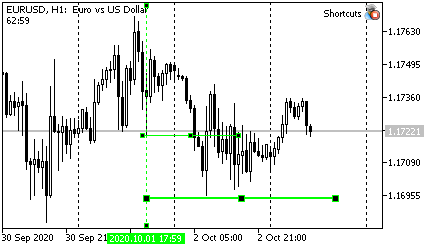
//+------------------------------------------------------------------+
//|                                                     Graphics.mqh |
//+------------------------------------------------------------------+

//+------------------------------------------------------------------+
//| Draws a vertical line at levels 7/8 and 14/8 of the              |
//|   current candlestick size                                       |
//+------------------------------------------------------------------+
void CGraphics::DrawVerticalLevels(void)
  {
//--- Description of variables
   string
   Current_Vertical_Name =   // The name of the basic vertical line
      CUtilites::GetCurrentObjectName(allPrefixes[5]),
      Current_Level_Name =          // The name of the current level
         CUtilites::GetCurrentObjectName(allPrefixes[5]+"7_8_");
   double
   Current_Line_Lenth,           // The length of the current line (level or vertical)
   Current_Extremum,             // Working extremum (High or Low, depending on the mouse position
   Level_Price,                  // Level price
   High = iHigh(Symbol(),PERIOD_CURRENT,CMouse::Bar()), // The High price of the current candlestick
   Low =  iLow(Symbol(),PERIOD_CURRENT,CMouse::Bar());  // The Low price of the current candlestick
   int
   direction=0;                  // Price increment sign
   long timeframes;                 // List of working timeframes
   datetime
   Current_Date =                // Time of the current bar
      iTime(Symbol(),PERIOD_CURRENT,CMouse::Bar()),
      Right_End_Time =              // Time of the right border of the level
         CUtilites::GetTimeInFuture(Current_Date,Short_Level_Length);

//--- Calculating candlestick length
   Current_Line_Lenth = (High-Low)*2;

//--- Initialization of the main variables depending on the desired drawing direction
   if(CMouse::Above()) // If the mouse is above
     {
      Current_Extremum = High;   // The main price is High
      direction = -1;            // Drawing direction - downward
     }
   else              // Otherwise
     {
      if(CMouse::Below()) // If the mouse is below
        {
         Current_Extremum = Low; // The main price is Low
         direction = 1;          // Drawing direction is upward
        }
      else         // If the mouse is in the middle of the candlestick, exit
        {
         return;
        }
     }

//--- Vertical line
   TrendCreate(0,
               Current_Vertical_Name,
               0,
               Current_Date,
               Current_Extremum,
               Current_Date,
               Current_Extremum+(Current_Line_Lenth*2)*direction,
               CUtilites::GetTimeFrameColor(CUtilites::GetAllLowerTimeframes()),
               Vertical_With_Short_Levels_Style,
               Vertical_With_Short_Levels_Width
              );
//--- First level (7/8)
   Level_Price = Current_Extremum+(Current_Line_Lenth*Vertical_Short_Level_Coefficient)*direction;
   TrendCreate(0,
               Current_Level_Name,
               0,
               Current_Date,
               Level_Price,
               Right_End_Time,
               Level_Price,
               CUtilites::GetTimeFrameColor(CUtilites::GetAllLowerTimeframes()),
               Short_Level_7_8_Style,
               Short_Level_7_8_Width
              );
//--- Second level (14/8)
   Current_Level_Name = CUtilites::GetCurrentObjectName(allPrefixes[5]+"14_8_");
   Level_Price = Current_Extremum+(Current_Line_Lenth*2*Vertical_Short_Level_Coefficient)*direction;
   TrendCreate(0,
               Current_Level_Name,
               0,
               Current_Date,
               Level_Price,
               Right_End_Time,
               Level_Price,
               CUtilites::GetTimeFrameColor(CUtilites::GetAllLowerTimeframes()),
               Short_Level_14_8_Style,
               Short_Level_14_8_Width
              );
  }
Please pay attention to two points. First, here the time of these levels is always calculated in bars. The required number of bars is taken from the Short_Level_Length variable, therefore, I always know how many bars will be measured.
Secondly, here you have to calculate the price based on just one point. Therefore, it is necessary to set direction dependent parameters, so that you do not have to double-check and write double code every time. In particular, we set the direction parameter, by which each term is multiplied, except for the first point. Thus, I again have only one expression describing the behavior of the line, but the sign of the terms in this expression depends on where the mouse is: above or below the candlestick.
The final shape is shown in the above figure.
Add a control structure to the Shortcuts.mqh file:
//+------------------------------------------------------------------+
//|                                                    Shortcuts.mqh |
//+------------------------------------------------------------------+

//...
//--- Draw a vertical line with 7/8 levels
         if(CUtilites::GetCurrentOperationChar(Vertical_With_Short_Levels_Key)  == lparam)
           {
            m_graphics.DrawVerticalLevels();
           }
         break;
The keyboard is V (Vertical).
Keys used in the current library implementation
| Action | Key | Means |
|---|---|---|
| Move timeframe up by main TFs (from the panel of TFs) | U | Up |
| Move timeframe down | D | Down |
| Change chart Z level (chart on top of all objects or not) | Z | Z order |
| Draw a sloping trend line based on two unidirectional extreme points closest to the mouse | T | Trend line |
| Switch ray mode for new lines | R key | Ray |
| Draw a simple vertical line | I(i) | [Only visual vertical] |
| Draw a simple horizontal line | H | Horizontal |
| Draw Andrews' pitchfork set | P | Pitchfork |
| Draw Fibonacci fan (VFun) | F key | Fun |
| Draw a short horizontal level | S | Short |
| Draw an extended horizontal level | L key | Long |
| Draw a vertical line with level marks | V | Vertical |
Conclusion
I hope that the article will be useful but I do not guarantee anything at all. The resulting toolkit is very flexible and suitable for working in any markets. However, if the article readers will start using it with default settings, the markets may probably change. Probably not too significant, because change is the essence of the market.
You are welcome to share your comments and ideas.
I wish you stable profits!
Translated from Russian by MetaQuotes Ltd.
Original article: https://www.mql5.com/ru/articles/7908
Warning: All rights to these materials are reserved by MetaQuotes Ltd. Copying or reprinting of these materials in whole or in part is prohibited.
This article was written by a user of the site and reflects their personal views. MetaQuotes Ltd is not responsible for the accuracy of the information presented, nor for any consequences resulting from the use of the solutions, strategies or recommendations described.

 Brute force approach to pattern search (Part II): Immersion
 Using spreadsheets to build trading strategies
 How to make $1,000,000 off algorithmic trading? Use MQL5.com services!
- Free trading apps
- Over 8,000 signals for copying
- Economic news for exploring financial markets
You agree to website policy and terms of use
There are some problems with space symbols in comments... Try to remove spaces between variables and comments in those strings where compiler write "Declaration without type". Right version of file was sending to moderator, so I suppose he will attache it to article as soon as he can.
compiled after removing spaces/comments - thanks
Hello Oleh
it seems that this is what was looking for
but unable to install the files
i inserted shortcuts folder files to scripts, experts and include folders
and not working yet.
is there any instructions on how to install them properly?
Hello Oleh
...is there any instructions on how to install them properly?
Nothing special.
In archive there are two folders: MQL4 and MQL5.
As usual, copy one depending on your version into your MQL data folder (File -> Open Data Folder) and then restart terminal (or select Tools -> MetaQuotes Languge Editor and compile file Experts\Shortcuts\Shortcuts.mq*).
Return to terminal and put expert on the needed chart.
P.S. If you use scripts from first article and prefer to compile expert "by hand", you need to compile each script too.
Hello!
I change parameters for line colours in the GlobalVariables file, compile it, run the EA, but the colours remain the same when creating a new line. What am I doing wrong?
Hello!
I change parameters for line colours in the GlobalVariables file, compile it, run the EA, but the colours remain the same when creating a new line. What am I doing wrong?