MetaTrader 4용 유료 기술 지표 - 93

This dynamic indicator will identify when Fast Moving Averages (EMA, SMA, or LW) cross Slow Moving Average lines on any timeframe and with any symbol.
When the moving averages cross and price close above or below the crossing, the User will receive an alert via pop-up, push, or email.
Choose any two Moving Averages to cross to receive an alert and the Indicator will also paint the Moving Average Lines and Arrows.
You can choose Exponential Moving Averages (EMA). Simple Moving Averages (SMA) o

This indicator takes input from the ADX, and presents the output in a separate indicator window as a histogram. Great for scalping. Settings: ADXPeriod Features Alerts. How to use: Simply attach to any chart with default setting, or set the ADXPeriod to your preference. Zoom chart in to get a better view of the histo color. Buy: Blue histo color on multiple timeframes. (e.g., M30-H1-H4-D) Sell: Red histo color on multiple timeframes.
Or backtest and use as you see fit for your strategy. Best

Next Trend Pro INDICATOR - the best trend indicator on the market, the indicator works on all timeframes and assets, the indicator is built on the basis of 12 years of experience in forex and many other markets. You know that many trend indicators on the internet are not perfect, late and difficult to trade with, but the Next Trend Pro indicator is different, the Next Trend Pro indicator shows a buy or sell signal, colored candles confirm the signal, and support levels and resistance levels give

Spirit mt4 is an indicator that works without flashing, the signals are triggered after the arrow at the beginning of the next candle
Includes several indicators for overbought and oversold levels.
Works with any currency pair: EUR/USD, AUD/USD and others.
After the purchase, send me a private message and I will send you the settings that I use for this indicator.
Suitable for trading cryptocurrencies.
I like to trade cryptocurrency more, so I use it more there.
It can also be used for bi
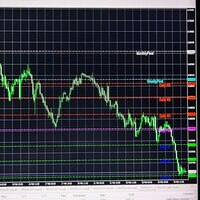
This indictor is developed to help traders identify pivot levels in market . Some people also call it support and resistance levels or zones. We have finally publishing the most advanced pivot indicator in mql5 market because it is developed using accurate pivot zones only . Remember always use bigger timeframes to get strong pivot levels. It will help you reversal trading. Visit our website from here
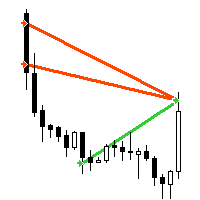
"AV Trade History" is an indicator for MetaTrader 4, which similar to the MetaTrader 5 "Trade History" or "Show trade history" setting, shows the closed trades in the chart. It also shows the orders history in the strategy tester, makes it easier to see them when testing expert advisors automated trading.
Improvements :
- Visibility is increased by line thickness and free choice of color.
- Additional information about the trade is visible when hovering over it, e.g. ticket, magic, comment,

This indicator takes input from the OBV and a trend filter, and presents the output in a separate indicator window as a histogram. Great for scalping. Settings: TrendPeriod Features Alerts. How to use: Simply attach to any chart with default setting, or set the TrendPeriod to your preference. Zoom chart in to get a better view of the histo color. Buy: Blue histo color on multiple timeframes. (e.g., M15-M30-H1-H4) Sell: Red histo color on multiple timeframes.
Or backtest and use as you see fit

Classical Divergence , Hidden Divergence both available . Enter a trade with the arrow on lower indicator. Nexus Divergence Pro is the best Divergence tool one can imagine with trade signals you will experience the super functionality. Needless to say how accurate divergence trading can be . Do your research on google you will understand its a standalone super accurate strategy.

Looking to take your forex trading to the next level? Look no further than my revolutionary forex indicator. Here are j many reasons why you should start using my indicator today: Easy to Use: With an intuitive interface and simple setup process, my forex indicator is easy for traders of all levels to use. Comprehensive Data Analysis: My forex indicator is backed by rigorous data analysis and machine learning algorithms, giving you a comprehensive view of the market. Real-Time Updates: Stay up-t

FTU 코르부스 mt4 플랫폼용 표시기는 거래에만 사용할 수 있으며 다른 표시기와 가장 잘 결합됩니다. macd, adx 등 다양한 지표로 개발되어 진입 또는 추세 변화 제안에 대한 화살표 그리기 이 지표는 FTU Idioteque와 유사합니다. FTU Predictor와 같은 다른 지표를 참조하세요. YouTube에서 짧은 소개 동영상을 시청하세요: https://youtu.be/n_nBa1AFG0I 특징: 판매 및 구매 화살표 시각 및 청각 경고 추세 지속 / 초기 추세 변화 신호 새로운 기능: 기록 막대 수 제한 막대에서 화살표의 거리 변경 사용법: 이 지표는 대부분의 자산 그룹, 외환, 상품, 지수, 암호화폐와 함께 사용할 수 있습니다. 모든 시간대, 다시 칠하지 않음, 빠른 로딩 내 FTU 예측기와 결합하면 확실히 이점을 얻을 수 있습니다! 몇 가지 조언: 자금 관리와 규율이 핵심입니다. 어떤 전략이나 지표도 성공을 거두지 못합니다. 손실이 발생할 것이라는 점과 이를 복구

Supp & Resist Every Trader Need that an Indicator will show you zones for weak, Untested, Verified, Proven and Reversal Support and Resistance with smart calculation. take a look for the Screenshots there some explanations. i don't want to talk a lot :) try it by yourself for FREE because everything is clear in the inputs parameters. If you have any question feel free to ask me.
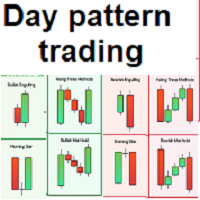
Simple and effective indicator based on some candle patterns recognition Arrows appear on candles when bear signal / bull signal based on candle pattern recognition -----> TWO strategies available you can enable / disable one of them Indicator can work on any chart and time frame I prefer to work on high time frames especially the Daily charts D1 and H4 Red arrows appears above candle showing a bear signal after candle completed - arrow will be blue during candle formation Green arrows appears b
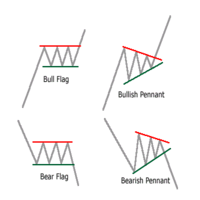
This indicator shows the Pennant and Flag pattern hidden inside your chart. Accuracy has maintained , unlike other indicators it acts way accurately because of the code we applied . Feel free to take a trade on higher timeframe breakout of this patterns. Using naked eye its often difficult to find out these price action build ups. Now you have access to worlds best Flag and Pennant indicator.
Check My Products
Contact me to discover all my services
I present to you one of the most sought after indicators by traders! It is one of the most useful and valuable indicators for discretionary trading.
It used to be easier to access this indicator from various platforms, but growing demand makes it impossible to use it on external platforms (such as TradingView) without paying a monthly subscription.
That's why I decided to use my experience in software programming to create this indica
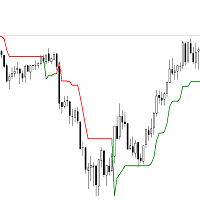
Check My Products Contact me to discover all my services
FEEL FREE TO ADD A REVIEW TO HELP ME AND OTHER COSTUMERS This is an indicator based on the famous SuperTrend. Thanks to this mt4 software, it is now possible to have them directly on the mt4 platform, without having to pay subscriptions for external platforms.
It is one of the most functional trend indicators that exists, and it really makes a difference when it comes to discretionary trading.

The First Dawn indicator uses a unique mechanism to search and plot signals.
This keeps searching for signals, making it a great indicator for scaping and identification of changes in direction, swing trading and trend trading.
The First Dawn helps you get early signals. The backtest gives the true picture of how the indicator works with real/demo accounts.
Although this is a tiny indicator it is packed with advantageous settings that will help you whether you desire to: Snap the Peaks and

Check My Other Products Contact me to discover all my services
This indicator is very useful to have a better understanding of the current trend.
With the integration of a trend color cloud it makes it easy to see the price trend immediately on the eye and this allows the trader to make more accurate assessments.
I have been using this indicator for years and I must say that it greatly limits chart errors and trades against the trend
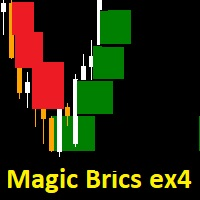
The methodology and logic behind this Magic Brics mt4 indicator is based on the principles of trend following and price action trading. Magic Brics indicator is a type of charting technique that represents price movements using order blocks rather than time. Each order block is formed based on a specified price movement, known as the order size, and is either colored in bullish (green) or bearish (red) depending on the direction of the price movement. Please make sure to adjust algo calculation

Precise Cross Arrow indicator is designed for signal trading. This indicator generates trend signals.
It uses many algorithms and indicators to generate this signal. It tries to generate a signal from the points with the highest trend potential.
This indicator is a complete trading product. This indicator does not need any additional indicators.
The indicator certainly does not repaint. The point at which the signal is given does not change.
Features and Suggestions Time Frame: H1

Индикатор показывает расстояние от ближайшего свободного High/Low
текущей (здесь и далее, текущей - в рамках расчетов индикатора) до исследуемой
(опять же - в рамках расчетов индикатора) свечи слева на графике на том же ценовом уровне. Свободным в данном случае будет являться расстояние больше, чем одна свеча (бар) от текущей
свечи до исследуемой на том же ценовом уровне. Расстояние будет отмечаться пунктирной линией
от High/Low текущей свечи до исследуемой. М
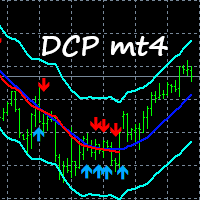
Use this indicator to help determine when to open buys or sells based on the slope and direction of the channel. Excellent for scalping. Settings: TrendPeriod. Deviation. ChannelPeriod. Features Alerts. How to use: Simply attach to any chart. To use on lower timeframes (M1,M5,M30), you'll need to start setting the Deviation from 0.01 and increase it if needed. If used on lower timeframes ( M1,M5,M30,H1), confirm on higher timeframes (H4,D,W) before entering trades. H1: Set Deviation to 0.5. H4:
The SD Indicator is a powerful tool in the world of Forex trading, that combines two classical strategies: Support/Resistance levels and Supply/Demand zones. The indicator helps traders to identify potential trading opportunities in the market with high accuracy.
Support and resistance levels are key price levels where buying and selling pressure converge, leading to potential price reversals. The SD Indicator identifies these levels in real-time and provides traders with a clear picture of whe

Amazing Pro System indicator is designed for signal trading. This indicator generates trend signals.
It uses many algorithms and indicators to generate this signal. It tries to generate a signal from the points with the highest trend potential.
This indicator is a complete trading product. This indicator does not need any additional indicators.
The indicator certainly does not repaint. The point at which the signal is given does not change.
Features and Suggestions Time Frame: H1 Wor
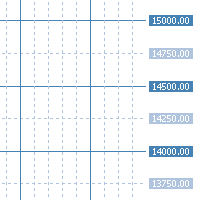
"AV Grid" is an indicator for MetaTrader 4, which automatically displays round numbers as horizontal lines and a sensible period separation . Round prices can be used as support and resistance in trading.
It is an improvement on the "Grid" setting, which also draws a grid on the chart.
Improvements :
- Round levels instead of arbitrary positioning of the horizontals
- Structure by highlighting all x lines (main lines, 2 or 5 makes sense)
- Vertical lines are each in two periods (main and i

This indicator is suitable for trading on the pair and many more. There is also an interactive panel for quickly changing settings. The indicator itself uses universal calculations of additional accuracy, but so far they are optimized for some currency pairs. Many settings can be configured on the main menu. He displays his calculations on the graph in the form of icons. There are two types of icons. In the tester, it works fine by default in the settings. You can specify a color for its icons

Forex 화살표 표시기는 통화 시장에서 성공적인 스캘핑을 위한 필수 도구입니다. 이를 통해 트레이더는 매수 또는 매도 포지션을 열 가치가 있는 시점을 쉽게 결정할 수 있으므로 차트 분석에 시간을 낭비하지 않고 수익을 올릴 수 있습니다. 신호등의 일종인 인디케이터의 빨간색과 파란색 화살표는 추세의 방향을 쉽게 판단할 수 있게 해주는 시각적 도구입니다. 빨간색 화살표는 숏 포지션(예: 통화 쌍 매도) 가능성을 나타내고 파란색 화살표는 롱 포지션(예: 통화 쌍 매수) 가능성을 나타냅니다. 그러나 화살표의 색상만 중요한 것은 아닙니다. 이 표시기에는 트레이더가 포지션에 진입하고 종료할 시기를 보다 정확하게 결정하는 데 도움이 되는 다른 매개변수도 있습니다. 예를 들어, 각 화살표에 대해 표시기는 위치를 여는 데 필요한 가격 수준을 표시할 수 있습니다. 이동 평균, 변동성, 시간 간격 등과 같은 다른 매개변수도 설정할 수 있습니다. - 이 모든 것이 트레이더가 시장 움직임을 보다 정확하게
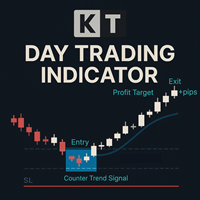
KT Day Trading MT4 provides simplified Buy and Sell signals using a combination of some specific candlestick patterns occurring in the market exhaustion zones.
These signals are designed to identify market reversals and entry/exit points. The indicator can be used to trade on any timeframe from the 1 Minute up to the Daily chart.
Features
Three types of entry signals according to the market structure i.e. Trend following, Range bound, and Counter trend signals. Crystal clear Entry, Stop-Loss,
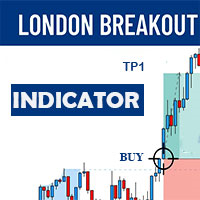
The London Breakout indicator is a technical analysis tool used in the forex market to help traders identify potential breakouts during the opening of the London trading session. This indicator is designed to help traders take advantage of the volatility and momentum that occurs during this time period, which can lead to significant price movements.
The London Breakout indicator works by identifying the range of price movement during the Asian trading session that precedes the London open, and

NATR - this is a normalized version of the ATR indicator Used to measure the level of volatility in % of the total volatility of the instrument, and not in points like a regular ATR For example NATR with a period of 10 will show the average size of a candle in % of the last 10 candles or how many percent an instrument passes in 1 candle on average This allows you to bring the values of any of the studied instruments to a common denominator. Has a simple and clear setup Visually shows
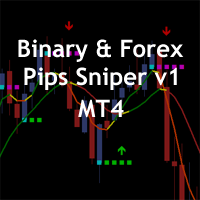
The Binary & Forex Pips Sniper MT4 indicator is based on technical analysis of two moving average and the slope of the slow moving average. The moving average helps to level the price data over a specified period by creating a constantly updated average price. Upward momentum is confirmed with a bullish crossover "Arrow UP", which occurs when a short-term moving average crosses above a longer-term moving average. Conversely, downward momentum is confirmed with a bearish crossover "Arrow Down", w
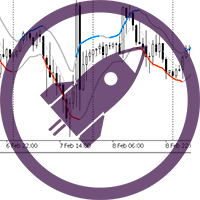
"Scalper Channel MT4" is a modern channel indicator that shows the trader the direction of the trade. For work, the indicator uses built-in and proprietary technical means and a new secret formula. Load it on the chart and the indicator will show you the entry direction in color:
If the upper limit of the price channel of the indicator is blue, open a buy position. If the lower limit of the price channel of the indicator is red, open a sell position. If the border of the indicator is gray, neut
Symbol Syncyro Switch - is a utility that allows you to switch a trading symbol on several charts at the same time. If you use several charts of the same symbol with different timeframes for analysis and want to change the symbol of a trading instrument, then this tool is just for you! With one click on the button with the inscription of the trading symbol, you can easily change it using this utility.
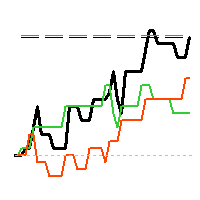
"AV Monitor" is an indicator for MetaTrader 4, which alowes a history analysis of the closed orders. It helps to achieve a quick visual analysis of your own trading or different expert advisors among themselves. Compare and analyze your expert advisors: Which one is the best?
I use an "AV Monitor MT5" indicator per running expert advisor chart to track its performance split into long & short, as well as an index chart e.g. DOW with this indicator and the setting "Show Balance & Equity" to track

MT5 버전 | Valable ZigZag표시 | FAQ 엘리엇 파동 이론은 가격 차트의 시각적 파동 모델을 기반으로 한 금융 시장의 프로세스에 대한 해석입니다. 이이론에 따르면 현재 시장에서 어떤 추세가 우세한지, 즉 상승 또는 하락 추세를 정확히 알 수 있습니다. Valable ZigZag 표시 기는 시장의 파동 구조를 보여줄 뿐만 아니라 현재 시간대에서 현재 주요 추세의 방향을 나타냅니다. 편의를 위해 Trend Monitor VZ 표시기는 거래하는 전체 통화 쌍 목록에 대한 모든 시간대의 추세 방향을 차트에표시합니다. 단일 차트에서 모든 상품에 대한 전반적인 시장 상황을 파악하여 올바른 거래 결정을 내릴 수 있습니다! Valable ZigZag 표시기는 매우 안정적이며 고전적인 지그재그처럼 방향을 자주 바꾸지 않아 트레이더에게 혼란을주지 않습니다. 이는 지표의 파동을 플로팅하기 위해 프랙탈을 사용하여 달성됩니다. Valable ZigZag 표시기는 무엇보다도 추세 표시기

If you are a market operator looking for an advanced solution to identify trends and trend reversals in financial markets, the Weiss Wave indicator could be what you need. Based on the principle of Elliott wave analysis and combining multiple indicators, the indicator provides a comprehensive view of the market in an easy and intuitive way, even for less experienced traders. With clear and easy-to-interpret buy/sell signals, the indicator provides reliable guidance for identifying trends and tre

In case you get Laguerre S crat indicator, you will get Laguerre Scrat Ea as a Gift. To get Ea and det a iled m anu al PDF contact me PM. Default settings are for usd/cad H4 For St able Long term Profits Laguerre Scrat is a trading system based on 4 indicator combinations in the shape of one indicator. Laguerre indicator (upgraded), CCI, Bollinger bands and market volatility factor. It generates arrows in the indicator window and nuts on the price chart, doubling arrows for a better view where
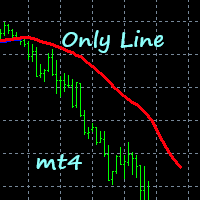
Use this indicator to help determine when to open buys or sells based on the color of the line. Excellent for scalping. Settings: Deviation. TrendPeriod.
Features Alerts. How to use: Simply attach to any chart with default settings. When used on lower timeframes (M1,M5,M30,H1), confirm on higher timeframes. Buy: Blue line below price. Best results when line is blue on multiple timeframes. Sell: Red line above price.
Best results when line is red on multiple timeframes.
Or change settings, b
RumahForexID Momentum Scalping Indicator is the best momentum indicator ever created, and why is that? The indicator works on all timeframes and assets, the indicator is made after 6 years of experience in forex. You know many momentum indicators on the internet are unhelpful, and difficult to trade, but RumahForexID Momentum Scalping Indicator is different , The indicator shows wave momentum, when the market is about to trend or consolidate, all that in one simple and clear indicator!
Rumah

Pinpoint Pro Indicator is a multi-time frames indicator, which uses more than five built-in MT4&MT5 indicator to generate trading signals. This indicator can perform several functions, such as: Send signals notification to mobile phone Gives precise signal entry upon following signal checklist points Can be used in all market such as currency pairs, stock market, metals, commodity, synthetic pairs and cryptocurrency pairs One built-in indicator can be used for signal verification before enterin

This indicator uses a special algorithm to plot the 4 lines for trading. Great for scalping. Does not feature any alerts and is best used manually after confirming the line displays. No need to set up the indicator. How to use: Attach to any chart. Can be used on any time frame. If used on lower time frames, check higher time frames for confirmation. Buy : - Wait for green and white lines to be above the level 50 dotted line, then open buys. - Buy when the green line crosses below the white line

Extreme Price Meter
과거 시장 정보를 기반으로 지표는 반전 가능성이 높은 다음 극단 가격을 계산합니다. 매수 또는 매도 가능성이 높은 2개의 가격대를 생성합니다. 캔들이 확률 밴드 밖에서 닫힐 때 표시되는 화살표를 고려하면 지표의 높은 정확도를 쉽게 알 수 있습니다. 데스크톱, 전화 및 이메일에 대한 알림.
_______________________________________________________________ _______________________________________________________________ _______________________________________________________________
간단하지만 수익성 있는 트레이딩 인디케이터, MACD Spectra ! 이 지표는 모든 시간대와 모든 통화 쌍에서 사용할 수 있습니다. 정확도가 90% 이상인 이 지표는 거래 활동을 지원하는 최고의 지표를 찾고 있는 초심자와 전문 트레이더 모두에게 적합합니다. 히스토그램의 색상, 히스토그램의 위치, Signal 및 MACD 라인의 위치를 따라가기만 하면 쉽게 시장에 진입하고 빠져나갈 수 있습니다. 더 이상 미루지 마시고 꾸준한 수익을 MACD Spectral과 함께 하세요.
입장 및 퇴장을 위해 표시기를 읽는 것은 매우 쉽습니다.
파란색 선이 빨간색 선을 교차하고 교차점이 0선 아래에 있고 막대 2에 나타나는 히스토그램이 빨간색이면 WHITE 히스토그램이 나타날 때 SELL 진입 및 청산에 대한 강력한 신호입니다. 파란색 선이 빨간색 선을 교차하고 교차점이 0선 위에 있고 나타나는 히스토그램이 막대 2에 녹색이면 흰색 히스토그램이 나타날 때 매수 진입 및 퇴장에 대한 강력한 신

Fibonacci retracement is an object or function that is often used by traders to determine values of fibonacci levels. When to open position, where is the breakout or limit point, stop loss position and take profit position can be determined based on fibonacci levels. But commonly, this object only can be used manually in Metatrader 4 (MT4). Therefore we need an indicator of fibonacci retracement. The use of indicator will make decision making easier, faster, and more consistence. We recommend t
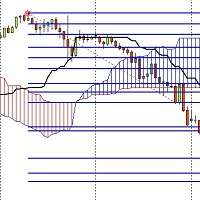
I have developed an indicator based on both the fibo musang strategy and the price breaking of the ichimoku cloud and it has amazing results
the features are:
1- Once activated it give you the trend where you are from the chart
2- After a trend change it gives you an alert on PC or notification on your phone if you are away.
3- It sends you the exact prices to take an order and 3 take profit levels and your stoploss.
4- It works on every timeframes from 1m to MN.
5- It works on pairs and C
Check My Product
Contact me to discover all my services
Pivot indicator is a tool used by many traders. It can be used by beginners and experts alike and allows you to identify support and resistance levels. Pivot indicator is a widely used tool because over the years it has shown the validity of the levels it calculates and can be easily integrated into your trading strategy. Pivot levels can be used on different timeframes and based on the chosen time duration, calculate levels using daily
Really simple tool that can be attached to any graph to keep an eye on the account status. It run as an indicator but actually is just a simple monitor. There are three sections: -account market status : infos about global open orders profit/loss, margin required, market status, etc. -account info: simple infos but good for setting lots amount, knowing contract size, server id, etc. -time data: in order not to get mad on time shifts, you have some info about local, broker, GMT time, plus winter/

This is an arrow formed by strong reversal candlesticks it is used on muti time frame or m15 and above for gold and h1 and above for currency pairs (can be used at m5 after strong volatile news) This indicator is 100% non-repain and non-repoint Have a success probability of bringing in more than 90% profit Your stop loss when entering your order is behind the arrow and will be very low it will only be 20 pips or 30 pips at m15 (note in larger timeframes it may be longer) How To USE When the a

Order Blocks are supply or demand zones in which big traders can find the comfort of placing large buy and sell orders and completing a big, very big transaction. Order blocks are a unique trading strategy that helps traders find a direction in the market. Usually, it allows traders to find out what financial institutions are planning to do in a particular market and better indicate the next price movement.

MT5 버전 | FAQ | EA Universal Breakout Universal Box 는 차트에 가격대를 표시하여 나중에 가격대 돌파 시 거래에 사용할 수 있습니다. 이 지표를 적용할 수 있는 전략은 다양합니다. 이 인디케이터는 기본적으로 차트에 아시아, 유럽 및 미국 거래 세션 범위를 표시하도록 설정되어 있습니다. 범위는 직사각형으로 표시되며, 그 경계는 거래 세션의 시작 및 종료 시간과 해당 기간의 최대 및 최소 가격 수준입니다. Telegram 채팅: @it_trader_chat 새로운 Expert Advisor Prop Master - 트레이딩 터미널에서 테스트해보세요 https://www.mql5.com/ko/market/product/115375
인디케이터 설정은 매우 간단합니다.
Time Open - 거래 세션 시작 시간 Time Close - 거래 세션 종료 시간 Box color - 사각형의 색상 인디케이터에 4개의 가격 범위를 설정할
The "Stochastic Multi Period Buy Sell Alert" is a powerful technical indicator designed to analyze price momentum and trend strength across multiple timeframes. This indicator is a valuable tool for traders looking to identify profitable trading opportunities. With the indicator, you can monitor price movements in three different timeframes, namely M15, M30, and H1. The indicator calculates the Stochastic K value for each timeframe and determines whether the price is in an oversold or overbought

LINEAR REGREESION INDICATOR ==> The indicator represents the Linear Regression Line and the Support and Resistance lines, obtained based on the standard deviation with respect to the Linear Regression. Customization: The following values can be adjusted: Rango Tendencia: The number of bars or periods, within the considered time frame, taken as a reference for the indicator. AmpDesv: The amplitude or number of times to consider the standard deviation of the linear regression for its representatio
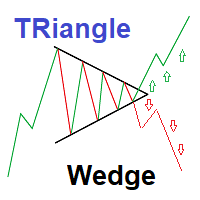
Strategy set to trade Triangle wedge break
This is a simple very effective strategy based on detecting and showing triangle wedges formation Strategy set to trade Triangle wedge break Red Arrows appears on crossing triangle down Green Arrows appears on crossing triangle Up You can also trade lower and upper triangle limit :(new version may be released to allow arrows for side ways trading) ---Sell on price declines from High triangle Level - Buy on increasing from Lower triangle level 2 input

인디케이터 구매자는 Fiter 인디케이터를 기반으로 한 EA를 보너스로 무료로 받을 수 있습니다. (EA가 작동하는 모습을 보려면 비디오를 시청하세요.) EA를 받으려면 댓글을 남겨주세요.
Fiter 는 ATR로 조정된 RSI 라인(노란색)을 포함하는 지수 이동 평균(EMA)과 전통적인 이동 평균(빨간색)을 결합한 하이브리드 인디케이터입니다. 이 두 라인의 교차는 두 개의 단순 이동 평균을 사용하는 고전적인 접근 방식보다 훨씬 부드럽고 신뢰할 수 있는 거래 신호를 생성합니다.
백테스트는 이 방법의 효과를 입증했으며, 단순 이동 평균 교차와 비교하여 우수한 성능을 보여줍니다. 과거 데이터를 보면 Fiter는 다양한 시장 상황에 잘 적응하며, 실제 수동 거래에서 주요 트렌드를 식별하는 데 유용한 도구임을 알 수 있습니다.
차이를 경험하려면 스크린샷을 확인하거나 전략 테스터에서 인디케이터를 실행해보세요.
거래 신호에 대한 알림 기능도 포함되어 있습니다.

MT5 Version Order Blocks ICT Kill Zones SMT Divergences ICT Breakers
The ICT Breakers indicator is a powerful tool for traders looking to gain an edge in the market. This indicator is based on the order flow and volume analysis, which allows traders to see the buying and selling pressure behind the price action. This information can be extremely valuable in identifying key levels of support and resistance, as well as potential turning points in the market. Breaker blocks are areas where in

Осциллятор Чайкина ( Chaikin Oscillator ) — это индикатор импульса, созданный Марком Чайкиным , и, очевидно, индикатор назван в честь своего создателя. Он измеряет импульс линии распределения и накопления, используя формулу схождения-расхождения скользящих средних (MACD). На основе данных об этом импульсе мы можем получить представление о направленных изменениях в линии распределения и накопления.

This indicator is a supporting tool which helps you draw/update any chart object once. The additions or changes are automatically synchronized to all linked chart windows of the same instrument. Setup is simple. Open all required charts you want to work on, attach the indicator to each chart window and start using it.
Its only allowed to attach one indicator to each chart. Once attached, you can draw on any chart (as long as it has this tool attached as indicator) and the drawing will show up o

This indicator was constructed using decision trees. I will only give a few insights into the algorithm since it is original. But there are 4 trees in the inputs and by default they are 10. The decision tree logic for buy signals is as follows: If the MACD line is less than certain bullish divergence (determined by the "BUY_TREE_1" and "BUY_TREE_2" variables) The decision tree logic for sell signals is as follows: If the MACD line is greater than certain bearish divergence (determined by the
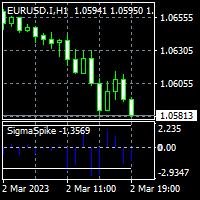
To get access to MT5 version please click here . - This is the exact conversion from TradingView: "SigmaSpikes(R) per Adam H. Grimes" by "irdoj75" - This is a light-load processing and non-repaint indicator. - All input options are available. - Buffers are available for processing in EAs. - You can message in private chat for further changes you need. Thanks for downloading
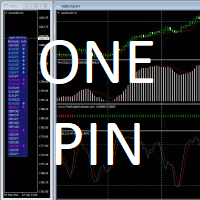
Transform indicators into trading signals JagzFX OnePin Basic allows a wide range of MT4 Custom Indicators to be transformed into multi-symbol trading signals without the need to write any code. You can use OnePin to create 'At A Glance' dashboards showing your preferred technical indicators and even send buy/sell signals to a PIN compatible dashboard just as JagzFX pinTrader. Whilst I have tried to limit the amount of technical jargon needed to use this PIN, there are a few terms that might nee

The Multi Channel Trend indicator was developed to help you determine the trend direction by drawing channels on the graphical screen. It draws all channels that can be trending autonomously. It helps you determine the direction of your trend. This indicator makes it easy for you to implement your strategies. The indicator has Down trend lines and Up trend lines. You can determine the price direction according to the multiplicity of the trend lines. For example , if the Down trend lines start to

The Hero Line Trend indicator was developed to help you determine the trend direction by drawing channels on the graphical screen. It draws all channels that can be trending autonomously. It helps you determine the direction of your trend. This indicator makes it easy for you to implement your strategies. The indicator has Down trend lines and Up trend lines. You can determine the price direction according to the multiplicity of the trend lines. For example , if the Down trend lines start to

The technical indicator "Reversal patterns" is a mathematical interpretation of the classic reversal patterns: Pin Bar, Harami and Engulfing. That is, the "reversal bar", "Harami" and "Absorption". This indicator allows you to determine the moment of reversal of quotes based on market dynamics and the winner between the "bulls" and "bears".
The indicator displays the moment of reversal at the local highs and lows of the chart of any timeframe, which allows you to increase the accuracy of the s
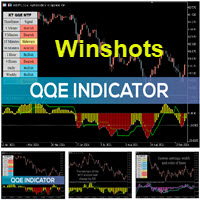
The Qualitative Quantitative Estimation (QQE) indicator is a technical analysis tool developed for the MetaTrader 4 (MT4) trading platform. It is designed to help traders identify potential trend reversals and to determine the strength of a current trend. The QQE indicator is calculated based on the Relative Strength Index (RSI) and Moving Average (MA) indicators. The RSI is used to determine the momentum of price movements, while the MA is used to smooth out the price data and identify trends.
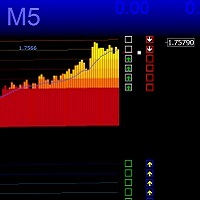
Канал TMA формирует расчёт зеркальным методом, что позволяет плавно компенсировать пробойные удары и точнее определять разворот, канал имеет дополнительную защиту от сужения, канал имеет ускоритель направляющей с заданными настройками, сигналы появляются на возврате направляющей линии, Версия MTF 2023 позволяет индивидуально настраивать канал на другие временные рамки и разные инструменты, возможны доработки, рекомендуется Gold M1 M5
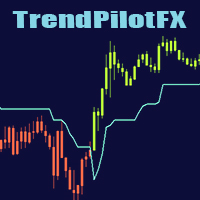
This Mql4 indicator smooths the trend by changing candle colors without altering their size, allowing for better price action reading. It also includes a trend line for trade entry and exit points. Smooth out market trends and improve your price action reading with this powerful Mql4 indicator. Unlike Heikin Ashi, this indicator changes candle colors without altering their size, providing you with a clearer picture of market movements. In addition, it includes a trend line that traders can rely

The product Divergence Macd Obv Rvi Ao Rsi is designed to find the differences between indicators and price. It allows you to open orders or set trends using these differences. The indicator has 4 different divergence features. To View Our Other Products Go to the link: Other Products
Divergence types Class A Divergence Class B Divergence Class C Divergence Hidden Divergence
Product Features and Rec ommendations There are 5 indicators on the indicator Indicators = Macd Obv Rvi Ao Rsi 4 diffe
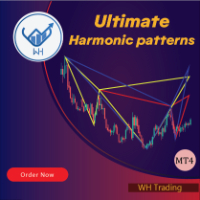
Ultimate Harmonic Patterns 인식 표시기에 오신 것을 환영합니다. Gartley 패턴, Bat 패턴 및 Cypher 패턴은 트레이더가 시장에서 잠재적 반전 지점을 식별하는 데 사용하는 인기 있는 기술 분석 도구입니다.
Ultimate Harmonic Patterns recognition Indicator는 고급 알고리즘을 사용하여 시장을 스캔하고 이러한 패턴을 실시간으로 식별하는 강력한 도구입니다.
Ultimate Harmonic Patterns 인식 지표를 사용하면 이러한 인기 패턴을 기반으로 잠재적인 거래 기회를 빠르고 쉽게 식별할 수 있습니다.
*구매 후 저에게 연락하시면 지침 및 단계 안내를 보내드립니다.
MT5 버전 : Ultimate Harmonic Patterns MT5 이 지표는 주요 피보나치 되돌림 수준과 함께 차트의 패턴을 표시하여 잠재적인 진입점과 퇴장점을 쉽게 식별할 수 있도록 합니다.
또한 지표에는 다양한 사용자 지정 옵션이
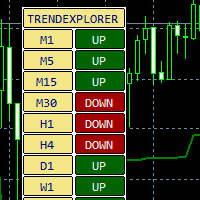
An indicator of the trend direction of a trading instrument on different timeframes. The author's method of calculating the trend is used.
You can enable and disable different timeframes.
Suitable for working with currency pairs, stocks, futures, cryptocurrencies.
Settings:
ATR Multiplier - ATR multiplier; ATR Period - ATR indicator period; ATR Max Bars (Max 10.000) - Number of bars to calculate; Candle shift to Calculate - Report start bar; On/Off Timeframe M1 - Enable different t

WARNING: PRICE IS SUBJECT TO RISE AT ANY TIME. GET YOUR COPY TODAY TO AVOID MORE COST! Dear Traders I am so glad to introduce to you my other tool called the Forex Sniper Entries Indicator. This tool is designed to help serious traders and investors capture big moves in the currency price movements. The philosophy behind this tool is all about winning big and riding the price movement from its beginning until the maximum point. We want to capture those big moves in both down and up markets as mu
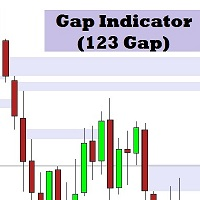
갭 지표 (123 갭): 잠재적 가격 목표를 식별하는 정밀 도구 갭 지표 (123 갭)는 시장 구조를 기반으로 높은 확률의 가격 목표를 식별하도록 설계된 강력한 도구입니다. 연속된 3개의 캔들 세트를 분석하여 이 지표는 종종 가격 움직임의 자석 역할을 하는 중요한 갭을 찾아냅니다. 작동 방식 지속적 분석 : 차트의 모든 연속 3개 캔들 세트를 스캔합니다. 갭 식별 : 각 세트의 첫 번째와 세 번째 캔들 사이의 갭을 계산합니다. 시각적 표현 : 식별된 갭은 쉽게 해석할 수 있도록 색상 코드화되어 차트에 표시됩니다. 주요 이점 잠재적 반전 예측 : 트렌드 반전 후 가격이 돌아올 수 있는 영역을 강조 표시합니다. 리트레이스먼트 목표 식별 : 리트레이스먼트 중 가격이 일시 정지할 수 있는 수준을 지적합니다. 거래 진입 및 퇴출 개선 : 갭 수준을 사용하여 진입 및 퇴출 지점을 정교화합니다. 실제 예시 하락 트렌드 시나리오에서: 첫 번째 캔들의 저가: 1.0000 세 번째 캔들의 고가: 0.
트레이딩 전략과 기술 지표를 판매하기에 가장 좋은 장소가 왜 MetaTrader 마켓인지 알고 계십니까? 광고나 소프트웨어 보호가 필요 없고, 지불 문제도 없습니다. 모든 것이 MetaTrader 마켓에서 제공됩니다.
트레이딩 기회를 놓치고 있어요:
- 무료 트레이딩 앱
- 복사용 8,000 이상의 시그널
- 금융 시장 개척을 위한 경제 뉴스
등록
로그인
계정이 없으시면, 가입하십시오
MQL5.com 웹사이트에 로그인을 하기 위해 쿠키를 허용하십시오.
브라우저에서 필요한 설정을 활성화하시지 않으면, 로그인할 수 없습니다.