MetaTrader 4용 유료 기술 지표 - 110
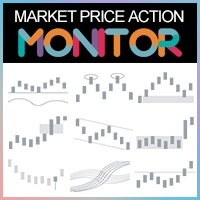
Why do I need to use the Market PA Monitor:
1.It is impossible to monitor multiple varieties and multiple TF of the market.
The market situation is constantly changing, with numerous varieties, and each variety has different timeframe from small to large. Each TF contains different market changes and trend alternations. Under numerous varieties and multiple TFs, there are countless trading opportunities every day. However, an ordinary trader cannot detect the trading opportunities of each v
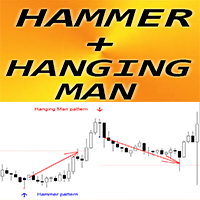
MT4용 외환 지표 "해머 및 행잉맨 패턴"
표시기 "Hammer and Hanging Man"은 가격 행동 거래에 대한 매우 강력한 표시기입니다. 다시 칠하지 않고 지연이 없습니다. 지표는 차트에서 상승세를 보이는 Hammer 및 하락세를 보이는 Hang Man 패턴을 감지합니다. Bullish Hammer - 차트의 파란색 화살표 신호(그림 참조) Bearish Hang Man - 차트의 빨간색 화살표 신호(사진 참조) PC, 모바일, 이메일 알림으로 지표 "해머와 행잉맨"은 지원/저항 수준과 결합하는 데 탁월합니다
// 더 훌륭한 전문가 자문 및 지표는 여기에서 확인할 수 있습니다: https://www.mql5.com/en/users/def1380/seller 본 MQL5 홈페이지에서만 제공되는 오리지널 제품입니다.

The GT_SqueezeBreakOut signal indicator is a momentum based strategy using the bollinger bands and standard deviation indicators (which indicate periods of low volatility and eventual breakout) as well as the Fisher momentum/trend indicator to filter quality trade signals. It shows the squeeze (price consolidation) periods on chart and also signals on breakout of squeeze/price consolidation. You get instant alert/ push notification both on chart and on any other device used to receive alert sig

Golden Range 2 is one of the top entry indicators securing its future with its results. Indicator settings: Points = how precise pattern detection is AlertConfirmation = turn on(true) off(false) alert CalculatedBars = how many bars will be calculated
Please leave Positive comments, reviews. Buffer 0 Buy Arrow, Buffer 1 Sell Arrow, Buffer2 Buy Signal(Value:1/0), Buffer3 Sell Signal(Value:1/0) Buy Green, Sell Red

Powerful Order Block indicator in Tradingview platform. Indicator type: Price Action indicator Introduction: The Order Block Indicator - Elevating Your Price Action Analysis. If you're seeking a comprehensive Order Block indicator on the MQL5 platform, look no further.
Firstly, according to this indicator, an OB is understood as a zone of pending orders from large institutions that haven't been fully executed, revealing themselves in the market through subtle signs. Prices react strongly wh
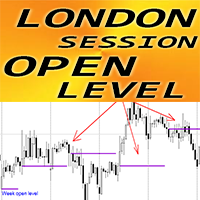
MT4용 외환 지표 "런던 세션 오픈 레벨"
지표 "런던 세션 오픈 레벨"은 일중 거래에 매우 유용한 보조 지표입니다. 세션 공개 가격 수준은 매우 중요합니다. 왜냐하면 가격이 하루 동안 해당 영역으로 되돌아가는 경우가 매우 많기 때문입니다. 표시기는 매일 런던 세션 시가 수준을 보여줍니다. 또한 표시기는 월요일의 주간 오픈 레벨을 표시합니다. 일중 트레이더가 목표를 설정하거나 지지/저항 영역으로 사용하는 데 유용합니다. ............................................................................................................................................. // 더 훌륭한 전문가 자문 및 지표는 여기에서 확인할 수 있습니다: https://www.mql5.com/en/users/def1380/seller 본 MQL5 홈페이지에서만 제공되는 오리지널 제품입니다.
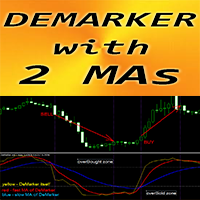
MT4용 외환 지표 "디마커 및 2개 이동 평균"
DeMarker 오실레이터 곡선은 지표 계산 기간 동안 이전 고점과 저점을 기준으로 현재 가격 위치를 나타냅니다. "DeMarker 및 2개의 이동 평균" 표시기를 사용하면 DeMarker 오실레이터의 빠르고 느린 이동 평균을 볼 수 있습니다. OverBought 영역(0.7 이상)에서 Sell 항목을 가져오고 OverSold 영역(0.3 이하)에서 Buy 항목을 가져오는 것이 좋습니다. 지표는 매개변수를 통해 설정하기가 매우 쉽고, 어떤 시간대에도 사용할 수 있습니다. 매수, 매도 진입 조건은 사진에서 확인하실 수 있습니다 매수(매도) 신호 조건을 고려하십시오. (1) -과매도(overBought)에서 빠른 MA가 느린 MA를 상향(하향) 교차합니다. 매수(매도) 거래 개시 (2) - DeMarker 값은 과매수 영역에 있으며 빠른 MA 하향 교차(과매도 영역에서는 빠른 MA 상향 교차): 매수(매도) 거래 종료
// 더

The Listo trend direction indicator shows the current trend direction by coloring the bars in red and blue. It is suitable for all currency pairs and timeframes. It is important to remember that to enter the market it is necessary to take into account an integrated approach and additional signals. The operating principle of the indicator is based on automatically determining the current state of the market and analyzing historical data when placing it on a chart.
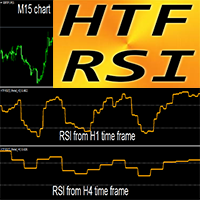
MT4용 외환 표시기 HTF RSI 발진기
RSI 자체는 가장 우수하고 가장 인기 있는 오실레이터 중 하나입니다. HTF는 더 높은 시간 프레임을 의미합니다. 과매수 구간은 RSI가 70 이상일 때, 과매도 구간은 30 미만일 때를 말합니다. RSI는 강세 및 약세 가격 모멘텀에 대한 정보를 제공합니다. 이 지표는 가격 조치 항목이 있거나 다른 지표와 결합된 다중 시간 프레임 거래 시스템에 탁월합니다. HTF RSI 표시기를 사용하면 더 높은 시간대의 RSI를 현재 차트에 첨부할 수 있습니다. 표시기에는 모바일 및 PC 알림이 내장되어 있습니다.
// 더 훌륭한 전문가 자문 및 지표는 여기에서 확인할 수 있습니다: https://www.mql5.com/en/users/def1380/seller 본 MQL5 홈페이지에서만 제공되는 오리지널 제품입니다.

Gann Angles Indicator The Gann Angles Indicator is a powerful technical tool based on the theory of William Delbert Gann. It helps traders identify potential support and resistance levels, as well as trend direction across various time intervals. Key features: Automatic determination of extremum within a specified time range Construction of 9 Gann Fan lines with angles of 82.5, 75, 71.25, 63.75, 45, 26.25, 18.75, 15, and 7.5 Flexible line color customization Adaptation to both upward an

Get rid of trading confusion and embrace stable income! Are you still worried about finding a low-risk and stable profit method? Are you still anxious about judging the market direction and controlling the risk of placing orders? The new cross-platform arbitrage indicator helps you easily achieve stable returns! Accurately capture arbitrage opportunities without you having to worry! The cross-platform arbitrage indicator is a powerful tool that can monitor the price differences of the same finan
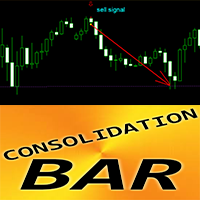
MT4용 외환 표시 통합 막대 패턴
표시기 "Consolidation Bar"는 가격 조치 거래를 위한 매우 강력한 브레이크아웃 중심 표시기입니다. 표시기는 1바 동안 좁은 영역에서 가격 통합을 감지하고 브레이크아웃 방향, 보류 주문 및 SL 위치를 표시합니다. Bullish Consolidation Bar - 차트의 파란색 화살표 신호(그림 참조) Bearish Consolidation Bar - 차트의 빨간색 화살표 신호(그림 참조) 다시 칠하지 마세요. 지연 없음; 높은 R/R 비율(보상/위험) PC, 모바일 및 이메일 알림이 포함되어 있습니다. 지표 "통합 막대 패턴"은 지지/저항 수준과 결합하는 것이 좋습니다
// 더 훌륭한 전문가 자문 및 지표는 여기에서 확인할 수 있습니다: https://www.mql5.com/en/users/def1380/seller 본 MQL5 홈페이지에서만 제공되는 오리지널 제품입니다.
Meta indicator
Bun venit!
Studiu și experiență Metaindicator. Există trei indicatori integrați într-unul singur.
Funcționează pe toate intervalele de timp și pe toate perechile. I prefer the M15.
Am deja o tranzacție câștigată cu el.
Succes!
Notă Este posibil ca acești indicatori și experți pe care îi avem de vânzare să nu funcționeze pe anumite platforme. De câțiva ani, unele platforme cu noi versiuni MT4 nu afișează toți indicatorii personalizați.
O soluție la această problemă

Fibonacci Wave Bands Indicator The Fibonacci Wave Bands indicator utilizes Fibonacci ratios to create dynamic bands around a central moving average. These bands are derived from key Fibonacci ratios (typically 38.2%, 50%, 61.8%) and adapt to market volatility, offering insights into potential support and resistance zones. Key Features: Fibonacci Levels: The indicator plots multiple bands above and below a central moving average based on Fibonacci ratios. Dynamic Support and Resistance: Bands ser
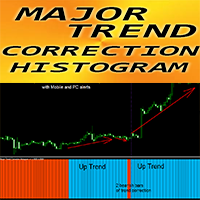
MT4용 외환 지표 "주요 추세 수정 히스토그램"
주요 추세 수정 히스토그램 표시기는 큰 추세를 감지하도록 설계되었습니다. 표시기는 2가지 색상으로 제공됩니다: 하락 추세는 빨간색, 상승 추세는 파란색(색상은 변경 가능) 동일한 색상의 연속 히스토그램 열이 10개 이상 있으면 새로운 추세의 시작을 의미합니다. 표시기에는 모바일 및 PC 알림이 내장되어 있습니다. 지표의 민감도를 담당하는 매개변수 "기간"
사용 방법 표시기: 1) 동일한 색상의 연속 히스토그램 열이 10개 이상 있는지 확인합니다. 이는 새로운 추세의 시작을 의미합니다(파란색 - 강세, 빨간색 - 약세). 2) 그런 다음 1~2개의 반대 색상 열이 발생하고 다시 주요 추세의 색상으로 변경되는 경우, 이것이 추세 수정입니다. 3) 수정 후 고려하는 것이 좋습니다: 큰 상승 추세일 경우 매수 거래를 열고, 큰 하락 추세일 경우 매도 거래를 시작하는 것이 좋습니다.
// 더 훌륭한 전문가 자문 및 지표는 여기에서
여러 차트를 전환하며 다양한 통화 쌍과 시간 프레임을 모니터링하는 것에 지치셨나요? Pairs and TF Changer 지표가 거래 경험을 혁신합니다! 모든 전략 지표를 로드한 후 Pairs and TF Changer 를 차트에 추가하십시오. 필요에 따라 위치, 색상 또는 표시할 열 수를 조정할 수 있습니다! 주요 기능: 원활한 통합: 이 지표를 거래 전략에 쉽게 통합하십시오. 클릭 한 번으로 단일 차트에서 모든 통화 쌍과 시간 프레임을 거래하십시오. 추가 차트를 전환하거나 열 필요가 없습니다. 높은 맞춤화 가능: 차트의 어느 위치에든 위치를 조정하십시오 (위, 아래, 왼쪽, 오른쪽). 1열 또는 10열의 버튼을 표시하도록 설정하십시오. 거래 테마에 맞게 색상을 맞춤화하십시오. 차트를 깔끔하고 정돈되게 유지하기 위해 버튼을 투명하게 만드십시오. 보편적 호환성: 모든 유형의 지표 및 전략과 호환됩니다. Forex, 금속, 미국 주식, 지수, 석유, 선물 및 암호화폐를 포함한 모든 심
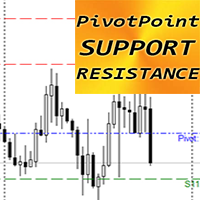
MT4용 외환 지표 "PIVOT POINT 지원 저항"
지표 "피벗 포인트 지지 저항"은 가격 행동 거래를 위한 매우 강력한 보조 지표입니다. 피벗 수준은 이전 거래 기간의 시장 성과를 바탕으로 중요한 가격의 평균으로 계산됩니다. 피벗 레벨 자체는 전반적인 시장 상황에 따라 가장 높은 저항 또는 지지 수준을 나타냅니다. 지표 "피벗 포인트 지지 저항"은 가격별로 도달할 수 있는 가장 가능성 있는 반전 수준을 보여줍니다. R1, R2, R3 - 저항 수준(빨간색) S1, S2, S3 - 지원 수준(녹색) 일일, 주간 및 월별 이전 거래 기간을 계산 설정에서 사용할 수 있습니다. 지표 "피벗 포인트 저항 지원"은 가격 조치 패턴을 통해 이익실현 목표 또는 가격 반전을 계획하는 데 탁월합니다. 사용 방법 표시기: 1) 해당 차트에 지표를 첨부합니다. 2) 필요한 설정을 선택하고 OK 버튼을 누릅니다. 3) 지표의 초기 정확한 계산을 위해 MT4(H1, H4, D1, W1)의 다양한
Indicator de înaltă precizie
Bun venit!
Indicatorul de înaltă precizie a fost creat pentru intervalul de timp M5. Rezultatele sunt foarte bune. Vă recomandăm un TP = 10 sâmburi. Dar poate fi mai mare. Acest indicator are potențialul de a declanșa tranzacții mult mai lungi.
Experimentează-l!
Noroc!
IMPORTANT! Verificați mai întâi indicatorul sau expertul pe un cont DEMO, înainte de a-l cumpăra! Analizați-l bine!
Închiriați-l pentru o perioadă mai scurtă de timp. Pentru a vedea cum
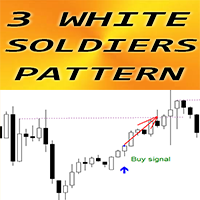
MT4용 외환 지표 "3 백병 패턴"
표시기 "3 White Soldiers 패턴"은 가격 행동 거래에 매우 강력합니다. 다시 칠할 필요도 없고 지연도 없습니다. 지표는 차트에서 강세를 보이는 3개의 White Soldiers 패턴을 감지합니다. 차트의 파란색 화살표 신호(그림 참조) PC, 모바일 및 이메일 알림이 포함되어 있습니다. 또한 그 형제인 하락세 "3 Black Crows 패턴" 지표도 사용할 수 있습니다(아래 링크 참조). 표시기 "3 White Soldiers 패턴"은 지원/저항 수준과 결합하는 데 탁월합니다
// 더 훌륭한 전문가 자문 및 지표는 여기에서 확인할 수 있습니다: https://www.mql5.com/en/users/def1380/seller MQL5 홈페이지에서만 제공되는 오리지널 제품입니다.

Misio - can be used as an independent trading system. The indicator determines the market trend, ignoring sharp fluctuations and noise around the average price. It displays the trending movement with potential stop points.
Simple, clear and effective use. The indicator does not redraw and does not lag. Suitable for all currency pairs and all timeframes.
Interpretation:
The location of the rate above or below the shadows indicates the presence of a trend. A move into the shadows signals a
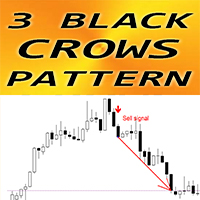
MT4용 외환 지표 "3 Black Crows 패턴"
지표 "3 Black Crows 패턴"은 가격 행동 거래에 매우 강력합니다. 다시 칠하지 않고 지연도 없습니다. 지표가 차트에서 약세 3개의 검은 까마귀 패턴을 감지합니다. 차트의 빨간색 화살표 신호(그림 참조) PC, 모바일 및 이메일 알림이 포함되어 있습니다. 또한 그 형제인 낙관적인 "3 White Soldiers 패턴" 지표도 사용할 수 있습니다(아래 링크를 따르세요). 지표 "3 Black Crows 패턴"은 지원/저항 수준과 결합하는 데 탁월합니다
// 더 훌륭한 전문가 자문 및 지표는 여기에서 확인할 수 있습니다: https://www.mql5.com/en/users/def1380/seller 본 MQL5 홈페이지에서만 제공되는 오리지널 제품입니다.

Indicatorul Argo
Indicatorul Argo este special creat pentru intervalul de timp M5. Rezultatele sunt foarte bune.
Indicatorul funcționează și pe intervale de timp mai lungi, dar semnalele sunt rare.
Marcatorul nu revopsește.
Vă recomandăm un TP minim de 5, 10 sâmburi pentru M5.
Acest indicator arată similar cu indicatorul Fantastic, dar este construit pe un model diferit.
Succes!
Note Dacă indicatorul nu este afișat, citiți comentariul meu în secțiunea de comentarii pentru a afla cu

Săgeți H1 Este creat pentru gama H1. Funcționează mai bine pentru perechile EURUSD și EURJPY. Marcatorul nu revopsește. Succes! Dacă indicatorul nu este afișat, citiți comentariul meu în secțiunea de comentarii pentru a afla cum să faceți acest lucru. Verificați mai întâi indicatorul sau expertul pe un cont DEMO, înainte de a-l cumpăra! Analizați-l bine! Închiriați-l pentru o perioadă mai scurtă de timp. Pentru a vedea cum funcționează și dacă funcționează pe computer.

MT4용 외환 지표 "HTF 볼린저 밴드"
MT4용 전문 지표 "HTF 볼린저 밴드"로 거래 방법을 업그레이드하세요. HTF는 더 높은 시간 프레임을 의미합니다. 볼린저 밴드는 시장 최고의 지표 중 하나입니다. 거래를 위한 완벽한 도구입니다. 가격 변동의 약 90%가 두 밴드 사이에서 발생합니다. HTF 볼린저 밴드 지표는 가격 조치 항목이 있거나 다른 지표와 결합된 다중 시간 프레임 거래 시스템에 탁월합니다. 이 지표를 사용하면 더 높은 시간대의 볼린저 밴드를 현재 차트에 연결할 수 있습니다.
// 더 훌륭한 전문가 자문 및 지표는 여기에서 확인할 수 있습니다: https://www.mql5.com/en/users/def1380/seller MQL5 홈페이지에서만 제공되는 오리지널 제품입니다.
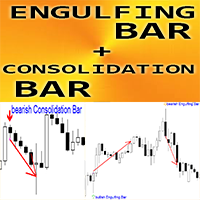
MT4용 Forex 지표 "Engulfing Bar 및 Consolidation Bar 패턴"
지표 "Engulfing Bar 및 Consolidation Bar 패턴"은 가격 행동 거래에 매우 강력합니다. 표시기는 차트에서 Engulfing Bars 및 Consolidation Bars를 감지합니다. Bullish Engulfing Bar 패턴 - 차트의 녹색 화살표 신호 Bearish Engulfing Bar 패턴 - 차트의 주황색 화살표 신호 강세 통합 막대 패턴 - 차트의 파란색 화살표 신호 Bearish Consolidation Bar 패턴 - 차트의 빨간색 화살표 신호 다시 칠하지 마세요. 지연 없음; Consolidation Bar 자체는 R/R 비율(보상/위험)이 높습니다. PC, 모바일, 이메일 알림으로 표시기 "Engulfing Bar 및 Consolidation Bar 패턴"은 지원/저항 수준과 결합하는 데 탁월합니다
// 더 훌륭한 전문가 자문 및 지표

To get access to MT5 version please click here . This is the exact conversion from TradingView: " WaveTrend" by LazyBear.
This is a light-load processing and non-repaint indicator. All input options are available. Buffers are available for processing in EAs. You can message in private chat for further changes you need. The filling area option is omitted to fit into MT4 graphics.
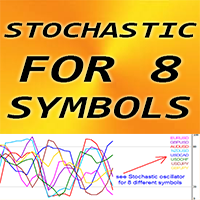
MT4용 외환 지표 "8개 기호에 대한 확률론적".
스토캐스틱 오실레이터는 시장 최고의 지표 중 하나이며 많은 트레이더에게 완벽한 도구입니다. 과매수 구역 - 80 이상; 과매도 1 - 20 미만 80 영역 이상에서 매도 항목을 가져오고 20 영역 이하에서 구매 항목을 가져오는 것이 좋습니다. "8개 기호에 대한 확률론"은 하나의 차트에서 최대 8개 기호의 확률론적 값을 제어할 수 있는 기회를 제공합니다. 이 지표는 가격 조치 항목과 결합하는 데에도 탁월합니다. ............................................................................................................................................. // 더 훌륭한 전문가 자문 및 지표는 여기에서 확인할 수 있습니다: https://www.mql5.com/en/users/def1380/seller 본 MQL5 홈페이

GoTrend Multi-Timeframe 지표 "GoTrend Multi-Timeframe" 지표는 여러 시간 프레임에서 통화쌍의 전체 및 특정 추세를 빠르고 효율적으로 평가하려는 트레이더에게 필수적인 도구입니다. 이 지표는 트레이더가 시장 방향에 대한 명확하고 포괄적인 시각을 한눈에 얻을 수 있도록 하여 의사 결정을 최적화하고 거래 전략의 효과를 높일 수 있습니다. 주요 특징: 다중 시간 프레임 분석: 이 지표는 M5, M15, M30, H1, H4 및 D1의 여섯 가지 다른 시간 프레임에 대한 포괄적인 분석을 제공하여 트레이더가 각 기간의 추세를 이해할 수 있도록 합니다. 통합 기술 지표: 이 지표는 RSI, SAR, MA, MACD 및 ADX의 다섯 가지 강력한 기술 지표를 사용하여 각 시간 프레임에서 추세 방향을 결정합니다. 명확하고 직관적인 시각화: 신호는 직관적인 기호와 색상으로 메인 차트의 원하는 코너에 표시됩니다. 이를 통해 트레이더는 시장 상황을 한눈에 평가할 수

Trend oscillator indicator for tracking microtrends and pullbacks. Determines even a minor change in trend . Allows you to open positions in a timely manner in accordance with market changes. Works on all timeframes, all currency pairs, metals, indices and cryptocurrencies. Can be used when working with binary options. Distinctive features Does not redraw after the candle closes; Accurately detects trend changes; Simple and clear setup; Works on all timeframes and all trading instruments; Suit

Pipwise Indicators Multiple MAs The Pipwise Indicators Moving Averages indicator is a powerful tool for technical analysis in MetaTrader 4 (MT4). It allows traders to visualize and analyze moving averages from multiple periods on a single chart. Here are the key features:
Customizable Moving Averages: Traders can choose the number of moving averages to plot (up to 9 MAs). Each Moving Average is customiseable.
Method Selection: The indicator supports various moving average methods, includin

The Accelerator Oscillator (AC) technical indicator measures the acceleration or deceleration of the current market strength. It is designed to identify potential trend reversal points and is used to determine the moment of buying or selling assets. The indicator helps traders make decisions based on changes in market dynamics. This implementation of the indicator is its creative version. Since the standard version is very limited by its built-in settings, this implementation has significantly
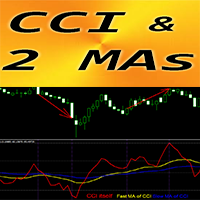
MT4용 외환 지표 "CCI 및 2개 이동 평균"
상품 채널 지수(CCI)는 추세 방향으로의 모멘텀 거래에 탁월합니다. "CCI 및 2개 이동 평균" 표시기를 사용하면 CCI 표시기의 빠르고 느린 이동 평균을 볼 수 있습니다. 상승 추세 - 빠른 MA가 느린 MA보다 높습니다. 하락 추세 - 빠른 MA가 느린 MA보다 낮음 CCI는 거래에서 가장 인기 있는 오실레이터 중 하나입니다. 현재 가격과 과거 평균 가격의 차이를 측정합니다. 옵션#1 - 50에서 -50 값의 중앙 영역에서 추세 방향으로 거래를 개시하고, 지표가 그에 따라 200/-200 영역에 도달하면 종료합니다. 중요 수준: +/-200, 옵션#2 - +200 영역 위의 매도 항목과 -200 이하의 매수 항목을 추세 방향으로 가져옵니다. 지표는 추세 변화를 매우 일찍 확인할 수 있는 기회를 제공합니다.
// 더 훌륭한 전문가 자문 및 지표는 여기에서 확인할 수 있습니다: https://www.mql5.com/en/

Installation MetaTrader 4 Download: Download the provided file PrecisionStopDemo.ex4. Copy the File: Open MetaTrader 4. From the top menu, click on File > Open Data Folder. Navigate to MQL4 > Indicators. Copy the file PrecisionStopDemo.ex4 into this folder. Restart MetaTrader: Close and reopen MetaTrader 4. Add Indicator to Chart: In the Navigator (Ctrl+N), expand the Indicators folder. Find the indicator PrecisionStopDemo and drag it onto the desired chart.
Configuration After adding the i

Tired of navigating the sea of uncertainties in the financial market? Imagine having an experienced guide by your side, helping you decipher the mysteries of charts and leading you confidently toward financial success. With StakBank, you'll have more than just a simple indicator in your hands. You'll have a complete arsenal of tools to make assertive and profitable decisions. But what makes StakBank so special? Volume: Understand the driving force behind market movements, accurately identifying

Key Features: Pattern Recognition : Identifies Fair Value Gaps (FVGs) Spots Break of Structure (BOS) points Detects Change of Character (CHoCH) patterns Versatile Application : Optimized for candlestick charts Compatible with any chart type and financial instrument Real-Time and Historical Analysis : Works seamlessly with both real-time and historical data Allows for backtesting strategies and live market analysis Visual Representation : Draws rectangles to highlight significant areas on the cha

Volume Profile Indicator for MT4 Gain a trading edge with the "Volume Profile" indicator for MetaTrader 4 (MT4). This advanced technical analysis tool allows you to precisely identify key support and resistance levels based on transaction volume. Easily visualize market areas of high interest, where trading volumes are highest, and use this information to make more informed trading decisions. Key Features: Clear and detailed visualization : The indicator displays volume histograms directly on th

Insight Pro is a comprehensive tool for market analysis. It offers various features such as trend analysis, resistance and support levels, and distribution analysis, suitable for both novice and experienced traders. Features Trend Analysis Detects and visualizes market trends. Suggests potential entry and exit points based on trends. Customizable trend lines for clear market direction. Displays extreme levels based on standard deviation. Positive slope indicates buy orders; negative slope indic
Semnal M1 fără pierderi A
Indicatorul este creat pentru M1.
Semnalele sunt relativ rare, dar de bună calitate.
Succes!
Note Dacă indicatorul nu este afișat, citiți comentariul meu în secțiunea de comentarii pentru a afla cum să faceți acest lucru.
IMPORTANT! Verificați mai întâi indicatorul sau expertul pe un cont DEMO, înainte de a-l cumpăra! Analizați-l bine!
Închiriați-l pentru o perioadă mai scurtă de timp. Pentru a vedea cum funcționează și dacă funcționează pe computer.
Presentation of the "Color Range Indicator" The "Color Range Indicator" is a powerful technical analysis tool designed for the MT4 platform, perfect for traders who want a clear and immediate view of market trends. This indicator draws a colored line based on the current trend, making it easier to interpret price movements. Indicator Description: Green line : Indicates an uptrend. Use this signal to consider buying opportunities. Red line : Indicates a downtrend. Use this signal to consider sell
Trend Analyser Pro is a versatile trend analysis tool designed for traders who want to capitalize on market trends across multiple timeframes. This indicator combines advanced trend detection, dynamic signals, and higher timeframe analysis to provide you with a comprehensive view of market movements, empowering you to make well-informed trading decisions. 50% DISCOUNT - ENDING SOON ! BONUS - Trend Analyser Pro TradingView Indicator - After you purchase or rent this product, please send m

MT4용 외환 표시기 HTF Ichimoku
Ichimoku 지표는 가장 강력한 추세 지표 중 하나입니다. HTF는 더 높은 시간 프레임을 의미합니다. 이 지표는 추세 거래자뿐만 아니라 가격 조치 항목과의 조합에도 탁월합니다. HTF Ichimoku 표시기를 사용하면 더 높은 시간대의 Ichimoku를 현재 차트에 연결할 수 있습니다. 상승 추세 - 파란색 선 위의 빨간색 선(두 선 모두 구름 위에 있음) / 하락 추세 - 파란색 선 아래의 빨간색 선(두 선 모두 구름 아래에 있음) 가격이 Ichimoku Cloud Top 경계를 돌파한 경우에만 매수 주문을 개시하세요. 가격이 Ichimoku 클라우드 하단 경계를 돌파한 경우에만 SELL 주문을 엽니다. HTF Ichimoku Indicator는 큰 추세를 포착할 수 있는 기회를 제공합니다
// 더 훌륭한 전문가 자문 및 지표는 여기에서 확인할 수 있습니다: https://www.mql5.com/en/users/def138
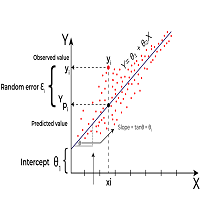
Linear Regression is a statistical method used to model the relationship between two or more variables. The primary goal of Linear Regression is to predict the value of one variable (called the dependent variable or outcome variable) based on the value of one or more other variables (called independent variables or explanatory variables) Linear Regression can be applied to technical analysis, and it is indeed one of the tools used by traders and analysts to make predictions and identify trends i
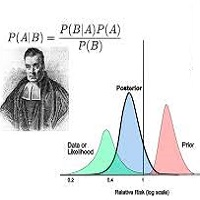
Bayesian methods can be effectively applied to predict price trends in financial markets, including Forex, stocks, and commodities. Here’s how Bayesian techniques can be used for trend prediction: 1. Bayesian Linear Regression Bayesian linear regression can be used to model the relationship between time and price. This method allows for the incorporation of prior beliefs about the trend and updates the trend as new data comes in. Example: Suppose you want to predict the price trend of a curren

-AUDUSD M15 - Every time there is any crossing of the RED lines , it means sell. - Every time there is any crossing of the GREEN lines , it indicates buy.
Discover the Future of Trading with Our Exclusive Indicator! In the dynamic world of financial markets, precision and the ability to anticipate movements are crucial for success. With this in mind, we have developed an exclusive indicator that combines cutting-edge technology with a sophisticated approach to offer you an indispensable to

It is an indicator which notifies via push notification when an order is closed by Take Profit/Stop Loss It indicates via pc alert and or mobile alert Psychologically you can hold order for long time If stop loss hunting happens you can re-enter with same direction If real break out happens you can reverse the position Overall it Alerts when position reach stop - loss or take-profit level

The Accumulation/Distribution (AD) Technical Indicator is a tool used in technical analysis to determine whether an asset is being accumulated (bought) or distributed (sold) in the market. Key Characteristics of the AD Indicator: Purpose: The AD indicator is used to assess the balance between buying (accumulation) and selling (distribution) of an asset. This helps traders and investors evaluate the strength of the current trend and potential reversals. Interpretation: Rising Indicator: When the
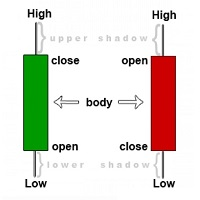
The indicator searches for candles on the price chart that are larger than those specified in the settings and marks them on the chart.
You can choose two types of candle size measurement (Units of Calculation): Points and Percentages. Points - size calculation will be in points. (for a five-digit quote point = 0.00001 and similarly for others)
Percentages - the candle size will be calculated as a percentage. You can also choose between which values to measure (Between Levels):
High/L

Advance Currency Meter is a currency meter that detects strong market trends. This indicator is good for scalping, intraday trading and swing trading. The indicator will detect short term to long term market trends. This will give you good insight which currencies are best to trade as of the moment.
Note : Kindly contact me before you make any purchases. Works well with my MACD Currency Strength Meter

Our new indicator is an important part of the Smart Money Concepts (SMC) system
It uses a modern market vision and fast calculation methods. As a result, the trader has a complete picture of the trade at every moment in time, which makes the process of obtaining results easier and faster.
Our new indicator displays the following important patterns:
Order Blocks. Imbalance – Fair Value Gap (FVG). Break Of Structures (BoS). Change of character (CHoCH). Equal highs & lows. Premium , Equili
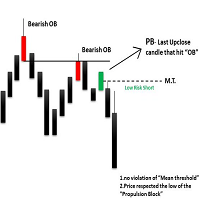
The ICT Propulsion Block indicator is meant to detect and highlight propulsion blocks, which are specific price structures introduced by the Inner Circle Trader (ICT).
Propulsion Blocks are essentially blocks located where prices interact with preceding order blocks. Traders often utilize them when analyzing price movements to identify potential turning points and market behavior or areas of interest in the market.
USAGE (fingure 1) An order block is a significant area on a pric
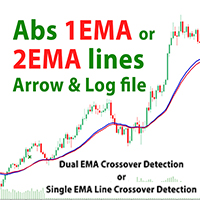
Product: 1 or 2 EMA Lines Crossover Indicator The 2 EMA Lines Crossover Indicator is a powerful and versatile tool designed for MetaTrader 4 (MT4) that helps traders identify potential buy and sell signals based on the crossover of two Exponential Moving Averages (EMAs). This indicator provides visual arrows on the chart to highlight trading opportunities, and it can also log these signals for further analysis. Whether you're a beginner or an experienced trader, this indicator can enhance your t

Heiken Ashi Histo 필터 - 훌륭하고 효율적인 보조 거래 도구입니다!
새로운 고급 계산 방법이 사용됩니다 - "계산 가격" 매개변수에 대한 10가지 옵션 가격 행동 패턴과 결합하기에 탁월함 녹색 히스토그램 - 강세 항목 찾기 마젠타 색상 히스토그램 - 하락세 항목 찾기 이 지표를 사용하면 표준 전략도 업그레이드할 수 있는 기회가 많이 있습니다. 표시기에는 모바일, PC 및 이메일 알림이 내장되어 있습니다. ............................................................................................................................................. // 더 훌륭한 전문가 자문 및 지표는 여기에서 확인할 수 있습니다: https://www.mql5.com/en/users/def1380/seller 본 MQL5 홈페이지에서만 제공되는 오리지널 제품입니다.

Săgețile giganților
Bun venit.
Indicatorul Arrows of Giants funcționează foarte bine pe M15, M30, H1 și H4.
Poate fi experimentat și pe M5.
Succes!
Dacă indicatorul nu este afișat, citiți comentariul meu în secțiunea de comentarii pentru a afla cum să faceți acest lucru.
Verificați mai întâi indicatorul sau expertul pe un cont DEMO, înainte de a-l cumpăra! Analizați-l bine!
Închiriați-l pentru o perioadă mai scurtă de timp. Pentru a vedea cum funcționează și dacă funcționează

MT4용 외환 표시기 내부 바 패턴
지표 "INSIDE Bar"는 가격 행동 거래에 대한 매우 강력한 지표입니다. 표시기는 차트에서 내부 막대 패턴을 감지합니다. Bullish INSIDE Bar - 차트의 파란색 화살표 신호(그림 참조) Bearish INSIDE Bar - 차트의 빨간색 화살표 신호(그림 참조) 다시 칠하지 마세요. 지연 없음; 높은 R/R 비율(보상/위험) PC, 모바일 및 이메일 알림이 포함되어 있습니다. 표시기 "내부 막대 패턴"은 지원/저항 수준과 결합하는 데 탁월합니다
// 더 훌륭한 전문가 자문 및 지표는 여기에서 확인할 수 있습니다: https://www.mql5.com/en/users/def1380/seller 본 MQL5 홈페이지에서만 제공되는 오리지널 제품입니다.

Predator Indicator - M5
Bun venit.
Predator Indicator - M5 este creat pentru intervalul de timp M5, după cum sugerează și numele.
Este un indicator scalping.
Videoclipul arată că a funcționat foarte bine pe EURUSD M5 și nu revopsește.
Succes!
Dacă indicatorul nu este afișat, citiți comentariul meu în secțiunea de comentarii pentru a afla cum să faceți acest lucru.
Verificați mai întâi indicatorul sau expertul pe un cont DEMO, înainte de a-l cumpăra! Analizați-l bine!
Închiriaț

This indicator is based on the Cboe EuroCurrency Volatility Index, also known as Euro VIX and has a ticker symbol of EVZ . It basically measures volatility in the Eur/USD exchange rate but it can be used to track overall volitility in the Forex market. It's best usage is to add it to your system as a mandatory tool, when the value is above 7, you can expect some movement in the market, so you can trade at full risk, when the value is below 7, you trade with less risk or don't trade at all.
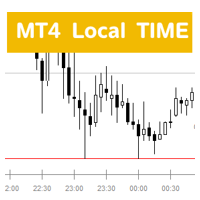
로컬 타임 인디케이터 설명 ( MT4 Local Time H4box )
개요 로컬 타임 인디케이터는 MetaTrader 4 (MT4) 플랫폼을 위해 설계된 사용자 정의 인디케이터로, 사용자가 속한 지역의 현재 로컬 시간을 제공하는 것을 목표로 합니다. 이 인디케이터는 전 세계 트레이더에게 적합하며, 외환 거래를 진행하는 동안 로컬 시간을 신속하게 확인할 수 있도록 하여, 시장의 동향과 거래 기회를 보다 잘 파악할 수 있게 합니다. 또한, 인디케이터에는 4시간 내의 K선 변동을 쉽게 확인할 수 있는 선택적 H4 박스가 포함되어 있습니다.
기능 - **실시간 로컬 시간 표시:** 인디케이터는 실시간으로 업데이트되며, 사용자의 컴퓨터의 로컬 시간을 표시하여 정보의 정확성을 보장합니다. - **높은 적응성:** 사용자가 어느 시간대에 있든, 수동으로 조정하여 해당 로컬 시간을 표시할 수 있어, 시차로 인한 오해를 방지합니다. - **시각적 표시:** 로컬 시간은 그래프

Moving Pivot Average The pivot indicator compares the selected period with its counterpart from the previous period. The indicator uses very flexible algorithm for pivot value calculating. It allows you to allocate in days a certain time intervals (custom bars) and calculate the average pivot value based on High, Low and Close prices of these bars. How many custom bars will be taken into account is determined by the "Days" setting. The pivot line can be considered an average trend line and us
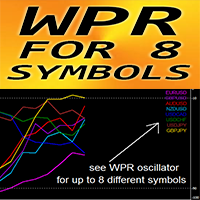
MT4용 외환 표시기 "8개 기호에 대한 WPR", 다시 칠하지 않음
WPR 자체는 스캘핑을 위한 최고의 오실레이터 중 하나입니다. 강력한 OverBought 영역(-10 이상)에서 Sell 항목을 가져오고 강력한 OverSold 영역(-90 미만)에서 Buy 항목을 가져오는 것이 좋습니다. "8개 기호에 대한 WPR"은 하나의 차트에서 최대 8개 기호의 WPR 값을 제어할 수 있는 기회를 제공합니다. 이 지표는 과매도/매수 영역의 가격 조치 항목과도 결합하는 데 탁월합니다.
// 더 훌륭한 전문가 자문 및 지표는 여기에서 확인할 수 있습니다: https://www.mql5.com/en/users/def1380/seller MQL5 홈페이지에서만 제공되는 오리지널 제품입니다.

Scalping M5
Indicatorul M5 Scalping este creat pentru intervalul de timp M5. Poate fi încercat și pe alte intervale de timp.
Este un indicator scalping.
Markerul nu revopsește și dă rezultate bune. Semnalele sunt rare, dar pot fi utilizate pe mai multe perechi.
Succes!
Dacă indicatorul nu este afișat, citiți comentariul meu în secțiunea de comentarii pentru a afla cum să faceți acest lucru.
Verificați mai întâi indicatorul sau expertul pe un cont DEMO, înainte de a-l cumpăra! An

Determining the current trend is one of the most important tasks of a trader, regardless of the trading style. The Creative Trend indicator will help you do this with a fairly high probability. Creative Trend is a trend recognition indicator that uses the author's calculation algorithm. The indicator readings do not change under any conditions. The indicator is suitable for any currency pair, any timeframe, as long as there is enough historical data for calculations. Indicator Parameters
Main S
Semnal SOS
Indicatorul de semnal SOS funcționează foarte bine pe intervalele de timp H1, M30, M15. Poate fi încercat și pe intervalele M5, M1.
Studiu!
Succes!
Note Dacă indicatorul nu este afișat, citiți comentariul meu în secțiunea de comentarii pentru a afla cum să faceți acest lucru.
IMPORTANT! Verificați mai întâi indicatorul sau expertul pe un cont DEMO, înainte de a-l cumpăra! Analizați-l bine!
Închiriați-l pentru o perioadă mai scurtă de timp. Pentru a vedea cum funcționează
Semnale precise
Bun venit!
Indicatorul de semnale precise declanșează semnale perfecte pe intervalele de timp M15 și M30. Pe H1 la fel, dar semnalele sunt mai rare.
De asemenea, funcționează foarte bine pe M5 și chiar pe M1.
Noroc!
Note Dacă indicatorul nu este afișat, citiți comentariul meu în secțiunea de comentarii pentru a afla cum să faceți acest lucru.
IMPORTANT! Verificați mai întâi indicatorul sau expertul pe un cont DEMO, înainte de a-l cumpăra! Analizați-l bine!
Închir
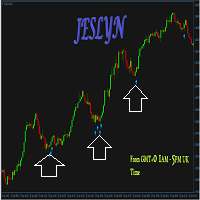
This indicator is the MT4 version based on the MT5 indicator of JES-USDJPY which is used and optimized for USDJPY currency pair. Other currency pairs have similarly optimized software for each currency pair, since they all behave differently even though some pairs share a bit of correlation.
Extensive tests, settings, and videos are available on the MT5 version thread: https://www.mql5.com/en/forum/470202 No MT4 version of JesVersal EA for now.
https://youtu.be/V2KhpUFq8MY Forex profit te

- Real price is 60$ - 50% Discount ( It is 30$ now )
Contact me for instruction, any questions! Introduction Triangle chart patterns are used in technical analysis , which is a trading strategy that involves charts and patterns that help traders identify trends in the market to make predictions about future performance.
Triangle Pattern Scanner Indicator It is usually difficult for a trader to recognize classic patterns on a chart, as well as searching for dozens of charts and tim

Contact me for instruction, any questions! Introduction Chart patterns are an essential tool traders and investors use to analyze the future price movements of securities. One such pattern is the triple bottom or the triple top pattern, which can provide valuable insights into potential price reversals. This pattern forms when a security reaches a low price level three times before reversing upward or reaches a high price level three times before reversing downward.
Triple Top Bottom

M5 Omicron
Bună ziua!
Indicatorul M5 Omicron este creat special pentru M5. Este un indicator complex. Poate fi încercat și pe M1.
Noroc!
Notă Dacă indicatorul nu este afișat, citiți comentariul meu în secțiunea de comentarii pentru a afla cum să faceți acest lucru.
IMPORTANT! Verificați mai întâi indicatorul sau expertul pe un cont DEMO, înainte de a-l cumpăra! Analizați-l bine!
Închiriați-l pentru o perioadă mai scurtă de timp. Pentru a vedea cum funcționează și dacă funcționează p
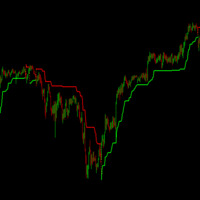
The classic SuperTrend indicator. The best indicator to define trends and small-scale trend changes in any pair and time frame. It is set up in exactly the same way as the TradinView indicator, and can be adjusted and complemented with other indicators to create profitable strategies or expert advisors, or used individually to profit from the market. Based on the average volatility of the last candles and the price movement, it draws a green line below the price if an bullish microtrend is ident
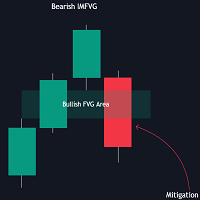
The FVG Instantaneous Mitigation Signals indicator detects and highlights "instantaneously" mitigated fair value gaps (FVG), that is FVGs that get mitigated one bar after their creation, returning signals upon mitigation.
Take profit/stop loss areas, as well as a trailing stop loss are also included to complement the signals.
USAGE Figure 1 Instantaneous Fair Value Gap mitigation is a new concept introduced in this script and refers to the event of price mitigating a fair value gap

The One and Only!, simply the best!, amazing! entry indicator Golden Move. Try it yourself as it proves its quality with its results.
Settings: AlertConfirmation: turns on and off alerts CalculatedBars: how many bars will be calculated Distance : arrow distance
Buffers: Buffer0 (Arrow Buy) Buffer1 (Arrow Sell) Buffer2 (Buy value == 1) Buffer3 (Sell value == 1)
MetaTrader 플랫폼 어플리케이션 스토어에서 MetaTrader 마켓에서 트레이딩 로봇을 구매하는 방법에 대해 알아 보십시오.
MQL5.community 결제 시스템은 페이팔, 은행 카드 및 인기 결제 시스템을 통한 거래를 지원합니다. 더 나은 고객 경험을 위해 구입하시기 전에 거래 로봇을 테스트하시는 것을 권장합니다.
트레이딩 기회를 놓치고 있어요:
- 무료 트레이딩 앱
- 복사용 8,000 이상의 시그널
- 금융 시장 개척을 위한 경제 뉴스
등록
로그인
계정이 없으시면, 가입하십시오
MQL5.com 웹사이트에 로그인을 하기 위해 쿠키를 허용하십시오.
브라우저에서 필요한 설정을 활성화하시지 않으면, 로그인할 수 없습니다.