
3D Modeling in MQL5
3D modeling allows analyzing complex processes and phenomena and forecasting their results.
On financial markets, 3D modeling can be used for example to provide a three-dimensional representation of time series. A time series is a dynamic system, in which values of a random variable are received continuously or at successive equally spaced points in time (ticks, bars, fractals, etc.) In this article, we will consider the three-dimensional visualization of time series and indicators (See Fig. 1).
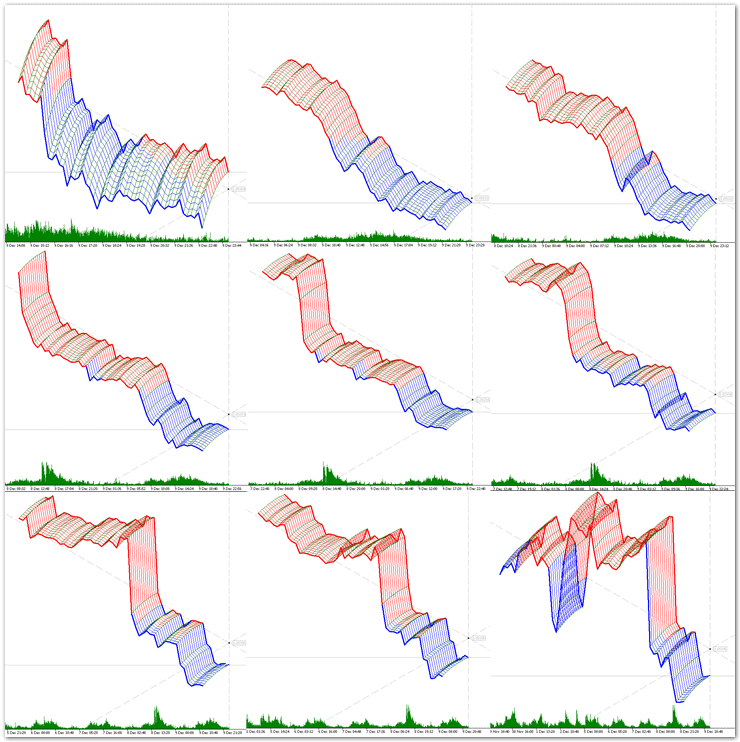
Fig. 1. Examples of three-dimensional representation of time series.
The difference of a three-dimensional model from a two-dimensional display is that it includes a geometrical projection of a 3D model onto a plane using special functions. The following steps are needed in order to create a three-dimensional image on a plane:
- modeling — creating a three-dimensional mathematical model of a time series;
- rendering (visualization) — creating a projection in accordance with a selected model;
- displaying the resulting image on the screen.
The purpose of the article is to show ordinary charts in the three-dimensional space. Currently MQL5 does not provide ready-to-use 3D modeling solutions, therefore we will start with basic principles and methods, including 3D objects and coordinate systems. Many readers might feel skeptical about this topic and therefore skim through the text, however some algorithms and methods from the article can be useful in other tasks not related to the three-dimensional visualization.
An Interactive Graphical Object
We will start with 3D objects. The rich functionality of the MQL5 language allows you to operate with two-dimensional objects and create complex graphical representations. Add a few functions, and three-dimensional graphics will become available in the MetaTrader 5 terminal.
First, we need to determine the requirements that should be met when designing base classes of 3D object.
- Ease of use.
- High persistence.
- Independence.
- Interactivity.
Ease of use.
We need to create a minimum set of functions for the developer and the user, which however should be enough for the most of the purposes of the three-dimensional graphics.
High persistence.
A 3D object must be highly persistent during the entire lifetime of the program that created the class instance. It must be protected against accidental or deliberate deletion, as well as against modification of its basic properties.
Independence.
The object must be "smart" and be able to self-adjust to changing conditions (rotation of the coordinate system, change of basic anchor points, etc.) The object must properly handle incoming information and respond to occurring events accordingly.
Interactivity.
3D visualization involves the ability to change the point from which the three-dimensional model is viewed (the coordinate system rotation). Therefore we need to create the functionality that eliminates the necessity to use additional control panels or something like that. Strictly speaking, graphical objects in the MQL5 language already have the property of interactivity: you can select an object, move it, change its properties, etc. We only need to slightly improve this property to enable collective management and interaction. For example, if we change the center of coordinates, all related objects must be automatically and correctly re-arranged.
If we provide for all these requirements, our 3D object will turn into an interactive graphical object (IGO). The interactive graphical object must be connected with an MQL5 graphical object. Let's start with the CIGO base class of interactive graphical objects.
{
protected:
bool on_event; // Event handling flag
int m_layer; // The layer to which IGO belongs
//---
double SetPrice(double def,int prop_modifier=0);
public:
string m_name; // The name of the IGO object
double m_price; // Basic anchor point of the IGO [price]
double m_angle; // IGO snap angle [deg]
CIGO();
~CIGO();
//---
virtual // Method: creating IGO
void Create(string name) {on_event=true;}
virtual // Method: redrawing IGO
void Redraw() {ChartRedraw();}
virtual // OnChartEvent handling method
bool OnEvent(const int id, // Event ID
const long &lparam, // The event parameter of the long type
const double &dparam, // The event parameter of the double type
const string &sparam, // The event parameter of the string type
int iparamemr=0, // IGO event identifier
double dparametr=0.0);// The IGO event parameter of the double type
};
The base class contains a minimum of fields and methods that can further be overridden or supplemented in child classes. We will only consider in detail two class methods: the virtual method OnEvent() for handling OnChartEvent and the method for setting the basic anchor point SetPrice(). The main principles of interactive graphical object are implemented in these classes.
Method: handling incoming OnEvent events.
The method handles events received from the client terminal when working with the chart. The method responds to four standard events: deleting a graphical object, modifying the chart size or its properties, moving a graphical object or clicking on it. Let us consider in detail each of these events.
- Deleting a graphical object. When this event occurs, the object no longer exists on the chart — it has been deleted. But we have the requirement of persistence, therefore the object must be restored immediately, i.e. the object must be re-created with the same properties that it possessed before deletion. Note: the graphical object is deleted here, not the associated instance of the CIGO class. The class instance continues to exist, and it stores information about the deleted graphical object. So we can easily restore this object by using the Create() method.
- Changing the chart size or properties. There are many events of this type, including the emergence of a new bar, change of chart scale, time-frame switch, and others. The response to such an event should be redrawing of the object in accordance with the updated environment, using the Redraw() method. Note that when you switch to another time-frame, the class instance is re-initialized and it loses data about the created graphical object that were stored in the class fields, although the graphical object still exists on the chart. Therefore the fields of the chart instance are restored using the graphical object properties, which undoubtedly increases the persistence of IGO.
- Moving a graphical object. The interactivity of the graphical object is based on this property. When an object is moved, its basic anchor points change. Before moving an object, we need to select it (by a double click). If the event happened, the method returns true, otherwise false is returned. We will need this value when we organize a collective operation of interactive graphical objects. Note that if we need a graphical object that cannot be moved, we should disable the possibility to select it when creating the object.
- A click on the graphical object. If the mouse was pressed on an object other than this one, the object should be unselected in order to prevent accidental moving. Thus, only one IGO object can be selected on a chart.
bool CIGO::OnEvent(const int id,
const long &lparam,
const double &dparam,
const string &sparam,
int iparamemr=0,
double dparametr=0.0)
{
bool res=false;
if(on_event) // Event processing is allowed
{
// Deleting a graphical object
if((ENUM_CHART_EVENT)id==CHARTEVENT_OBJECT_DELETE && sparam==m_name)
{
Create(m_name);
}
// Changing chart size or modifying hart properties using the properties dialog
if((ENUM_CHART_EVENT)id==CHARTEVENT_CHART_CHANGE)
{
Redraw();
}
// Moving a graphical object
if((ENUM_CHART_EVENT)id==CHARTEVENT_OBJECT_DRAG)
if(ObjectGetInteger(0,sparam,OBJPROP_SELECTED)==1 && sparam==m_name)
{
m_price=ObjectGetDouble(0,m_name,OBJPROP_PRICE);
Redraw();
res=true; // Inform that the basic anchor point changed
}
// A mouse click outside this graphical object
if((ENUM_CHART_EVENT)id==CHARTEVENT_OBJECT_CLICK && sparam!=m_name)
{
ObjectSetInteger(0,m_name,OBJPROP_SELECTED,0);
ChartRedraw();
}
}
return(res);
}
Parameters:
id
[in] The event id. There are 9 types of events that can be handled using this method.
lparam
[in] An event parameter of the long type.
dparam
[in] An event parameter of the double type.
sparam
[in] An event parameter of the string type.
iparametr
[in] Custom event identifier.
dparametr
[in] A custom event parameter of the long type.
Return value:
Returns true if coordinates of the basic anchor point of the object have changed. Otherwise returns false.
Method: setting coordinates of the basic anchor point SetPrice.
Sets the "price" value in the "Chart" coordinate system for the m_price field of the class instance.
Let me explain what happens when the coordinate of the basic anchor point is requested by this method.
- During class instance initialization, the m_price field (basic point coordinate) does not contain any input value, and therefore m_price=NULL. Initialization is performed either when a class instance is created, or when the chart time-frame is switched. The graphical object may exist on the chart. It may exist on the chart since the previous program call or after switching the time-frame. So the value of the corresponding property of the graphical object is assigned to the m_price field.
- If a graphical object with the name m_name does not exist, the coordinate of the basic anchor point is still not defined after the first step: m_price=NULL. In this case the m_price field is set to the default def value.
{
if(m_price==NULL) // If there is no value of the variable
m_price=ObjectGetDouble(0,m_name,OBJPROP_PRICE,prop_modifier);
if(m_price==NULL) // If there are no coordinates
m_price=def; // The default value
return(m_price);
}
Parameters:
def
[in] The default value of the variable.
prop_modifier
[in] The modifier of the requested property of the graphical object.
Return value:
The value of the coordinate of the basic anchor point.
Now we look at the child classes of the base class of interactive objects. First of all we are interested in 3D objects for creating a required environment for three-dimensional modeling.
The C_OBJ_ARROW_RIGHT_PRICE class: "Right Price Label" object
Derived from the CIGO base class.
//| Class OBJ_ARROW_RIGHT_PRICE: object "Right Price Label" |
//+------------------------------------------------------------------+
class C_OBJ_ARROW_RIGHT_PRICE:public CIGO
{
public:
virtual // Method: creating the object
void Create(string name);
virtual // Method: redrawing the object
void Redraw();
};
//+------------------------------------------------------------------+
//| Method: creating the object |
//+------------------------------------------------------------------+
void C_OBJ_ARROW_RIGHT_PRICE::Create(string name)
{
m_name=name;
m_price=SetPrice((ChartGetDouble(0,CHART_PRICE_MAX)+ChartGetDouble(0,CHART_PRICE_MIN))/2);
ObjectCreate(0,m_name,OBJ_ARROW_RIGHT_PRICE,0,0,0);
ObjectSetInteger(0,m_name,OBJPROP_SELECTABLE,true);
ObjectSetInteger(0,m_name,OBJPROP_WIDTH,1);
ObjectSetInteger(0,m_name,OBJPROP_COLOR,clrISO);
//---
ObjectSetInteger(0,m_name,OBJPROP_TIME,0,T(0));
ObjectSetDouble(0,m_name,OBJPROP_PRICE,0,m_price);
//---
ChartRedraw();
on_event=true; // Allow event handling
}
//+------------------------------------------------------------------+
//| Method: redrawing the object |
//+------------------------------------------------------------------+
void C_OBJ_ARROW_RIGHT_PRICE::Redraw()
{
ObjectSetInteger(0,m_name,OBJPROP_TIME,0,T(0));
ChartRedraw();
}
This is the best suiting class for organizing the center of the three-dimensional coordinate system. The class instance is linked to the current bar and is actually on the Z axis.
Class C_OBJ_TREND: the "Trendline" object
Derived from the CIGO base class.
//| Class OBJ_TREND: the "Trendline" object |
//+------------------------------------------------------------------+
class C_OBJ_TREND:public CIGO
{
public:
virtual // Method: creating the object
void Create(string name);
virtual // Method: redrawing the object
void Redraw();
};
//+------------------------------------------------------------------+
//| Method: creating the object |
//+------------------------------------------------------------------+
void C_OBJ_TREND::Create(string name)
{
m_name=name;
m_price=(ChartGetDouble(0,CHART_PRICE_MAX)+ChartGetDouble(0,CHART_PRICE_MIN))/2;
ObjectCreate(0,m_name,OBJ_TREND,0,0,0);
ObjectSetInteger(0,m_name,OBJPROP_COLOR,clrISO);
ObjectSetInteger(0,m_name,OBJPROP_WIDTH,0);
ObjectSetInteger(0,m_name,OBJPROP_STYLE,styleISO);
ObjectSetDouble(0,m_name,OBJPROP_PRICE,0,m_price);
ObjectSetInteger(0,m_name,OBJPROP_TIME,0,T(0));
ObjectSetDouble(0,m_name,OBJPROP_PRICE,1,m_price+1);
ObjectSetInteger(0,m_name,OBJPROP_TIME,1,T(0));
ObjectSetInteger(0,m_name,OBJPROP_RAY_RIGHT,true);
ObjectSetInteger(0,m_name,OBJPROP_RAY_LEFT,true);
ObjectSetInteger(0,m_name,OBJPROP_BACK,true);
ObjectSetInteger(0,m_name,OBJPROP_SELECTABLE,false);
//---
ChartRedraw();
on_event=true; // Allow event handling
}
//+------------------------------------------------------------------+
//| Method: redrawing the object |
//+------------------------------------------------------------------+
void C_OBJ_TREND::Redraw()
{
ObjectSetInteger(0,m_name,OBJPROP_TIME,0,T(0));
ObjectSetInteger(0,m_name,OBJPROP_TIME,1,T(0));
ChartRedraw();
}
It is logical to create the Z axis using this class. The class provides a minimum of possibilities, but they are enough for 3D modeling purposes.
Class C_OBJ_TRENDBYANGLE: the "Trendline by angle" object
Derived from the CIGO base class.
//| Class OBJ_TRENDBYANGLE: the "Trendline by angle" object |
//+------------------------------------------------------------------+
class C_OBJ_TRENDBYANGLE:public CIGO
{
protected:
int m_bar; // the bar number to link the second basic point
//---
double SetAngle(double def)
{
if(m_angle==NULL) // If there is no value of the variable
m_angle=ObjectGetDouble(0,m_name,OBJPROP_ANGLE);
if(m_angle==NULL) // If there are no coordinates
m_angle=def; // The default value
return(m_angle);
}
public:
C_OBJ_TRENDBYANGLE();
virtual // Method: creating the object
void Create(string name,double price,double angle);
virtual // Method: redrawing the object
void Redraw();
virtual // OnChartEvent handling method
bool OnEvent(const int id,
const long &lparam,
const double &dparam,
const string &sparam,
int iparamemr=0,
double dparametr=0.0);
};
//+------------------------------------------------------------------+
//| Constructor |
//+------------------------------------------------------------------+
C_OBJ_TRENDBYANGLE::C_OBJ_TRENDBYANGLE()
{
m_bar=c_bar;
}
//+------------------------------------------------------------------+
//| Method: creating the object |
//+------------------------------------------------------------------+
void C_OBJ_TRENDBYANGLE::Create(string name,double price,double angle)
{
datetime time=T(0);
datetime deltaT=T(m_bar)-time;
m_name=name;
m_price=SetPrice(price);
m_angle=SetAngle(angle);
ObjectCreate(0,m_name,OBJ_TRENDBYANGLE,0,time,m_price,time+deltaT,m_price);
ObjectSetInteger(0,m_name,OBJPROP_COLOR,clrISO);
ObjectSetInteger(0,m_name,OBJPROP_WIDTH,0);
ObjectSetInteger(0,m_name,OBJPROP_STYLE,styleISO);
ObjectSetInteger(0,m_name,OBJPROP_RAY_RIGHT,true);
ObjectSetInteger(0,m_name,OBJPROP_RAY_LEFT,true);
ObjectSetInteger(0,m_name,OBJPROP_BACK,true);
ObjectSetInteger(0,m_name,OBJPROP_SELECTABLE,true);
//--- Changing the trend line slope; while changing the slope the coordinate of the second
//--- point of the line will be automatically determined in accordance with the new angle
ObjectSetDouble(0,m_name,OBJPROP_ANGLE,m_angle);
ChartRedraw();
//---
on_event=true; // Allow event handling
}
//+------------------------------------------------------------------+
//| Method: redrawing the object |
//+------------------------------------------------------------------+
void C_OBJ_TRENDBYANGLE::Redraw()
{
ObjectSetInteger(0,m_name,OBJPROP_TIME,T(0));
ObjectSetInteger(0,m_name,OBJPROP_TIME,1,T(0)+T(m_bar)-T(0));
ObjectSetDouble(0,m_name,OBJPROP_PRICE,m_price);
ObjectSetDouble(0,m_name,OBJPROP_ANGLE,m_angle);
ChartRedraw();
}
//+------------------------------------------------------------------+
//| OnChartEvent handling method |
//+------------------------------------------------------------------+
bool C_OBJ_TRENDBYANGLE::OnEvent(const int id,
const long &lparam,
const double &dparam,
const string &sparam,
int iparamemr=0,
double dparametr=0.0)
{
//---
bool res=false;
if(on_event) // Event handling is allowed
{
// Deleting a graphical object
if((ENUM_CHART_EVENT)id==CHARTEVENT_OBJECT_DELETE && sparam==m_name)
{
Create(m_name,m_price,m_angle);
}
// Deleting a graphical object
if((ENUM_CHART_EVENT)id==CHARTEVENT_CHART_CHANGE)
{
Redraw();
}
// Moving a graphical object
if((ENUM_CHART_EVENT)id==CHARTEVENT_OBJECT_DRAG)
{
//---
if(ObjectGetInteger(0,sparam,OBJPROP_SELECTED)==1 && sparam==m_name)
{
m_angle=ObjectGetDouble(0,m_name,OBJPROP_ANGLE);
Create(m_name,m_price,m_angle);
res=true; // Inform that the basic anchor point changed
}
if(iparamemr==Event_1)// A message about the change of a basic point received
{
m_price=dparametr;
Create(m_name,m_price,m_angle);
}
if(iparamemr==Event_2)// A message about the change of a basic angle received
{
m_angle=dparametr;
Create(m_name,m_price,m_angle);
}
}
// A mouse click outside this graphical object
if((ENUM_CHART_EVENT)id==CHARTEVENT_OBJECT_CLICK && sparam!=m_name)
{
ObjectSetInteger(0,m_name,OBJPROP_SELECTED,0);
ChartRedraw();
}
}
return(res);
}
It was originally planned to use child classes of "trend line" for the X and Y axes. But it became then clear that "Trendline by angle" is a perfect solution for these purposes. I discovered this powerful tool while reading MQL5 language documentation: once a trendline by angle is drawn, it remains unchanged even if time-frame is switched or chart scale is changed, i.e. the angle remains the same.
Conclusion: Read documentation carefully, and you will discover a lot of useful functions and tools.
Graphical Memory (GM)
The article "Statistical distributions in the form of histograms without indicator buffers and arrays" provides description of the graphical memory and some examples. Here I will repeat the basic principle: graphical object properties can store required information for use in other objects and program functions.
The following class was created for ease of programming and practical application of the graphical memory:
{
private:
public:
string m_name; // The name of the graphical object
CGM(){}
~CGM(){}
void Create(string name) {m_name=name;}
// Reading the OBJPROP_PRICE property
double R_OBJPROP_PRICE(int prop_modifier=0)
{
return(ObjectGetDouble(0,m_name,OBJPROP_PRICE,prop_modifier));
}
// Reading the OBJPROP_TIME property
datetime R_OBJPROP_TIME(int prop_modifier=0)
{
return((datetime)ObjectGetInteger(0,m_name,OBJPROP_TIME,prop_modifier));
}
// Reading the OBJPROP_ANGLE property
double R_OBJPROP_ANGLE()
{
return(ObjectGetDouble(0,m_name,OBJPROP_ANGLE));
}
// Reading the OBJPROP_TEXT property
string R_OBJPROP_TEXT()
{
return(ObjectGetString(0,m_name,OBJPROP_TEXT));
}
// Returns the price value for the specified time
double R_ValueByTime(datetime time)
{
return(ObjectGetValueByTime(0,m_name,time));
}
// Writing the OBJPROP_TEXT property
void W_OBJPROP_TEXT(string text)
{
ObjectSetString(0,m_name,OBJPROP_TEXT,text);
}
};
As you can see from the code, it contains methods for reading and writing graphical object properties. The class is linked to a graphical object during creation, and it allows receiving/transmitting the necessary information for any interactive graphical objects that need these messages. For example
- we have created a 3D object called A, to which an instance of the graphical memory class AA is linked;
- now we create a 3D object called B, which can get the required information about the A object through AA. There is no direct link between objects A and B, but the AA class instance allowed to implement transmission of important data from A to B;
- while creating the B object, an instance of the BB graphical memory class is created. Now the A object can access the necessary information of the B object;
- etc. The number of objects is nit limited, while each of the objects is able to receive and send information using the instances of the graphical memory class.
Graphical memory can be metaphorically represented as a bulletin board on which certain information supply and demand notices are placed. This method provides data exchange between interactive graphical objects. What data will be required for a correct performance of a 3D object data is programmed at the stage of 3D model designing. The most valuable information belongs to the objects of the coordinate system, because when rotating or moving the center of coordinates, the whole "pack" of 3D objects should change their properties and location in three-dimensional space.
See how the graphical memory is used in the class of the interactive coordinate system CUSC.
Coordinate System
A three-dimensional visual analysis allows you to analyze data in the 3D space: for example, to build a three-dimensional image of a source data sequence (observations) for one or more selected variables. The selected variables are presented along the Y axis, observations are presented along the Y axis, and the values of variables (for this observation) are plotted along the Z axis.
Such three-dimensional charts are used to visualize the sequences of values of several variables.
The main advantage of three-dimensional representation as compared to two-dimensional multiple line graphs is that it is easier to recognize separate value sequences of some data sets using a three-dimensional image. With the right angle, which can be chosen for example by using interactive rotation, the chart lines do not overlap and are not displayed one over another, as it often happens with two-dimensional multiple line graphs.
Before we proceed to 3D modeling, let's look at the coordinate system, which we will have to work with. Two coordinate systems "Chart" and "Canvas" are provided by MQL5 language developers. We will additionally implement a three-dimensional system (an axonometric projection). So, let us consider the differences and the purpose of each of them.
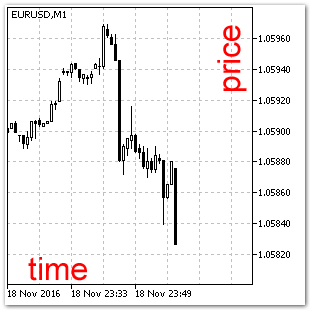
Fig. 2. The "Chart" coordinate system.
The "Chart" coordinate system (Fig. 2). It is a two-dimensional coordinate system for displaying price data, time series and indicators. A time scale is located on the horizontal axis, it is directed from left to right. The vertical axis features the price of a financial instrument. Most of MQL5 graphical objects operate in this coordinate system. The current price and the bar are located on the same vertical axis, and when a new bar appears, the chart is automatically shifted to the left.
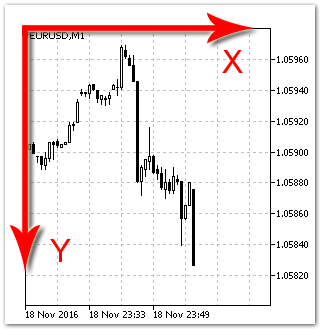
Fig. 3. The "Canvas" coordinate system.
The "Canvas" coordinate system (Fig. 3). Each point on the screen corresponds to one pixel. Coordinates of points are counted from the upper left corner of the chart. This system is also two-dimensional, and it is used by objects not linked to time series. We will not use this system in our article.
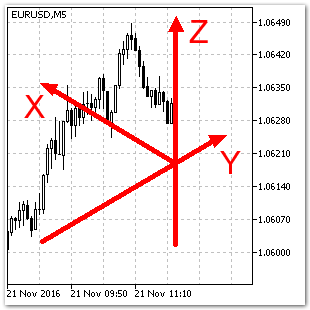
Fig. 4. A three-dimensional coordinate system.
A three-dimensional coordinate system (Fig. 4). In this coordinate system, three axes are perpendicular to each other. However, in the "Canvas" coordinate system the angles between the XYZ axes do not look equal to 90 degrees. For example, X and Y form an angle of 120 degrees. This angle may be different, but we will use the above value within this article.
The Z axis is linked to the current bar, and the axis scale corresponds to the "price" scale in the "Chart" coordinate system. It is very convenient, because there is no need to create a separate scale for the Z axis. We can use the "price" scale instead, so Z=price.
The X axis is directed from left to right, i.e. opposite to the "time" scale in the "Chart" coordinate system. The value of the Bar variable will be presented along this article; so projection of any bar onto the X axis will be equal to its value (X=Bar).
The Y axis is used for the series of two-dimensional XZ data. For example, we can plot the lines of the Open, Close, High and Low time series along this axis, and each of the lines will locate in a separate plane. By connecting all points of these lines in planes parallel to the YZ plane, we will receive a grid, i.e. a three-dimensional time series object (See Fig. 5).
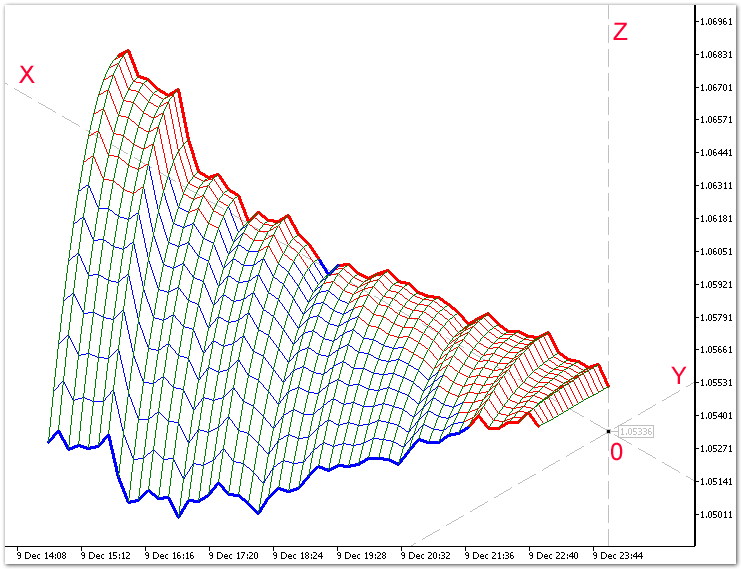
Fig. 5. A 3D object in the three-dimensional coordinate system.
An Interactive Coordinate System: Class CUSC
Derived from the CIGO base class.
{
private:
datetime m_prev_bar;
datetime m_next_bar;
//---
C_OBJ_ARROW_RIGHT_PRICE Centr; // Declaring an instance of class C_OBJ_ARROW_RIGHT_PRICE
C_OBJ_TREND AxisZ; // Declaring an instance of class C_OBJ_TREND
C_OBJ_TRENDBYANGLE AxisY,AxisX; // Declaring instances of class C_OBJ_TRENDBYANGLE
//---
CGM gCentr; // Declaring an instance of class CGM
CGM gAxisY,gAxisX; // Declaring instances of class CGM
public:
CUSC();
~CUSC();
//--- Calculating the Z coordinate
sPointCoordinates Z(double price, // Price in the "Chart" coordinate system
int barX, // Shift along the X axis
int barY); // Shift along the Y axis
//--- A new bar
bool on_bar()
{
m_next_bar=T(0);
if(m_next_bar>m_prev_bar)
{
m_prev_bar=m_next_bar;
return(true);
}
return(false);
}
//---
virtual // Method: creating an IGO object
void Create(string name);
virtual // OnChartEvent handling method
void OnEvent(const int id,
const long &lparam,
const double &dparam,
const string &sparam);
};
Let us take a closer look at the following methods of the class: Create(), OnEvent(), and Z().
The Create method: creating a three-dimensional coordinate system
Creates a 3D object of the interactive coordinate system. Interactivity includes: rotation of the coordinate system around the Z axis and moving the point of origin.
{
//--- The center of the three-dimensional coordinate system
Centr.Create("Axis XYZ"); // Creating the center of the coordinate system
gCentr.Create(Centr.m_name); // Creating an object of the graphical memory
m_price=gCentr.R_OBJPROP_PRICE();
//--- The Z axis
AxisZ.Create("Axis Z"); // Creating the Z axis of the coordinate system
//--- The Y axis
AxisY.Create("Axis Y", // Creating the Y axis of the coordinate system
gCentr.R_OBJPROP_PRICE(), // Getting a value from GM
30); // Setting the axis slope to 30 degree
gAxisY.Create(AxisY.m_name); // Creating a graphical memory object
m_angle=gAxisY.R_OBJPROP_ANGLE();
//--- The X axis
AxisX.Create("Axis X", // Creating the X axis of the coordinate system
gCentr.R_OBJPROP_PRICE(), // Getting a value from GM
gAxisY.R_OBJPROP_ANGLE()+ISO); // Getting a value from GM and increasing it by ISO degrees
gAxisX.Create(AxisX.m_name); // Creating a graphical memory object
//---
ChartRedraw();
on_event=true; // Allow event handling
}
Parameters:
name
[in] The name of the coordinate system.
Return value:
No return value. An interactive coordinate system is created in case of success.
The OnEvent method: processing incoming messages
The method handles events received from the client terminal when working with the chart. The method only responds to one standard event: moving a graphical object. Other events are then transmitted further to all instances of classes created when programming the coordinate system.
const long &lparam,
const double &dparam,
const string &sparam)
{
if(on_event) // Event handling is allowed
{
//--- Passing OnChartEvent events
AxisZ.OnEvent(id,lparam,dparam,sparam);
//---
if(Centr.OnEvent(id,lparam,dparam,sparam))
{// Moving a graphical object
AxisY.OnEvent(id,lparam,dparam,sparam,Event_1,gCentr.R_OBJPROP_PRICE());
AxisX.OnEvent(id,lparam,dparam,sparam,Event_1,gCentr.R_OBJPROP_PRICE());
}
else
{
if(AxisY.OnEvent(id,lparam,dparam,sparam))
{// Changing the angle of the graphical object
AxisX.OnEvent(id,lparam,dparam,sparam,Event_2,gAxisY.R_OBJPROP_ANGLE()+ISO);
}
else
{
if(AxisX.OnEvent(id,lparam,dparam,sparam))
{// Changing the angle of the graphical object
AxisY.OnEvent(id,lparam,dparam,sparam,Event_2,gAxisX.R_OBJPROP_ANGLE()-ISO);
}
}
}
ChartRedraw();
m_price=gCentr.R_OBJPROP_PRICE();
m_angle=gAxisY.R_OBJPROP_ANGLE();
}
}
Parameters:
id
[in] The event id. There are 9 types of events that can be handled using this method.
lparam
[in] An event parameter of the long type.
dparam
[in] An event parameter of the double type.
sparam
[in] An event parameter of the string type.
iparametr
[in] Custom event identifier.
dparametr
[in] A custom event parameter of the long type.
Return value:
No return value.
A structure for receiving the values of coordinates (sPointCoordinates).
A structure for storing the values of coordinates in the "Chart" coordinates system. The structure allows getting the coordinates of a 3D point.
{
datetime time; // a coordinate in the "Chart" system
double price; // a coordinate in the "Chart" system
};
A variable of the sPointCoordinates type allows getting the coordinates of a 3D point in the Chart coordinate system in one call of the Z() function.
The Z method: calculating the Z coordinate.
The method calculates the Z coordinate.
{
sPointCoordinates res;
res.price=0;
res.time=0;
double dX,dY;
dX=0;
dX=gAxisX.R_ValueByTime(T(barX))-m_price;
dY=0;
dY=gAxisY.R_ValueByTime(T(-barY))-m_price;
res.price=price+dX-dY;
res.time=T(barX-barY);
return(res);
}
Parameters:
price
[in] The Z coordinate of a 3D object.
barX
[in] The X coordinate of a 3D object. The value is set in bars.
barY
[in] The Y coordinate of a 3D object. The value is set in bars.
Return value:
If the function succeeds, the value of the sPointCoordinates type variable is returned.
Creating a 3D Surface in Grid Form
As an example, let us consider constructing a three-dimensional surface based on the following function:
#define StepX 10 // Step along the X axis [bar]
#define StepY 5 // Step along the Y axis [bar]
#define _X 50 // Number of points along the X axis
#define _Y 15 // Number of points along the Y axis
#define W1 1 // Line width
#define W2 3 // Width of last lines
//--- Including the files of classes
#include <3D\USC.mqh>
//---
#property indicator_chart_window
//--- Number of buffers for the indicator calculation
#property indicator_buffers 0
//--- Number of graphical series in the indicator
#property indicator_plots 0
//---
CUSC USC;
double fun[_X][_Y];
//+------------------------------------------------------------------+
//| Custom indicator initialization function |
//+------------------------------------------------------------------+
int OnInit()
{
USC.Create("3D");
//---
return(INIT_SUCCEEDED);
}
//+------------------------------------------------------------------+
//| Custom indicator iteration function |
//+------------------------------------------------------------------+
int OnCalculate(const int rates_total,
const int prev_calculated,
const datetime &time[],
const double &open[],
const double &high[],
const double &low[],
const double &close[],
const long &tick_volume[],
const long &volume[],
const int &spread[])
{
ArraySetAsSeries(close,true);
//--- The 3D surface function
for(int i=0;i<_X;i++)
for(int j=0;j<_Y;j++)
{
fun[i][j]=close[i*StepX]-_Point*j*j;
//fun[i][j]=close[i*StepX]-_Point*j*j*i/7;
}
////--- X lines
for(int i=1;i<_X;i++)
for(int j=0;j<_Y;j++)
{
sPointCoordinates a0=USC.Z(fun[(i-1)][j], // Function
(i-1)*StepX, // X
-j*StepY); // Y
sPointCoordinates a1=USC.Z(fun[i][j], // Function
i*StepX, // X
-j*StepY); // Y
string name="line x "+"x"+(string)i+"y"+(string)+j;
ObjectCreate(0,name,OBJ_TREND,0,a0.time,a0.price,a1.time,a1.price);
if(fun[i][j]>USC.m_price && fun[i-1][j]>USC.m_price)
ObjectSetInteger(0,name,OBJPROP_COLOR,clrRed);
else
ObjectSetInteger(0,name,OBJPROP_COLOR,clrBlue);
ObjectSetInteger(0,name,OBJPROP_WIDTH,W1);
if(j==0 || j==_Y-1)
ObjectSetInteger(0,name,OBJPROP_WIDTH,W2);
ObjectSetInteger(0,name,OBJPROP_STYLE,STYLE_SOLID);
ObjectSetInteger(0,name,OBJPROP_RAY_RIGHT,false);
ObjectSetInteger(0,name,OBJPROP_RAY_LEFT,false);
ObjectSetInteger(0,name,OBJPROP_BACK,true);
ObjectSetInteger(0,name,OBJPROP_SELECTABLE,false);
}
////--- Y lines
for(int i=0;i<_X;i++)
for(int j=1;j<_Y;j++)
{
sPointCoordinates a0=USC.Z(fun[i][j-1], // Function
i*StepX, // X
-(j-1)*StepY); // Y
sPointCoordinates a1=USC.Z(fun[i][j], // Function
i*StepX, // X
-j*StepY); // Y
string name="line y "+"x"+(string)i+"y"+(string)+j;
ObjectCreate(0,name,OBJ_TREND,0,a0.time,a0.price,a1.time,a1.price);
ObjectSetInteger(0,name,OBJPROP_COLOR,clrGreen);
ObjectSetInteger(0,name,OBJPROP_WIDTH,1);
ObjectSetInteger(0,name,OBJPROP_STYLE,STYLE_SOLID);
ObjectSetInteger(0,name,OBJPROP_RAY_RIGHT,false);
ObjectSetInteger(0,name,OBJPROP_RAY_LEFT,false);
ObjectSetInteger(0,name,OBJPROP_BACK,true);
ObjectSetInteger(0,name,OBJPROP_SELECTABLE,false);
}
//--- return value of prev_calculated for next call
return(rates_total);
}
//+------------------------------------------------------------------+
//| ChartEvent function |
//+------------------------------------------------------------------+
void OnChartEvent(const int id,
const long &lparam,
const double &dparam,
const string &sparam)
{
USC.OnEvent(id,lparam,dparam,sparam);
}
The lines in planes parallel to the XZ and YZ plane are drawn separately. You can try to change the number of nods along each of the axis and the function itself.
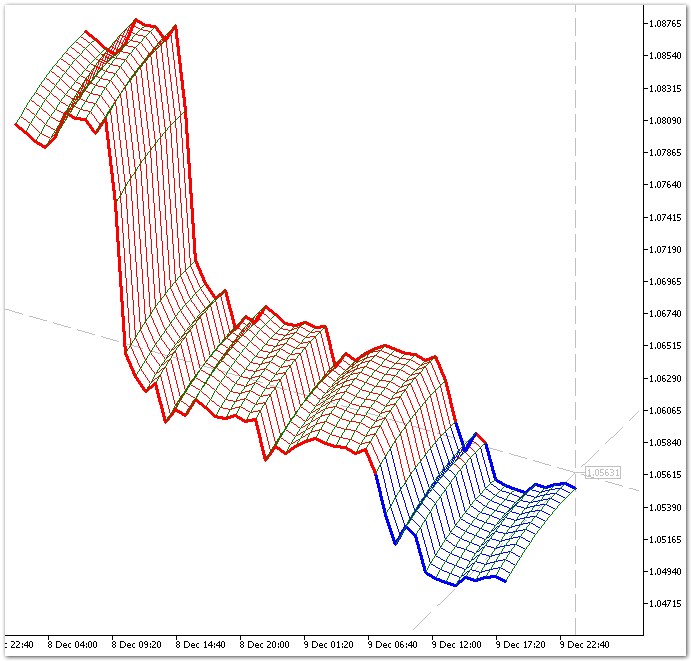
Fig. 6. Drawing a 3D surface.
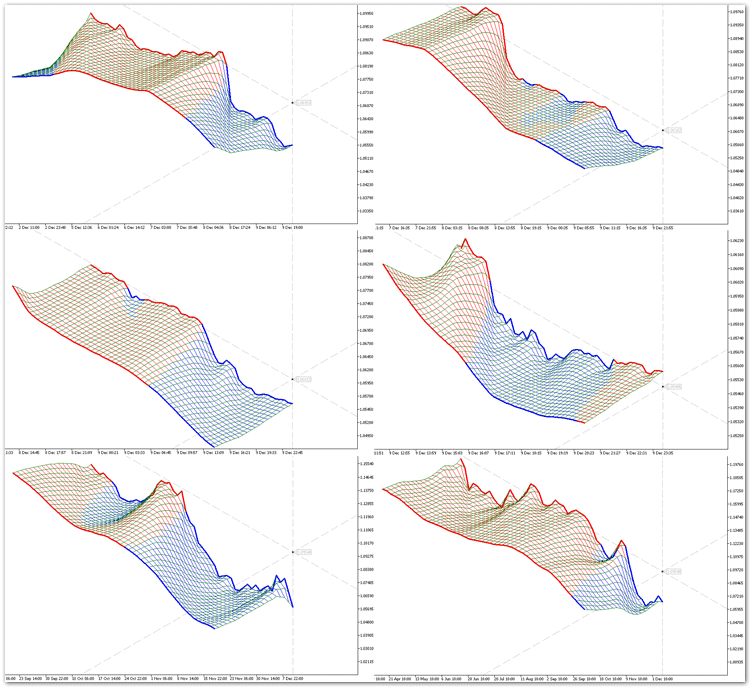
Fig. 7. Drawing a 3D Moving Average.
Here is the answer to the skeptics: Why do we need 3D modeling and how can it help in trading?
Of course, the MetaTrader 5 terminal is designed for trading on financial markets. Traders and automated trading system developers are primarily interested in trading algorithms and creation of profitable strategies. The discussed techniques are still in their infancy, and will not bring any particular trading result, but the 3D modeling can be used to help you present your trading ideas and strategies to potential investors. In addition, the terminal allows creating dynamic 3D models that respond to the flow of market information, and change their form over time (by rebuilding their bodies), which allows creating 3D indicators.
It is similar to Windows: the first versions of the system were slow and crocky. Norton Commander fans were rather skeptical of graphical interfaces. And where is NC now?
Conclusion
- 3D modeling is a rather difficult task in any programming environment, but the developers of the MQL5 language are proactive, they have provided users with a powerful functionality allowing to implement three-dimensional visualization in the trading terminal.
- We have received only the first results of programming a library of 3D object classes. The 3D modeling sphere is so broad that a single article is not enough to cover all of its possibilities. Hopefully, 3D modeling followers will suggest ways of developing the 3D direction in trading and in MQL5 programming.
- The 3D modeling tool created in the article can have a significant impact on the development of the new direction in technical analysis: three-dimensional indicators and their analysis.
- There are some problems with the speed of rendering, but they are not critical at this stage of library development.
- The principle of creation of 3D objects suggested in the article can probably be transfered to OpenCL.
Note:
The library files should be saved to the ..\Include\3D folder.
Translated from Russian by MetaQuotes Ltd.
Original article: https://www.mql5.com/ru/articles/2828
 Auto detection of extreme points based on a specified price variation
- Free trading apps
- Over 8,000 signals for copying
- Economic news for exploring financial markets
You agree to website policy and terms of use