
Statistical distributions in the form of histograms without indicator buffers and arrays
Introduction
Histograms allow researchers to visually evaluate the distribution of statistical data grouped by the frequency of their penetration into a certain (predetermined) interval.
Histograms and their use in the statistical data analysis are a well-studied topic with multiple articles devoted to it [1, 2, 3, 4, 5, 6, 7] and a large number of CodeBase examples [1, 2, 3, 4, 5, 6, 7, 8, 9, 10]. However, applied algorithms are based on using indicator buffers or arrays. In this article, we consider the possibility of building statistical distributions of different market characteristics without complicated calculations, sorting, sampling, etc. In order to achieve this, we will use the "graphical" memory — the section storing the properties of graphical objects. Since we need graphical objects when plotting custom histograms, we can use their "hidden" abilities and rich functionality to full capacity.
The article's objective is to offer simple solutions to standard statistical problems. The article focuses mainly on visualization of statistical distributions and their basic characteristics. We are not going to dwell on histograms interpretation and their practical advantages.
Histogram plotting basics
A histogram is a bar chart of frequencies. One of the axes represents variable values, while another — the frequency of these values' occurrence. The height of each bar shows the frequency (number) of values belonging to the respective interval equal to the column width. Such diagrams are usually displayed horizontally, i.e. variable values are located on a horizontal axis, while frequency — on a vertical one. Using histograms to represent studied data makes statistical data more visible, as well as easier to comprehend and analyze.
In this article, we will focus on the vertical histograms of the variation series: price values of the analyzed parameters are to be located on the vertical axis in ascending order, while frequency is to be located on the horizontal axis (Fig. 1). Incoming price data are distributed and grouped on the current bar and can be displayed relative to its axis from the left, right or both sides simultaneously.
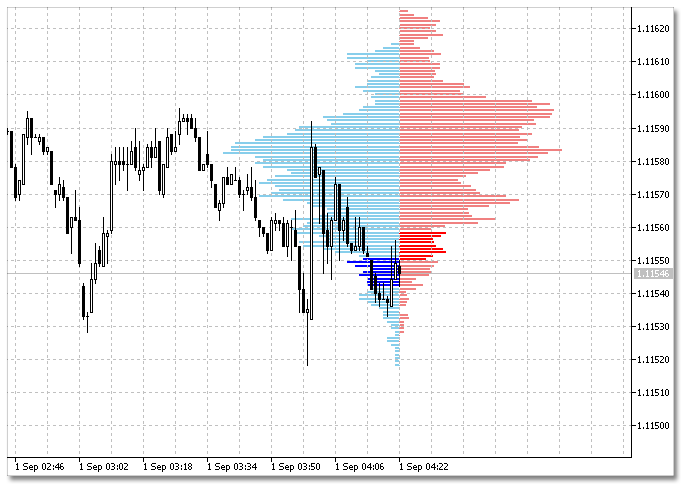
Fig. 1. Vertical histogram of Bid and Ask prices distribution
Let's consider a specific task:
- plot the Bid and Ask prices distribution histogram;
- locate Ask price data to the right of the current bar, while Bid — to the left;
- calculate the frequency of each incoming price value when a new tick arrives, i.e. the histogram interval is equal to the current symbol's point size.
Now, let's make the condition more complicated: no indicator buffers, arrays or structures are allowed.
How to solve this problem?
First, we need to figure out where to store the accumulated frequency for each histogram column. Even on Fig. 1, we can see that there may be an indefinite number of histogram bars. The first thing that comes to mind is to use a dynamic array since the possible price range (number of bars) on the selected time interval of a price chart is not known in advance. But arrays are not allowed by the problem conditions.
Second, we should solve the search and sorting task: where and how to search for data for the histogram recalculation and redrawing.
It turns out the MQL5 language developers have already created the necessary (and quite powerful) functionality. It is based on using "hidden" (unobvious) features of the graphical object function groups. Each object has its properties — the variables created together with the object and used for storing various multiple parameters. Some properties can be used not quite for their designated purpose, while keeping the functionality intact. Let's call these properties the "graphical" memory. In other words, if you need to save a variable and receive its value, create a graphical object and assign the variable value to a certain property.
Thus, graphical object properties act as a more efficient kind of the terminal global variables. The global variables exist in the client terminal for four weeks since the last access to them and are automatically deleted afterwards. The graphical memory exists till a graphical object is removed, thus providing us with ample opportunities.
What graphical object properties can we use in the graphical memory
When creating a graphical object, we should assign a unique name to it. The name is a text string which may consist of substrings, while a substring in turn may contain formatted basic data types: integer, boolean, floating-point, color, date and time. Thus, OBJPROP_NAME can store variables mainly for reading data.
Yet another property that can be used is the OBJPROP_TEXT object description. This is also a text string with much greater possibilities as compared to the previous property. Both reading and writing variables are allowed in the property field.
Any graphical object has its own coordinates: price OBJPROP_PRICE and time OBJPROP_TIME. They can also be used in the graphical memory.
Let's get back to our objective. The frequencies are to be stored in the OBJPROP_TEXT property, while Bid and Ask prices — in the OBJPROP_NAME. The code of the function creating objects and collecting the frequencies is provided below:
void DrawHistogram(bool draw,     // draw a histogram to the left or to the right
                   string h_name, // unique prefix for the object name
                   double price,  // price (analyzed parameter)
                   datetime time, // bind a histogram to the current bar
                   int span,      // analyzed parameter digit capacity
                   int swin=0)    // histogram window
  {
   double y=NormalizeDouble(price,span);
   string pfx=DoubleToString(y,span);
// if draw=true, draw the histogram to the right
   if(draw)
     {
      string name="+ "+h_name+pfx;                   // object name: prefix+price
      ObjectCreate(0,name,OBJ_TREND,swin,time,y);    // create the object
      ObjectSetInteger(0,name,OBJPROP_COLOR,color_R_active); // set the object color
      ObjSet;                                                // code shortening macro
      if(StringFind(ObjectGetString(0,name,OBJPROP_TEXT),"*",0)<0)
        {// if the resulting price entered the sample for the first time
         ObjectSetString(0,name,OBJPROP_TEXT,"*1");          // the price freuqency is 1
         ObjectSetInteger(0,name,OBJPROP_TIME,1,time+hsize); // define the time coordinate
        }
      else
        {// if the resulting price entered the sample not for the first time
         string str=ObjectGetString(0,name,OBJPROP_TEXT);    // get the property value
         string strint=StringSubstr(str,1);                  // highlight the substring
         long n=StringToInteger(strint);                     // get a frequency for further calculations
         n++;                                                // increase the value by 1
         ObjectSetString(0,name,OBJPROP_TEXT,"*"+(string)n); // write a new value to the property
         ObjectSetInteger(0,name,OBJPROP_TIME,1,time+hsize*n);//define the time coordinate
        }
     }
// if draw=false, write the histogram to the left
   if(!draw)
     {
      string name="- "+h_name+pfx;
      ObjectCreate(0,name,OBJ_TREND,swin,time,y);
      ObjectSetInteger(0,name,OBJPROP_COLOR,color_L_active);
      ObjSet;
      if(StringFind(ObjectGetString(0,name,OBJPROP_TEXT),"*",0)<0)
        {
         ObjectSetString(0,name,OBJPROP_TEXT,"*1");
         ObjectSetInteger(0,name,OBJPROP_TIME,1,time-hsize);
        }
      else
        {
         string str=ObjectGetString(0,name,OBJPROP_TEXT);
         string strint=StringSubstr(str,1);
         long n=StringToInteger(strint);
         n++;
         ObjectSetString(0,name,OBJPROP_TEXT,"*"+(string)n);
         ObjectSetInteger(0,name,OBJPROP_TIME,1,time-hsize*n);
        }
     }
   ChartRedraw();
  }
The function consists of two similar parts for Bid and Ask each. Therefore, comments are present in the first block only.
You may ask, what is the point in doubling the price in the object name if it is available in the OBJPROP_PRICE property anyway?
Let's dwell on that a bit. When a new price arrives, we should define the appropriate column for it and increase the frequency value accordingly. If we used the price coordinate from its native property, we would have to pass through all graphical objects, request the property value and compare it with the received price. Only after that, we would be able to write the new value to an appropriate column. However, comparing real double-type numbers is quite a backbreaking task greatly reducing the efficiency of the algorithm. The more elegant solution is to write the new frequency directly to the necessary destination right after a new price value arrives. How can we achieve that? When we create a new graphical object with a name similar to an existing object's one, the new object is not created and the property fields are not set to zero. In other words, we create objects neglecting the fact that they will be doubled. There is no need in extra checks since no copies and clones are to be created. The terminal and graphical objects functionality will take care of that. We only have to define if the price entered the sample for the first time or not. To do this, use the asterisk (*) prefix in the OBJPROP_TEXT object property of the DrawHistogram() function. No asterisk means the price entered the sample for the first time. Indeed, when we create a new object, the field is empty. A frequency value with a specified prefix is to be stored there during subsequent calls.
Next, let's shift the histogram to the right. When a new bar appears, the chart shifts to the left, however we need the histogram to be displayed on the current bar. In other words, it should shift in the opposite direction. Here is how we can achieve that:
//--- Shift the diagrams to the new bar
   if(time[0]>prevTimeBar) // define a new bar arrival
     {
      prevTimeBar=time[0];
      // pass through all graphical objects
      for(int obj=ObjectsTotal(0,-1,-1)-1;obj>=0;obj--)
        {
         string obj_name=ObjectName(0,obj,-1,-1);               // get a name of a found object
         if(obj_name[0]==R)                                     // search for the histogram element prefix
           {                                                    // if the histogram element is found
            ObjectSetInteger(0,obj_name,OBJPROP_TIME,           // set a new coordinate value
                             0,time[0]);                        // for "0" anchor point
            string str=ObjectGetString(0,obj_name,OBJPROP_TEXT);// read the variable from the object property
            string strint=StringSubstr(str,1);                  // separate a substring from the received variable
            long n=StringToInteger(strint);                     // convert the string into a long variable
            ObjectSetInteger(0,obj_name,OBJPROP_TIME,           // calculate the new coordinate value
                             1,time[0]+hsize*n);                // for "1" anchor point
            ObjectSetInteger(0,obj_name,OBJPROP_COLOR,
                             color_R_passive);                  // change the color of the shifted histogram element
           }
         if(obj_name[0]==L)
           {
            ObjectSetInteger(0,obj_name,OBJPROP_TIME,0,time[0]);
            string str=ObjectGetString(0,obj_name,OBJPROP_TEXT);
            string strint=StringSubstr(str,1);
            long n=StringToInteger(strint);
            ObjectSetInteger(0,obj_name,OBJPROP_TIME,1,time[0]-hsize*n);
            ObjectSetInteger(0,obj_name,OBJPROP_COLOR,color_L_passive);
           }
        }
      ChartRedraw();
     }
That is all. The Bid and Ask prices histogram is plotted on the chart, while the program does not use a single array or an indicator buffer. The complete code of the solution is attached below.
The video displays a ready-made solution of a similar problem with the use of the graphical memory. The code itself can be found in the CodeBase: "Histogram bid and ask prices" indicator (in Russian).
Plotting histograms in the main window
Now that we have considered the functionality programming using the graphical memory, let's plot several histograms for standard indicators. The plotting principle is similar to the considered one. However, indicator values on the current bar are to be used instead of Bid and Ask prices.
1. iMA indicator. Let's use two indicators having different averaging periods and build histograms. Here is the code:
input int               period_MA1=20;       // Averaging period of iMA1
input int               period_MA2=14;       // Averaging period of iMA2
//---- indicator buffers
double      MA1[];
double      MA2[];
//---- handles for indicators
int         iMA1_handle;
int         iMA2_handle;
//+------------------------------------------------------------------+
//| Custom indicator initialization function                         |
//+------------------------------------------------------------------+
int OnInit()
  {
   ObjectsDeleteAll(0,-1,-1);
   ChartRedraw();
   iMA1_handle=iMA(_Symbol,_Period,period_MA1,0,MODE_SMA,PRICE_CLOSE);
   iMA2_handle=iMA(_Symbol,_Period,period_MA2,0,MODE_SMA,PRICE_CLOSE);
   ArraySetAsSeries(MA1,true);
   ArraySetAsSeries(MA2,true);
   return(INIT_SUCCEEDED);
  }
//+------------------------------------------------------------------+
//| Custom indicator iteration function                              |
//+------------------------------------------------------------------+
int OnCalculate(const int rates_total,
                const int prev_calculated,
                const datetime &time[],
                const double &open[],
                const double &high[],
                const double &low[],
                const double &close[],
                const long &tick_volume[],
                const long &volume[],
                const int &spread[])
  {
   ArraySetAsSeries(time,true);

   CopyBuffer(iMA1_handle,0,0,1,MA1);
   CopyBuffer(iMA2_handle,0,0,1,MA2);

   DrawHistogram(true,"iMA("+(string)period_MA1+")=",MA1[0],time[0],_Digits);
   DrawHistogram(false,"iMA("+(string)period_MA2+")=",MA2[0],time[0],_Digits);

//--- Shift the diagrams to a new bar
   if(time[0]>prevTimeBar) // define a new bar arrival
     {
      prevTimeBar=time[0];
      // pass through all graphical objects
      for(int obj=ObjectsTotal(0,-1,-1)-1;obj>=0;obj--)
        {
         string obj_name=ObjectName(0,obj,-1,-1);               // get a name of a found object
         if(obj_name[0]==R)                                     // search for the histogram element prefix
           {                                                    // if the histogram element is found
            ObjectSetInteger(0,obj_name,OBJPROP_TIME,           // set a new coordinate value
                             0,time[0]);                        // for "0" anchor point
            string str=ObjectGetString(0,obj_name,OBJPROP_TEXT);// read the variable from the object property
            string strint=StringSubstr(str,1);                  // separate a substring from the received variable
            long n=StringToInteger(strint);                     // convert the string into a long variable
            ObjectSetInteger(0,obj_name,OBJPROP_TIME,           // calculate the new coordinate value
                             1,time[0]+hsize*n);                // for "1" anchor point
            ObjectSetInteger(0,obj_name,OBJPROP_COLOR,
                             color_R_passive);                  // change the color of the shifted histogram element
           }
         if(obj_name[0]==L)
           {
            ObjectSetInteger(0,obj_name,OBJPROP_TIME,0,time[0]);
            string str=ObjectGetString(0,obj_name,OBJPROP_TEXT);
            string strint=StringSubstr(str,1);
            long n=StringToInteger(strint);
            ObjectSetInteger(0,obj_name,OBJPROP_TIME,1,time[0]-hsize*n);
            ObjectSetInteger(0,obj_name,OBJPROP_COLOR,color_L_passive);
           }
        }
      ChartRedraw();
     }
   return(rates_total);
  }
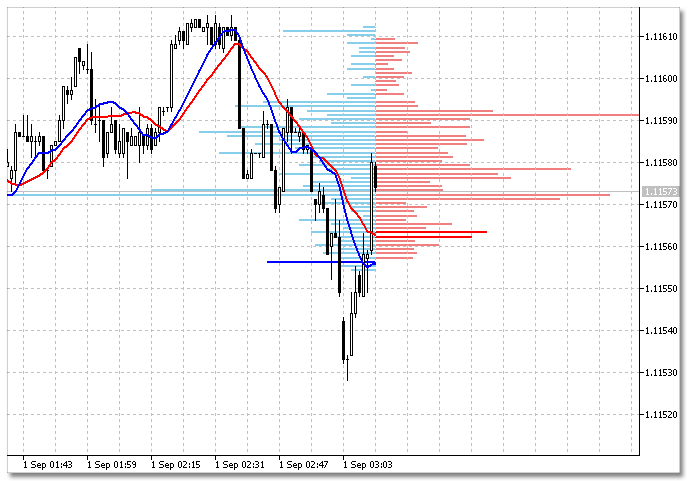
Fig. 2. Histogram of the two iMA indicators
2. iBands indicator. Let's plot the histograms for the indicator's upper (UPPER_BAND) and lower (LOWER_BAND) borders. The abridged code is shown below.
input int   period_Bands=14;           // Averaging period of iBands
//---- indicator buffers
double      UPPER[];
double      LOWER[];
//---- handles for indicators
int         iBands_handle;
//+------------------------------------------------------------------+
//| Custom indicator initialization function                         |
//+------------------------------------------------------------------+
int OnInit()
  {
   ObjectsDeleteAll(0,-1,-1);
   ChartRedraw();
   iBands_handle=iBands(_Symbol,_Period,period_Bands,0,5.00,PRICE_CLOSE);
   ArraySetAsSeries(UPPER,true);
   ArraySetAsSeries(LOWER,true);
   return(INIT_SUCCEEDED);
  }
//+------------------------------------------------------------------+
//| Custom indicator iteration function                              |
//+------------------------------------------------------------------+
int OnCalculate(const int rates_total,
                const int prev_calculated,
                const datetime &time[],
                const double &open[],
                const double &high[],
                const double &low[],
                const double &close[],
                const long &tick_volume[],
                const long &volume[],
                const int &spread[])
  {
//---
   ArraySetAsSeries(time,true);

   CopyBuffer(iBands_handle,1,0,1,UPPER);
   CopyBuffer(iBands_handle,2,0,1,LOWER);

   DrawHistogram(true,"iBands(UPPER)=",UPPER[0],time[0],_Digits);
   DrawHistogram(false,"iBands(LOWER)=",LOWER[0],time[0],_Digits);

//--- Shift the diagram to a new bar
   if(time[0]>prevTimeBar)
     {
     ...
     }
   return(rates_total);
  }
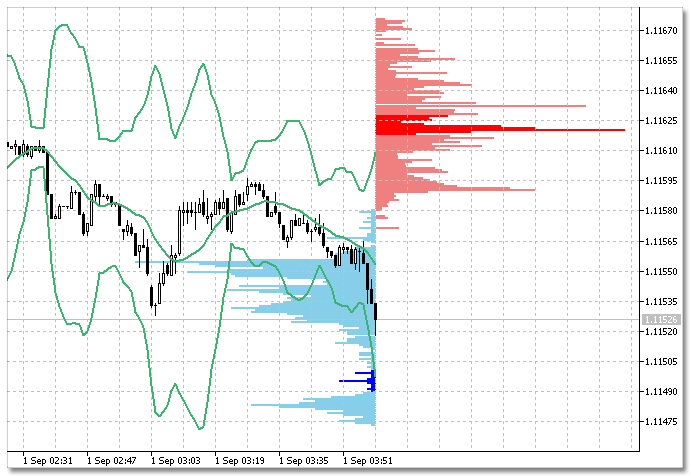
Fig. 3. Histogram of the iBands indicator's Bollinger bands
We can get quite interesting histograms for the Bollinger indicator if we use all three indicator buffers (0 - BASE_LINE, 1 - UPPER_BAND, 2 - LOWER_BAND). Let's place the histogram of the upper and lower bands to the right of the current bar, while the main line histogram — to the left of the zero bar. The result is shown in the image below:
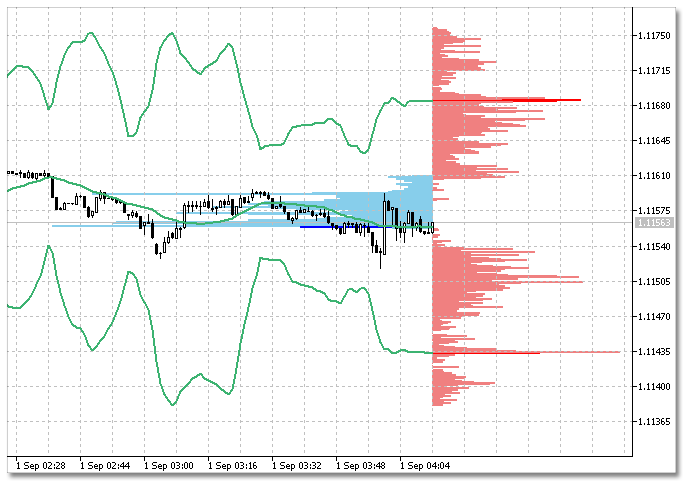
Fig. 4. Bollinger bands histogram using three indicator buffers
The code for this histogram version is provided below. Note that the two histograms (for the indicator upper and lower borders) are actually displayed to the right. They are perceived as a single diagram visually.
input int   period_Bands=20;       // Averaging period of iBands
//---- indicator buffers
double      BASE[];
double      UPPER[];
double      LOWER[];
//---- handles for indicators
int         iBands_handle;
//+------------------------------------------------------------------+
//| Custom indicator initialization function                         |
//+------------------------------------------------------------------+
int OnInit()
  {
   ObjectsDeleteAll(0,-1,-1);
   ChartRedraw();
   iBands_handle=iBands(_Symbol,_Period,period_Bands,0,10.00,PRICE_CLOSE);
   ArraySetAsSeries(BASE,true);
   ArraySetAsSeries(UPPER,true);
   ArraySetAsSeries(LOWER,true);
   return(INIT_SUCCEEDED);
  }
//+------------------------------------------------------------------+
//| Custom indicator iteration function                              |
//+------------------------------------------------------------------+
int OnCalculate(const int rates_total,
                const int prev_calculated,
                const datetime &time[],
                const double &open[],
                const double &high[],
                const double &low[],
                const double &close[],
                const long &tick_volume[],
                const long &volume[],
                const int &spread[])
  {
//---
   ArraySetAsSeries(time,true);

   CopyBuffer(iBands_handle,0,0,1,BASE);
   CopyBuffer(iBands_handle,1,0,1,UPPER);
   CopyBuffer(iBands_handle,2,0,1,LOWER);

   DrawHistogram(true,"iBands(UPPER)=",UPPER[0],time[0],_Digits);
   DrawHistogram(true,"iBands(LOWER)=",LOWER[0],time[0],_Digits);
   DrawHistogram(false,"iBands(LOWER)=",BASE[0],time[0],_Digits);

//--- Shift the diagram to a new bar
   if(time[0]>prevTimeBar)
     {
     ...
     }
   return(rates_total);
  }
So far, we examined the variation series, in which the range of the analyzed values (the variant) was equal to the current symbol's point (_Point) size. In other words, all price values were drawn as a separate histogram column.
It should be highlighted how gracefully and seamlessly the variation series were sorted (ranked) using the terminal's built-in functionality. Not a single line of code was written for that.
Now, let's modify the distribution range having multiple variant values using a single variable and the power of the graphical objects. The DrawHistogram() function mentioned above features the span input — analyzed parameter's decimal capacity. By varying the decimal capacity, we are able to change the interval for calculating the histogram frequencies. Since the price is included into the graphical object name, selection is performed automatically when creating and adjusting the objects' properties. See how sorting and grouping tasks are easily solved using the graphical memory with no programming.
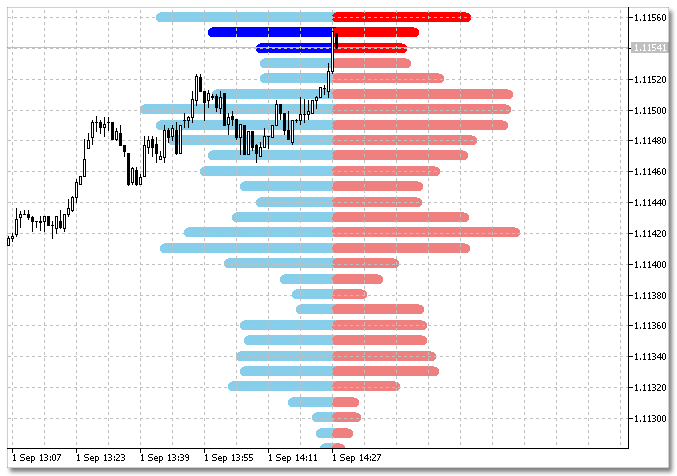
Fig. 5. Bid and Ask prices histogram with the increased column interval
Thus, we can easily plot histograms in the main chart window. Now, let's see how to plot similar diagrams in the additional chart windows.
Histograms in additional windows
The principle of creating statistical distributions in additional windows is similar to that for the main window. The difference is that the values of the analyzed variables can be negative. Besides, they may have arbitrary digit capacity. In the main window, the price scale has a predefined digit capacity that can be obtained using the _Digits variable. In additional windows, the variables may be both positive and negative. Besides, the number of decimal places is not limited. This should be considered when setting the input parameters of the DrawHistogram() function for building histograms. Also, make sure to set the additional window index. The main window equal to zero is used in the function by default.
Examples of histograms in additional windows
The best way to digest information is to use examples. Let's consider a few examples of plotting histograms in additional windows for standard technical indicators.
1. iChaikin indicator.
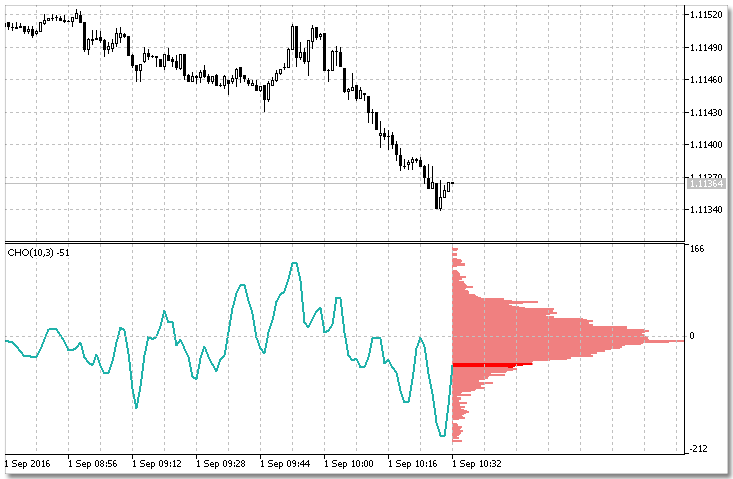
Fig. 6. Chaikin Oscillator histogram
The abridged code of the indicator is as follows:
input int   period_fast=3;       // Averaging period fast of iChaikin
input int   period_slow=10;      // Averaging period of slow iChaikin
//---- indicator buffers
double      CHO[];
//---- handles for indicators
int         iChaikin_handle;
//+------------------------------------------------------------------+
//| Custom indicator initialization function                         |
//+------------------------------------------------------------------+
int OnInit()
  {
   ObjectsDeleteAll(0,-1,-1);
   ChartRedraw();
   iChaikin_handle=iChaikin(_Symbol,_Period,period_fast,period_slow,MODE_SMA,VOLUME_TICK);
   ArraySetAsSeries(CHO,true);
   return(INIT_SUCCEEDED);
  }
//+------------------------------------------------------------------+
//| Custom indicator iteration function                              |
//+------------------------------------------------------------------+
int OnCalculate(const int rates_total,
                const int prev_calculated,
                const datetime &time[],
                const double &open[],
                const double &high[],
                const double &low[],
                const double &close[],
                const long &tick_volume[],
                const long &volume[],
                const int &spread[])
  {
//---
   ArraySetAsSeries(time,true);

   CopyBuffer(iChaikin_handle,0,0,2,CHO);

   DrawHistogram(true,"iChaikin=",CHO[0],time[0],0,1);

//--- Shift the diagram to a new bar
   if(time[0]>prevTimeBar)
     {
     ...
     }
   return(rates_total);
  }
2. iCCI indicator.
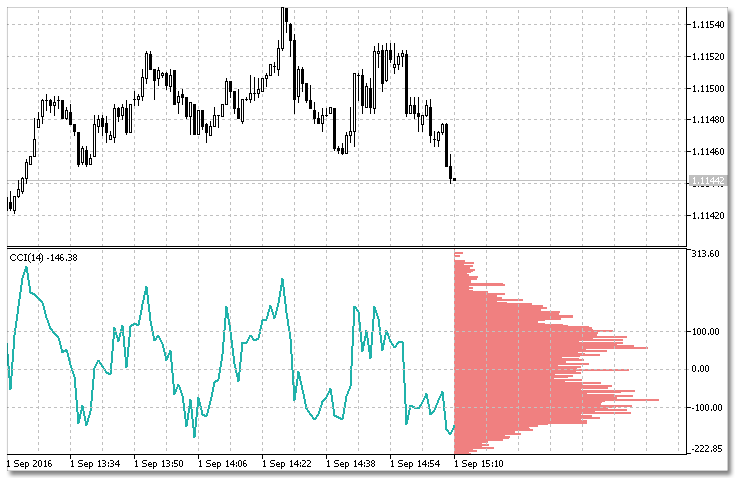
Fig. 7. Commodity Channel Index histogram
The abridged code:
input int   period_CCI=14;             // Averaging period of iCCI
//---- indicator buffers
double      CCI[];
//---- handles for indicators
int         iCCI_handle;
//+------------------------------------------------------------------+
//| Custom indicator initialization function                         |
//+------------------------------------------------------------------+
int OnInit()
  {
   ObjectsDeleteAll(0,-1,-1);
   ChartRedraw();
   iCCI_handle=iCCI(_Symbol,_Period,period_CCI,PRICE_CLOSE);
   ArraySetAsSeries(CCI,true);
   return(INIT_SUCCEEDED);
  }
//+------------------------------------------------------------------+
//| Custom indicator iteration function                              |
//+------------------------------------------------------------------+
int OnCalculate(const int rates_total,
                const int prev_calculated,
                const datetime &time[],
                const double &open[],
                const double &high[],
                const double &low[],
                const double &close[],
                const long &tick_volume[],
                const long &volume[],
                const int &spread[])
  {
//---
   ArraySetAsSeries(time,true);

   CopyBuffer(iCCI_handle,0,0,2,CCI);

   DrawHistogram(true,"iCCI=",CCI[0],time[0],0,1);

//--- Shift the diagram to a new bar
   if(time[0]>prevTimeBar)
     {
     ...
     }
   return(rates_total);
  }
3. Indicators: iEnvelopes, iATR, iMACD. The combination of histograms for three indicators. Each of the indicators is displayed in a separate window.
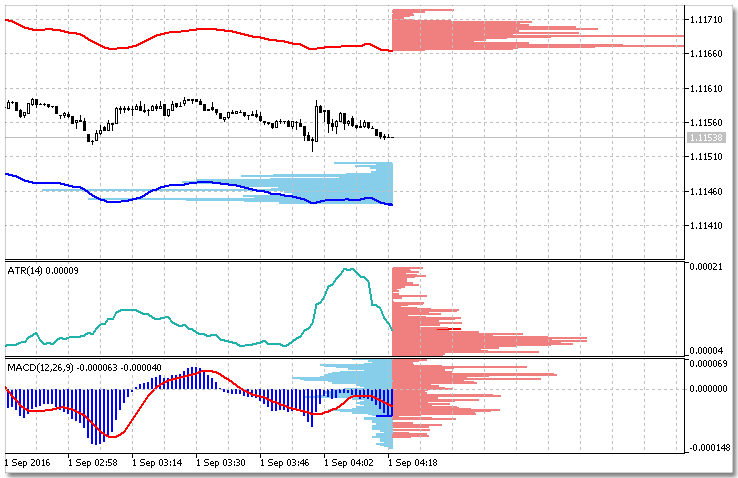
Fig. 8. Histograms of three indicators: iEnvelopes, iATR and iMACD
The abridged code for the set of histograms on Fig. 8.
input int   period_Envelopes=14;       // Averaging period of iEnvelopes
input int   period_ATR=14;             // Averaging period of iATR
input int   period_fast=12;            // Averaging period fast of iMACD
input int   period_slow=26;            // Averaging period of slow iMACD
//---- indicator buffers
double      UPPER[];
double      LOWER[];
double      ATR[];
double      MAIN[];
double      SIGNAL[];
//---- handles for indicators
int         iEnvelopes_handle;
int         iATR_handle;
int         iMACD_handle;
//+------------------------------------------------------------------+
//| Custom indicator initialization function                         |
//+------------------------------------------------------------------+
int OnInit()
  {
   ObjectsDeleteAll(0,-1,-1);
   ChartRedraw();
   iEnvelopes_handle=iEnvelopes(_Symbol,_Period,period_Envelopes,0,MODE_SMA,PRICE_CLOSE,0.1);
   iATR_handle=iATR(_Symbol,_Period,period_ATR);
   iMACD_handle=iMACD(_Symbol,_Period,period_fast,period_slow,9,PRICE_CLOSE);
   ArraySetAsSeries(UPPER,true);
   ArraySetAsSeries(LOWER,true);
   ArraySetAsSeries(ATR,true);
   ArraySetAsSeries(MAIN,true);
   ArraySetAsSeries(SIGNAL,true);
   return(INIT_SUCCEEDED);
  }
//+------------------------------------------------------------------+
//| Custom indicator iteration function                              |
//+------------------------------------------------------------------+
int OnCalculate(const int rates_total,
                const int prev_calculated,
                const datetime &time[],
                const double &open[],
                const double &high[],
                const double &low[],
                const double &close[],
                const long &tick_volume[],
                const long &volume[],
                const int &spread[])
  {
//---
   ArraySetAsSeries(time,true);

   CopyBuffer(iEnvelopes_handle,0,0,1,UPPER);
   CopyBuffer(iEnvelopes_handle,1,0,1,LOWER);
   CopyBuffer(iATR_handle,0,0,1,ATR);
   CopyBuffer(iMACD_handle,0,0,1,MAIN);
   CopyBuffer(iMACD_handle,1,0,1,SIGNAL);

   DrawHistogram(true,"iEnvelopes.UPPER=",UPPER[0],time[0],_Digits);
   DrawHistogram(false,"iEnvelopes.LOWER=",LOWER[0],time[0],_Digits);
   DrawHistogram(true,"iATR=",ATR[0],time[0],_Digits+1,1);
   DrawHistogram(true,"iMACD.SIGNAL=",SIGNAL[0],time[0],_Digits+1,2);
   DrawHistogram(false,"iMACD.MAIN=",MAIN[0],time[0],_Digits+1,2);

//--- Shift the diagram to a new bar
   if(time[0]>prevTimeBar)
     {
     ...
     }
   return(rates_total);
  }
After considering the plotting of various histograms of the market parameters' statistical distributions, we can conclude that:
- МТ5 trading terminal functionality;
- MQL5 graphical objects' features;
- graphical memory (little-known features of graphical objects);
- the simple DrawHistogram() function
allow us to calculate and visualize the cumulative histograms of multiple indicators — from standard to custom ones. However, this is insufficient for a more detailed analysis of market parameters.
Numerical parameters of statistical distributions
The first part of the article dealt with the histogram plotting method suitable for novice programmers. Provided examples are easily projected onto a large class of problems related to statistical distributions and their visualization. However, in order to conduct more in-depth histogram analysis, we need the most versatile and advanced programming methods, like OOP. Let's define the statistical distribution parameters that are to be of main interest for the readers.
First, we are interested in numerical parameters of variation series:
- arithmetic mean (average frequency);
- weighted arithmetic mean;
- variance;
- standard deviation.
Second, we need to visualize them. Of course, all this can be implemented using procedural style, but we are going to apply object-oriented programming in this article to solve the tasks.
CHistogram class
The class functionality allows displaying histograms and main statistical distribution parameters on a chart. Let's consider the basic methods.
Method: CHistogram class constructor.
Initializes the class instance.
string name, // unique name prefix
int hsize, // diagram scale
int width, // histogram column line width
color active, // active line color
color passive, // passive line color
bool Left_Right=true, // left=false or right=true
bool relative_frequency=false, // relative or absolute histogram
int sub_win=0 // histogram window index
);
Parameters:
name
[in] Unique name prefix for all histogram columns.
hsize
[in] Histogram scale.
width
[in] Histogram column line width.
active
[in] Color of histogram columns updated on the current bar.
passive
[in] Color of histogram columns that are not updated on the current bar.
Left_Right=true
[in] Histogram direction. false — histogram located to the left of the current bar, true — to the right.
relative_frequency=false
[in] Frequencies accounting method. false — absolute frequency values, true — relative frequency values.
sub_win=0
[in] Histogram window index. 0 — main chart window.
Return value:
No return value. If successful, the class instance with the specified parameters is created.
Method: DrawHistogram display.
Displays histogram columns: creates new columns, edits existing ones, saves frequency values in the graphical memory. Displays the histogram on the current bar.
double price, // variant value
datetime time // current bar time
);
Parameters:
price
[in] Analyzed market parameter variant value.
time
[in] Time of the current bar. The histogram axis is on the bar.
Return value:
No return value. If successful, a new histogram bar is created or an existing one is created. If a new bar appears, the histogram is shifted so that the axis is located on the current bar.
Method: calculating the HistogramCharacteristics histogram parameters.
Returns calculated variation series parameters in sVseries-type variable.
Parameters:
No input parameters.
Return value:
If successful, an sVseries-type variable value is returned.
Structure for receiving the current values of the histogram parameters (sVseries).
Structure for storing the last values of the statistical distribution parameters. The structure is designed for receiving the most needed variation series data.
{
long N; // total number of observations
double Na; // frequencies average value
double Vmax; // maximum variant value
double Vmin; // minimum variant value
double A; // series amplitude
double Mean; // weighted arithmetic mean
double D; // variance
double SD; // standard deviation
};
sVseries-type variable allows you to receive all the main parameters of the variation series displayed as a histogram within a single call of the HistogramCharacteristics() function.
Method: DrawMean value visualization.
Displays the value of the weighted arithmetic mean of the variation series on a chart.
double coord, // weighted arithmetic mean value
datetime time, // current bar time
bool marker=false,// show/hide the marker
bool save=false // save the value in history
);
Parameters:
coord
[in] Weighted arithmetic mean value.
time
[in] Time of the current bar. The weighted arithmetic mean value is to be displayed on this bar.
marker=false
[in] Show/hide the chart marker. false — hide the marker, true — show the marker on a chart.
save=false
[in] Save the weighted arithmetic mean value in history. false — hide the value, true — show the value on a chart.
Return value:
If successful, the chart displays a horizontal line corresponding to the weighted arithmetic mean value.
Method: DrawSD standard deviation visualization.
Displays a standard deviation value as a rectangle with its width matching the average frequency and height matching the standard deviation plotted upwards and downwards from the weighted arithmetic mean value.
sVseries &coord, // sVseries-type variable
datetime time, // current bar time
double deviation=1.0, // deviation
color clr=clrYellow // display color
);
Parameters:
coord
[in] sVseries-type variable value.
time
[in] Time of the current bar.
deviation=1.0
[in] Standard deviation increase ratio.
clr=clrYellow
[in] Color of the rectangle visualizing the standard deviation.
Return value:
If successful, the rectangle visualizing the standard deviation from the weighted arithmetic mean value is displayed on a chart.
Plotting histograms using the CHistogram class
Let's plot histograms of Bid and Ask statistical distributions, as well as ATR and MACD indicators (Fig. 9). Unlike the previous examples, this class allows plotting relative diagrams. Apart from the histogram, let's also create a graphical representation of a weighted arithmetic mean and standard deviation. The mean is to be saved using the indicator buffers. In the screenshot below, the standard deviations are displayed as rectangles with their width corresponding to the average frequency, while their height equal to the two deviations increased several times for better visibility.
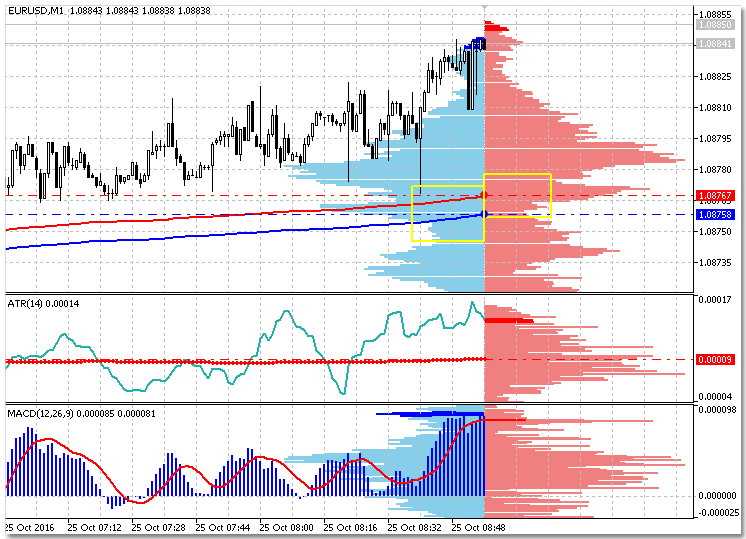
Fig. 9. Histograms of iATR and iMACD indicators, as well as of Bid and Ask prices
The code of the example is attached below. The indicator buffers used in the program highlight the interaction of the class and the indicator functionality.
Conclusion
- Statistical distributions of variation series in the form of histograms without indicator buffers and arrays can be implemented using the "graphical" memory.
- When dealing with tasks involving graphical objects, it is often reasonable to apply graphical object properties as more resource-saving memory. Besides, we are able to access the extensive terminal and MQL5 language functionality, like sorting, grouping, search, sampling, direct access to the elements and others.
- We have considered basic, primitive "graphical" memory application methods. In actual practice, it is possible to store small arrays and structures in the graphical object properties.
Translated from Russian by MetaQuotes Ltd.
Original article: https://www.mql5.com/ru/articles/2714
Warning: All rights to these materials are reserved by MetaQuotes Ltd. Copying or reprinting of these materials in whole or in part is prohibited.
This article was written by a user of the site and reflects their personal views. MetaQuotes Ltd is not responsible for the accuracy of the information presented, nor for any consequences resulting from the use of the solutions, strategies or recommendations described.
 Patterns available when trading currency baskets
 Graphical Interfaces X: Text Edit box, Picture Slider and simple controls (build 5)
 Graphical Interfaces X: Time control, List of checkboxes control and table sorting (build 6)
 Universal Oscillator with a GUI
- Free trading apps
- Over 8,000 signals for copying
- Economic news for exploring financial markets
You agree to website policy and terms of use
Sergey, this is very interesting and I'd like to talk about it.
First, I don't know how to get the code from the news post. I ended up saving the code and copy-pasting it from the saved file. I'm not sure what an .mht file is.
Anyway I pasted the DrawHistogram() function but when I tried to compile it there were undefined variables. e.g color_R_active. Can you help me define those.
Thank you.
Chuck Stangor
Show the full code.
Show the full code.
//| draw_histogram.mqh |
//| Copyright 2016, MetaQuotes Software Corp. |
//| https://www.mql5.com |
//+------------------------------------------------------------------+
#property copyright "Copyright 2016, MetaQuotes Software Corp."
#property link "https://www.mql5.com"
//+------------------------------------------------------------------+
//| defines |
//+------------------------------------------------------------------+
// #define MacrosHello "Hello, world!"
// #define MacrosYear 2010
//+------------------------------------------------------------------+
//| DLL imports |
//+------------------------------------------------------------------+
// #import "user32.dll"
// int SendMessageA(int hWnd,int Msg,int wParam,int lParam);
// #import "my_expert.dll"
// int ExpertRecalculate(int wParam,int lParam);
// #import
//+------------------------------------------------------------------+
//| EX5 imports |
//+------------------------------------------------------------------+
// #import "stdlib.ex5"
// string ErrorDescription(int error_code);
// #import
//+------------------------------------------------------------------+
void DrawHistogram(bool draw, // draw a histogram to the left or to the right
string h_name, // unique prefix for the object name
double price, // price (analyzed parameter)
datetime time, // bind a histogram to the current bar
int span, // analyzed parameter digit capacity
int swin=0) // histogram window
{
double y=NormalizeDouble(price,span);
string pfx=DoubleToString(y,span);
// if draw=true, draw the histogram to the right
if(draw)
{
string name="+ "+h_name+pfx; // object name: prefix+price
ObjectCreate(0,name,OBJ_TREND,swin,time,y); // create the object
ObjectSetInteger(0,name,OBJPROP_COLOR,color_R_active); // set the object color
ObjSet; // code shortening macro
if(StringFind(ObjectGetString(0,name,OBJPROP_TEXT),"*",0)<0)
{// if the resulting price entered the sample for the first time
ObjectSetString(0,name,OBJPROP_TEXT,"*1"); // the price freuqency is 1
ObjectSetInteger(0,name,OBJPROP_TIME,1,time+hsize); // define the time coordinate
}
else
{// if the resulting price entered the sample not for the first time
string str=ObjectGetString(0,name,OBJPROP_TEXT); // get the property value
string strint=StringSubstr(str,1); // highlight the substring
long n=StringToInteger(strint); // get a frequency for further calculations
n++; // increase the value by 1
ObjectSetString(0,name,OBJPROP_TEXT,"*"+(string)n); // write a new value to the property
ObjectSetInteger(0,name,OBJPROP_TIME,1,time+hsize*n);//define the time coordinate
}
}
// if draw=false, write the histogram to the left
if(!draw)
{
string name="- "+h_name+pfx;
ObjectCreate(0,name,OBJ_TREND,swin,time,y);
ObjectSetInteger(0,name,OBJPROP_COLOR,color_L_active);
ObjSet;
if(StringFind(ObjectGetString(0,name,OBJPROP_TEXT),"*",0)<0)
{
ObjectSetString(0,name,OBJPROP_TEXT,"*1");
ObjectSetInteger(0,name,OBJPROP_TIME,1,time-hsize);
}
else
{
string str=ObjectGetString(0,name,OBJPROP_TEXT);
string strint=StringSubstr(str,1);
long n=StringToInteger(strint);
n++;
ObjectSetString(0,name,OBJPROP_TEXT,"*"+(string)n);
ObjectSetInteger(0,name,OBJPROP_TIME,1,time-hsize*n);
}
}
ChartRedraw();
}
//| draw_histogram.mqh |
//| Copyright 2016, MetaQuotes Software Corp. |
//| https://www.mql5.com |
//+------------------------------------------------------------------+
#property copyright "Copyright 2016, MetaQuotes Software Corp."
#property link "https://www.mql5.com"
//--- Макросы
#define R 43 // значения префикса (+) для гистограмм справа
#define L 45 // значения префикса (-) для гистограмм слева
#define WIDTH 2 // толщина линий
#define ObjSet1 ObjectSetInteger(0,name,OBJPROP_WIDTH,WIDTH)
#define ObjSet2 ObjectSetDouble(0,name,OBJPROP_PRICE,0,y)
#define ObjSet3 ObjectSetInteger(0,name,OBJPROP_TIME,0,time)
#define ObjSet4 ObjectSetDouble(0,name,OBJPROP_PRICE,1,y)
#define ObjSet5 ObjectSetInteger(0,name,OBJPROP_BACK,true)
#define ObjSet ObjSet1;ObjSet2;ObjSet3;ObjSet4;ObjSet5
//---
int hsize=10; // масштаб гистограммы
color color_R_active=clrRed; // цвет активных линий справа
color color_R_passive=clrLightCoral;// цвет пассивных линий справа
color color_L_active=clrBlue; // цвет активных линий слева
color color_L_passive=clrSkyBlue; // цвет пассивных линий слева
void DrawHistogram(bool draw, // draw a histogram to the left or to the right
string h_name, // unique prefix for the object name
double price, // price (analyzed parameter)
datetime time, // bind a histogram to the current bar
int span, // analyzed parameter digit capacity
int swin=0) // histogram window
{
double y=NormalizeDouble(price,span);
string pfx=DoubleToString(y,span);
// if draw=true, draw the histogram to the right
if(draw)
{
string name="+ "+h_name+pfx; // object name: prefix+price
ObjectCreate(0,name,OBJ_TREND,swin,time,y); // create the object
ObjectSetInteger(0,name,OBJPROP_COLOR,color_R_active); // set the object color
ObjSet; // code shortening macro
if(StringFind(ObjectGetString(0,name,OBJPROP_TEXT),"*",0)<0)
{// if the resulting price entered the sample for the first time
ObjectSetString(0,name,OBJPROP_TEXT,"*1"); // the price freuqency is 1
ObjectSetInteger(0,name,OBJPROP_TIME,1,time+hsize); // define the time coordinate
}
else
{// if the resulting price entered the sample not for the first time
string str=ObjectGetString(0,name,OBJPROP_TEXT); // get the property value
string strint=StringSubstr(str,1); // highlight the substring
long n=StringToInteger(strint); // get a frequency for further calculations
n++; // increase the value by 1
ObjectSetString(0,name,OBJPROP_TEXT,"*"+(string)n); // write a new value to the property
ObjectSetInteger(0,name,OBJPROP_TIME,1,time+hsize*n);//define the time coordinate
}
}
// if draw=false, write the histogram to the left
if(!draw)
{
string name="- "+h_name+pfx;
ObjectCreate(0,name,OBJ_TREND,swin,time,y);
ObjectSetInteger(0,name,OBJPROP_COLOR,color_L_active);
ObjSet;
if(StringFind(ObjectGetString(0,name,OBJPROP_TEXT),"*",0)<0)
{
ObjectSetString(0,name,OBJPROP_TEXT,"*1");
ObjectSetInteger(0,name,OBJPROP_TIME,1,time-hsize);
}
else
{
string str=ObjectGetString(0,name,OBJPROP_TEXT);
string strint=StringSubstr(str,1);
long n=StringToInteger(strint);
n++;
ObjectSetString(0,name,OBJPROP_TEXT,"*"+(string)n);
ObjectSetInteger(0,name,OBJPROP_TIME,1,time-hsize*n);
}
}
ChartRedraw();
}
mr Sergey,
I´m trying plot tick buy and sell volume instead bid and ask to have a volume at price like indicator, is it possible ? do you have some code with tick buy/sell volume that can post ?
thank´s very much !
Example of data that I want to plot, it plots a horizontal histogram of buy/sell tick volume in separate window I want to plot a vertical histogram in main chart window :