
Reimagining Classic Strategies (Part 12): EURUSD Breakout Strategy
In this article, we will build a trading strategy together in MQL5. We will implement a breakout trading strategy and iteratively improve it to unlock its full potential. Let us discuss some of the specifications of our strategy.
We will focus on the EURUSD pair, and trade its movements on the H1 time frame. Our breakout strategy will first record the current high and low prices being offered on the EURUSD pair. As time passes, we will wait to see price levels open and close fully outside the channel created by the initial high and low price we recorded.
When this happens, our trading strategy will have found a bias, that the markets are likely to continue moving in a particular direction. This is not the point at which our positions are entered. We will enter our positions when our bias is confirmed. Once prices fully open and close beyond the extreme point of the candle that broke out of our initial channel, we will open long positions if we are above the channel and short positions otherwise.
So far, the system we have specified will open too many trades. We need to specify other metrics of strength or weakness to help us filter out the unprofitable trades we may potentially take. The moving average can help us quickly identify market trends.
We will design our system to first monitor the current prices offered in the market we are in, and then observe which direction price breaks out of the channel and whether that break out is supported by future price action. If the break-out we observe is consistent with the price action we observe after the break-out, we will then use our moving averages to time our order execution.
We will prefer to go long when the fast-moving average is above the slow, and the opposite is true for our short positions. All our trades will be actively updated using the Average True Range indicator to calculate our stop loss and take profit settings.
We will test our trading strategy from the period between 1 January 2020 until the 30th November 2024 on the H1 time-frame.
Our technical indicators will be set up as follows:
- Fast-moving average: 5 Period Exponential Moving average applied to the close price.
- Slow-moving average: 60 Period Exponential Moving average applied to the close price.
- Average True Range: 14 Period ATR Indicator.
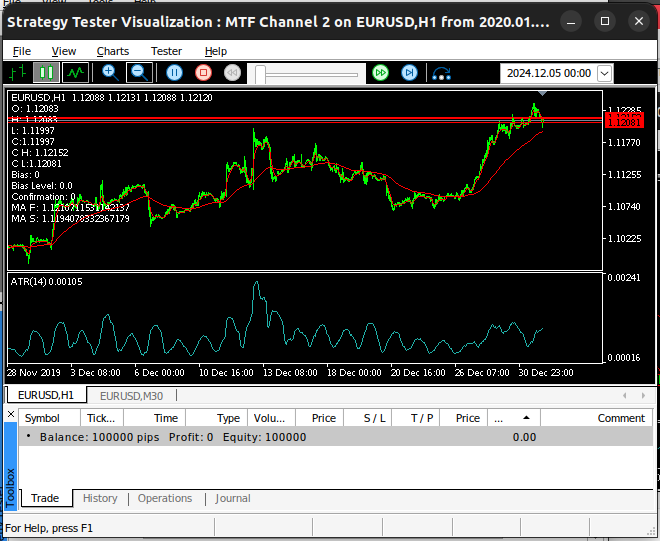
Fig 1: The initial state of our break-out trading application.
After some time, price levels will finally open and close outside the channel. This extreme point will be our bias, the side we believe markets will follow. Our bias will be confirmed if price levels subsequently close beneath the bias. Otherwise, we will not place any trades.
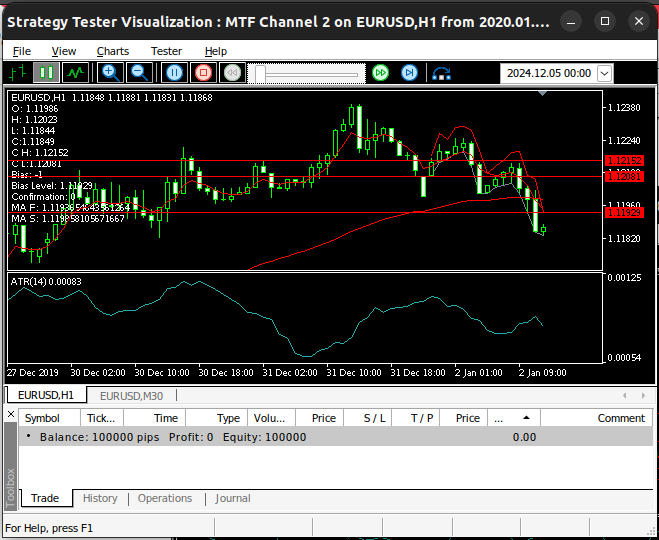
Fig 2: Our trading application has found a market bias.
If price levels confirm our bias, then we will have the confidence to open a position in the market. Our strategy will initially be trend following. So if prices break above the channel, we will look for opportunities to buy.
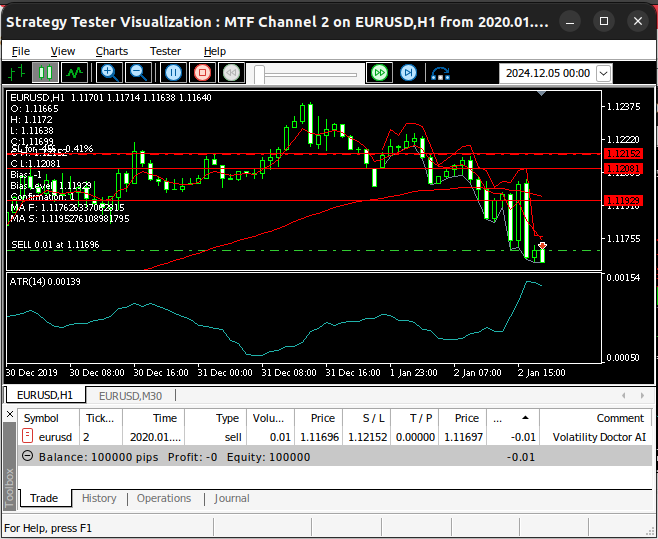
Fig 3: Our positions are opened after our bias has been confirmed.
Getting Started in MQL5
Our trading application is pieced together using trading logic and fundamental technical analysis concepts. Let us highlight the key elements that are contained in the code.
| System Part | Intended Purpose |
|---|---|
| Constants and Parameters | We will fix certain aspects of our trading algorithm for consistency across all our tests, such as the periods of the moving averages, the lot size and the width of our stop loss and take profit. |
| Global Variables | These variables are used in different parts of our code, and it is important that when we use them, we are pointing to the same value each time. Some of the global variables in our application include the high and low of the channel, the direction we believ the market will follow (bias) and other technical indicator values. |
We will also need to define other important variables in our trading application to help us keep track of the state the market is in. Let's get familiar with the important ones.
| Variable | Intended Purpose |
|---|---|
| Bias | The bias parameter symbolizes the direction prices appear to be moving in, it is allowed value 1 if the trend is bullish and -1 if the trend is bearish. Otherwise it will be set to 0. |
| Moving averages | The fast-moving average (ma_f) and the slow-moving average (ma_s) determine the trend. If ma_f[0] > ma_s[0] and the price (c) is above the fast-moving average, a buy is opened. Otherwise if ma_f[0] < ma_s[0] and the price is below the slow-moving average, a sell is opened. |
| Breakout | When the channel level (upper or lower border) is broken, the direction of movement (bias) is set. |
| Breakout levels | The break-out level will tell us which direction we believe markets will continue following in the future. If markets break above the upper limit, our sentiment will be bullish. |
| Signal confirmation | Our trades will not be placed without signal confirmation. The signal is confirmed if the market maintains its direction after the breakout. If confirmation is lost, the position can be adjusted or closed. |
| Order management | The trades we will place will depend on the bias we are currently observing in the market. In case of an uptrend (bias == 1), the command is sent: Trade.Buy(vol, Symbol(), ask, channel_low, 0, "Volatility Doctor AI"); Otherwise in case of a downtrend (bias == -1), the command is sent: Trade.Sell(vol, Symbol(), bid, channel_high, 0, "Volatility Doctor AI"); |
| Stop loss | Initially set at channel_low for buys and channel_high for sells, and updated in future using the ATR value. |
Now that we have a conceptual layout of the moving pieces in our strategy, let us get started building our trading strategy together. First, we must specify the details of our trading application.
//+------------------------------------------------------------------+
//|                                                MTF Channel 2.mq5 |
//|                                        Gamuchirai Zororo Ndawana |
//|                          https://www.mql5.com/en/gamuchiraindawa |
//+------------------------------------------------------------------+
#property copyright "Gamuchirai Zororo Ndawana"
#property link      "https://www.mql5.com/en/gamuchiraindawa"
#property version   "1.00"
Now load the trade library.
//+------------------------------------------------------------------+
//| Library                                                          |
//+------------------------------------------------------------------+
#include  <Trade/Trade.mqh>
CTrade Trade;
Define constants for our trading application, such as the periods of some of our technical indicators.
//+------------------------------------------------------------------+
//| Constants                                                        |
//+------------------------------------------------------------------+
const  int ma_f_period = 5; //Slow MA
const  int ma_s_period = 60; //Slow MA
Now let us define inputs our end user can adjust. Since we are keeping our technical indicators fixed, our end user isn't overwhelmed with numerous parameters.
//+------------------------------------------------------------------+
//| Inputs                                                           |
//+------------------------------------------------------------------+
input  group "Money Management"
input int lot_multiple = 5; //Lot Multiple
input int atr_multiple = 5; //ATR Multiple
Global variables we shall use in most of our program.
//+------------------------------------------------------------------+
//| Global varaibles                                                 |
//+------------------------------------------------------------------+
double channel_high = 0;
double channel_low  = 0;
double o,h,l,c;
int    bias = 0;
double bias_level = 0;
int    confirmation = 0;
double vol,bid,ask,initial_sl;
int    atr_handler,ma_fast,ma_slow;
double atr[],ma_f[],ma_s[];
double bo_h,bo_l;
When our trading application is loaded for the first time, we will call a specialized function to load our technical indicators and prepare other necessary market data for us.
//+------------------------------------------------------------------+
//| Expert initialization function                                   |
//+------------------------------------------------------------------+
int OnInit()
  {
//---
   setup();
//---
   return(INIT_SUCCEEDED);
  }
If we are no longer using our Expert Advisor, we should release the resources we are no longer using.
//+------------------------------------------------------------------+
//| Expert deinitialization function                                 |
//+------------------------------------------------------------------+
void OnDeinit(const int reason)
  {
//---
      IndicatorRelease(atr_handler);
      IndicatorRelease(ma_fast);
      IndicatorRelease(ma_slow);
  }
Whenever we receive updated prices, we will update our global variables and then check for new opportunities to trade.
//+------------------------------------------------------------------+
//| Expert tick function                                             |
//+------------------------------------------------------------------+
void OnTick()
  {
//--- If we have positions open
   if(PositionsTotal() > 0)
      manage_setup();

//--- Keep track of time
   static datetime timestamp;
   datetime time = iTime(Symbol(),PERIOD_CURRENT,0);
   if(timestamp != time)
     {
      //--- Time Stamp
      timestamp = time;
      if(PositionsTotal() == 0)
         find_setup();
     }
  }
The following function will be responsible for loading our technical indicators and fetching market data.
//+---------------------------------------------------------------+
//| Load our technical indicators and market data                 |
//+---------------------------------------------------------------+
void setup(void)
  {
   channel_high = iHigh(Symbol(),PERIOD_M30,1);
   channel_low  = iLow(Symbol(),PERIOD_M30,1);
   vol = lot_multiple * SymbolInfoDouble(Symbol(),SYMBOL_VOLUME_MIN);
   ObjectCreate(0,"Channel High",OBJ_HLINE,0,0,channel_high);
   ObjectCreate(0,"Channel Low",OBJ_HLINE,0,0,channel_low);
   atr_handler = iATR(Symbol(),PERIOD_CURRENT,14);
   ma_fast     = iMA(Symbol(),PERIOD_CURRENT,ma_f_period,0,MODE_EMA,PRICE_CLOSE);
   ma_slow     = iMA(Symbol(),PERIOD_CURRENT,ma_s_period,0,MODE_EMA,PRICE_CLOSE);
  }
When our strategy is loaded for the first time, we will mark the current high and low prices being offered in the market. By doing this, all future price we will observe can be observed with context, we can compare them to the initial price levels we saw when we first arrived.
//+---------------------------------------------------------------+
//| Update channel                                                |
//+---------------------------------------------------------------+
void update_channel(double new_high, double new_low)
  {
   channel_high = new_high;
   channel_low  = new_low;
   ObjectDelete(0,"Channel High");
   ObjectDelete(0,"Channel Low");
   ObjectCreate(0,"Channel High",OBJ_HLINE,0,0,channel_high);
   ObjectCreate(0,"Channel Low",OBJ_HLINE,0,0,channel_low);
  }
If we have open positions, we need to update our stop loss and take profit values accordingly. We will adjust our risk settings using a multiple of the Average True Range so that our risk settings are related to the current volatility levels in the market.
//+---------------------------------------------------------------+
//| Manage setup                                                  |
//+---------------------------------------------------------------+
void manage_setup(void)
  {
   bid = SymbolInfoDouble(Symbol(),SYMBOL_BID);
   ask = SymbolInfoDouble(Symbol(),SYMBOL_ASK);
   CopyBuffer(atr_handler,0,0,1,atr);
   Print("Managing Position");

   if(PositionSelect(Symbol()))
     {
      Print("Position Found");
      initial_sl = PositionGetDouble(POSITION_SL);
     }

   if(bias == 1)
     {
      Print("Position Buy");
      double new_sl = (ask - (atr[0] * atr_multiple));
      Print("Initial: ",initial_sl,"\nNew: ",new_sl);
      if(initial_sl < new_sl)
        {
         Trade.PositionModify(Symbol(),new_sl,0);
         Print("DONE");
        }
     }

   if(bias == -1)
     {
      Print("Position Sell");
      double new_sl = (bid + (atr[0] * atr_multiple));
      Print("Initial: ",initial_sl,"\nNew: ",new_sl);
      if(initial_sl > new_sl)
        {
         Trade.PositionModify(Symbol(),new_sl,0);
         Print("DONE");
        }
     }

  }
If we have no open positions, we will follow the rules we outlined earlier to identify trading opportunities. Recall that we are looking to observe strong price action breaking apart from the initial channel we will find price in. Afterward, we will gain enough confidence to commit to the trade, if price levels keep moving in the same direction and do not cross the open channel they have just created.
//+---------------------------------------------------------------+
//| Find Setup                                                    |
//+---------------------------------------------------------------+
void find_setup(void)
  {
//--- We are updating the system
   o = iOpen(Symbol(),PERIOD_CURRENT,1);
   h = iHigh(Symbol(),PERIOD_CURRENT,1);
   l = iLow(Symbol(),PERIOD_CURRENT,1);
   c = iClose(Symbol(),PERIOD_CURRENT,1);
   bid = SymbolInfoDouble(Symbol(),SYMBOL_BID);
   ask = SymbolInfoDouble(Symbol(),SYMBOL_ASK);
   CopyBuffer(atr_handler,0,0,1,atr);
   CopyBuffer(ma_fast,0,0,1,ma_f);
   CopyBuffer(ma_slow,0,0,1,ma_s);

//--- If we have no market bias
   if(bias == 0)
     {
      //--- Our bias is bullish
      if
      (
         (o > channel_high) &&
         (h > channel_high) &&
         (l > channel_high) &&
         (c > channel_high)
      )
        {
         bias = 1;
         bias_level = h;
         bo_h = h;
         bo_l = l;
         mark_bias(h);
        }

      //--- Our bias is bearish
      if
      (
         (o < channel_low) &&
         (h < channel_low) &&
         (l < channel_low) &&
         (c < channel_low)
      )
        {
         bias = -1;
         bias_level = l;
         bo_h = h;
         bo_l = l;
         mark_bias(l);
        }
     }

//--- Is our bias valid?
   if(bias != 0)
     {

      //--- Our bearish bias has been violated
      if
      (
         (o > channel_high) &&
         (h > channel_high) &&
         (l > channel_high) &&
         (c > channel_high) &&
         (bias == -1)
      )
        {
         forget_bias();
        }
      //--- Our bullish bias has been violated
      if
      (
         (o < channel_low) &&
         (h < channel_low) &&
         (l < channel_low) &&
         (c < channel_low) &&
         (bias == 1)
      )
        {
         forget_bias();
        }

      //--- Our bullish bias has been violated
      if
      (
         ((o < channel_high) && (c > channel_low))
      )
        {
         forget_bias();
        }

      //--- Check if we have confirmation
      if((confirmation == 0) && (bias != 0))
        {
         //--- Check if we are above the bias level
         if
         (
            (o > bias_level) &&
            (h > bias_level) &&
            (l > bias_level) &&
            (c > bias_level) &&
            (bias == 1)
         )
           {
            confirmation = 1;
           }

         //--- Check if we are below the bias level
         if
         (
            (o < bias_level) &&
            (h < bias_level) &&
            (l < bias_level) &&
            (c < bias_level) &&
            (bias == -1)
         )
           {
            confirmation = 1;
           }
        }
     }

//--- Check if our confirmation is still valid
   if(confirmation == 1)
     {
      //--- Our bias is bullish
      if(bias == 1)
        {
         //--- Confirmation is lost if we fall beneath the breakout level
         if
         (
            (o < bias_level) &&
            (h < bias_level) &&
            (l < bias_level) &&
            (c < bias_level)
         )
           {
            confirmation = 0;
           }
        }

      //--- Our bias is bearish
      if(bias == -1)
        {
         //--- Confirmation is lost if we rise above the breakout level
         if
         (
            (o > bias_level) &&
            (h > bias_level) &&
            (l > bias_level) &&
            (c > bias_level)
         )
           {
            confirmation = 0;
           }
        }
     }

//--- Do we have a setup?
   if((confirmation == 1) && (bias == 1))
     {
      if(ma_f[0] > ma_s[0])
        {
         if(c > ma_f[0])
           {
            Trade.Buy(vol,Symbol(),ask,channel_low,0,"Volatility Doctor AI");
            initial_sl = channel_low;
           }
        }
     }

   if((confirmation == 1) && (bias == -1))
     {
      if(ma_f[0] < ma_s[0])
        {
         if(c < ma_s[0])
           {
            Trade.Sell(vol,Symbol(),bid,channel_high,0,"Volatility Doctor AI");
            initial_sl = channel_high;
           }
        }
     }
   Comment("O: ",o,"\nH: ",h,"\nL: ",l,"\nC:",c,"\nC H: ",channel_high,"\nC L:",channel_low,"\nBias: ",bias,"\nBias Level: ",bias_level,"\nConfirmation: ",confirmation,"\nMA F: ",ma_f[0],"\nMA S: ",ma_s[0]);
  }
When price levels break outside the channel we initially had, we will mark the extreme price level created by the candle that broke out of the channel. That extreme level is our bias level.
//+---------------------------------------------------------------+
//| Mark our bias levels                                          |
//+---------------------------------------------------------------+
void mark_bias(double f_level)
  {
   ObjectCreate(0,"Bias",OBJ_HLINE,0,0,f_level);the
  }
Finally, if price levels fall back within the trading channel after having previously broken out, we will consider the old channel invalid and update the new position of the channel to the levels created by the break-out candle.
//+---------------------------------------------------------------+
//| Forget our bias levels                                        |
//+---------------------------------------------------------------+
void forget_bias()
  {
   update_channel(bo_h,bo_l);
   bias = 0;
   bias_level = 0;
   confirmation = 0;
   ObjectDelete(0,"Bias");
  }
//+------------------------------------------------------------------+
We are now ready to back-test break out trading strategy. I named the application "MTF Channel 2", which stands for Multiple Time Frame Channel. I selected the EURUSD symbol on the H1 Time frame. Our test dates are the same as the dates we specified earlier. The reader will observe that these 3 particular settings were fixed across all 3 tests.

Fig 4: The first batch of settings used for our initial back test.
These are not all the parameters we set up. We selected Random delay settings to mimic real-time trading scenarios, whereby the latency experienced may vary. We also chose to model the test based on real ticks, to try to get a faithful experience of real trading.

Fig 5: Second batch of settings selected for testing our strategy.
We will fix the settings used on our Expert Advisor so they are the same across all the tests we will perform. Keeping these settings the same will help us isolate the profitability being cause by picking better trading rules.

Fig 6: Our money management settings.
Let's see our strategy in action. In Fig 7 below, we can see on the right-hand side of the screenshot are the internal variables our application is using to make its decisions. Note that all our trades will only be placed if confirmation is set to 1.

Fig 7: Back testing our trading strategy on the EURUSD pair.
Unfortunately, we can see that our strategy was loosing money. This is a sign there is room for improvement.
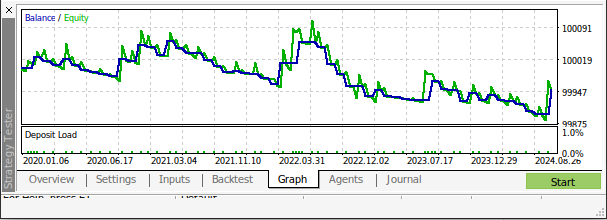
Fig 8: Viewing the graph associated with our back test.
Let's get more details on the test we have just performed. We can clearly see that our strategy identified a total of 53 trades and 70% of them were unprofitable. Our Sharpe ratio is negative. These are poor performance metrics.
On the other hand, our average profit is greater than our average loss, that is a good note. Let us see how we can perform better. We want to exercise more control over our gross and average loss, whilst maximizing our average profit and proportion of profitable trades.
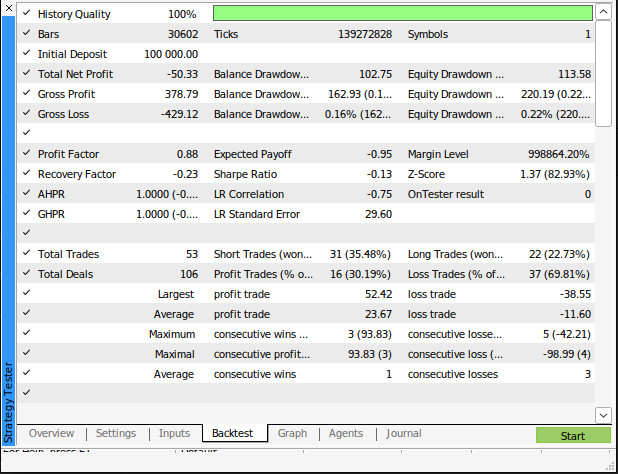
Fig 9: The details of our back test.
Improving On Our First Results
As I was watching the back test, it was frustrating to watch the Expert Advisor make the same mistake repeatedly. Most of our losses were incurred because we were placing trades on meaningless fluctuations in price that just so happened to satisfy all our conditions. The only solution for this, is to select better conditions that may naturally discriminate weak and strong moves in the market.
One option we have is to compare the performance of the EUR and the USD against a common benchmark. We can use GBP for this. We will compare how the EURGBP and GBPUSD pair are performing before we commit to opening a position. That is to say, if on our chart, we observe the EURUSD is in a strong bullish trend, we would also like to see the EURGBP moving in the same trend and the GBPUSD should hopefully also be in a bullish trend.
In other words, if the EURUSD price levels give us the impression that Euros are becoming more expensive than the Dollar, then we will only gain confidence if we also observe the Euro are appreciating over the Great Brutish Pound, while the Dollar is simultaneously becoming cheaper regarding the Great British Pound. This three-way triangular exchange rate, will hopefully help us identify false breakouts. Our reasoning is that, fluctuations that affect all 3 markets at once, may be truly strong moves that we may profit from.
We will add a few lines of code to modify the original trading strategy we have built so far. To implement the changes, we are thinking of, we will first create new global variables to keep track of the price of the EURGBP and the GBPUSD pairs. We will also need to apply technical indicators to our two other markets so we can keep track of the trends in those respective markets.
//+------------------------------------------------------------------+
//| Global variables                                                 |
//+------------------------------------------------------------------+
double channel_high = 0;
double channel_low  = 0;
double o,h,l,c;
int    bias = 0;
double bias_level = 0;
int    confirmation = 0;
double vol,bid,ask,initial_sl;
int    atr_handler,ma_fast,ma_slow;
double atr[],ma_f[],ma_s[];
double bo_h,bo_l;
int    last_trade_state,current_state;
int    eurgbp_willr, gbpusd_willr;
string symbols[] = {"EURGBP","GBPUSD"};
When our Expert Advisor is being loaded for the first time, we will need to perform a few additional steps to keep track of the price action happening in our benchmark symbols. These updates will be implemented in the setup function.
//+---------------------------------------------------------------+
//| Load our technical indicators and market data                 |
//+---------------------------------------------------------------+
void setup(void)
  {
//--- Select the symbols we need
   SymbolSelect("EURGBP",true);
   SymbolSelect("GBPUSD",true);
//--- Reset our last trade state
   last_trade_state = 0;
//--- Mark the current high and low
   channel_high = iHigh("EURUSD",PERIOD_M30,1);
   channel_low  = iLow("EURUSD",PERIOD_M30,1);
   ObjectCreate(0,"Channel High",OBJ_HLINE,0,0,channel_high);
   ObjectCreate(0,"Channel Low",OBJ_HLINE,0,0,channel_low);
//--- Our trading volums
   vol = lot_multiple * SymbolInfoDouble("EURUSD",SYMBOL_VOLUME_MIN);
//--- Our technical indicators
   atr_handler  = iATR("EURUSD",PERIOD_CURRENT,14);
   eurgbp_willr = iWPR(symbols[0],PERIOD_CURRENT,wpr_period);
   gbpusd_willr = iWPR(symbols[1],PERIOD_CURRENT,wpr_period);
   ma_fast      = iMA("EURUSD",PERIOD_CURRENT,ma_f_period,0,MODE_EMA,PRICE_CLOSE);
   ma_slow      = iMA("EURUSD",PERIOD_CURRENT,ma_s_period,0,MODE_EMA,PRICE_CLOSE);
  }
Likewise, when our trading application is no longer in use, we have a few additional technical indicators to release.
//+------------------------------------------------------------------+
//| Expert deinitialization function                                 |
//+------------------------------------------------------------------+
void OnDeinit(const int reason)
  {
//---
   IndicatorRelease(eurgbp_willr);
   IndicatorRelease(gbpusd_willr);
   IndicatorRelease(atr_handler);
   IndicatorRelease(ma_fast);
   IndicatorRelease(ma_slow);
  }
Our OnTick function will remain the same. However, the functions that it will call will be mutated. Firstly, whenever we update our channel, we must update 3 channels in the markets we are following. One on the EURUSD the second on the EURGBP and the last on the GBPUSD.
//+---------------------------------------------------------------+
//| Update channel                                                |
//+---------------------------------------------------------------+
void update_channel(double new_high, double new_low)
  {
   channel_high = new_high;
   channel_low  = new_low;
   ObjectDelete(0,"Channel High");
   ObjectDelete(0,"Channel Low");
   ObjectCreate(0,"Channel High",OBJ_HLINE,0,0,channel_high);
   ObjectCreate(0,"Channel Low",OBJ_HLINE,0,0,channel_low);
  }
Most of the program remained the same, the most significant change we made was that we now required our trading application to check 2 other markets before it decides to commit itself to the trade. If our fundamentals give us confidence that the breakout we are seeing on the EURUSD may be backed by true strength, then we will take the position. These updates will be reflected in the find setup function.
You will also notice that the function is calling a new function that we did not define on the previous version of the break-out strategy application. The additional confirmation function, will check the 2 benchmark markets for our fundamental trading conditions.
//+---------------------------------------------------------------+
//| Find Setup                                                    |
//+---------------------------------------------------------------+
void find_setup(void)
  {
//--- I have omitted code pieces that were unchanged
//--- Do we have a setup?
   if((confirmation == 1) && (bias == 1) && (current_state != last_trade_state))
     {
      if(ma_f[0] > ma_s[0])
        {
         if(c > ma_f[0])
           {
            if(additional_confirmation(1))
              {
               Trade.Buy(vol,"EURUSD",ask,channel_low,0,"Volatility Doctor");
               initial_sl = channel_low;
               last_trade_state = 1;
              }
           }
        }
     }

   if((confirmation == 1) && (bias == -1)  && (current_state != last_trade_state))
     {
      if(ma_f[0] < ma_s[0])
        {
         if(c < ma_s[0])
           {
            if(additional_confirmation(-1))
              {
               Trade.Sell(vol,"EURUSD",bid,channel_high,0,"Volatility Doctor");
               initial_sl = channel_high;
               last_trade_state = -1;
              }
           }
        }
     }
}
This function should help us discriminate market noise from true strength. By looking for confirmation in other related markets, we hope to always pick the strongest trades possible.
//+---------------------------------------------------------------+
//| Check for true strength                                       |
//+---------------------------------------------------------------+
bool additional_confirmation(int flag)
  {
//--- Do we have additional confirmation from our benchmark pairs?

//--- Record the average change in the EURGBP and GBPUSD Market
   vector eurgbp_willr_f = vector::Zeros(1);
   vector gbpusd_willr_f = vector::Zeros(1);

   eurgbp_willr_f.CopyIndicatorBuffer(eurgbp_willr,0,0,1);
   gbpusd_willr_f.CopyIndicatorBuffer(gbpusd_willr,0,0,1);

   if((flag == 1) && (eurgbp_willr_f[0] > -50) && (gbpusd_willr_f[0] < -50))
      return(true);
   if((flag == -1) && (eurgbp_willr_f[0] < -50) && (gbpusd_willr_f[0] > -50))
      return(true);

   Print("EURGBP WPR: ",eurgbp_willr_f[0],"\nGBPUSD WPR: ",gbpusd_willr_f[0]);
   return(false);
  }
This version of our application will be titled "MTF EURUSD Channel". The first version we created was more generalized and could easily be used to trade any other symbol in our terminal. However, this version will use the EURGBP and GBPUSD pairs as benchmarks, and therefore it is more specialized and only intended to trade the EURUSD pair. The reader will remark that our test conditions are all identical with the first test. We will perform this back test using the same time frame and over the same periods as we did in the first test, from the 1 January 2020 until the 30th of November 2024.

Fig 10: The first batch of settings for our back test of the EURUSD Channel Break out strategy.
If you intend on following along with the setup I'm demonstrating here, then be advised that setting the Modelling option to 'Every tick based on real ticks' may prove time-consuming depending on your Internet connection because the MT5 terminal will request rich data from your broker to model the market as realistically as possible. So do not be alarmed if the process may take several minutes to complete, and do not turn off your computer mid-process.

Fig 11: We need to keep the second batch of settings the identical to the settings we used in the first test.
Using a lot multiple of 1 means that all my trades will be placed at minimum lot size. If we can get our system to profitable at minimum lot size, then increasing the lot multiple will serve us well. However, if our system is not profitable at minimum lot, we will gain nothing by increasing the lot size.

Fig 12: The parameters we will use to control our application's behavior.
We can now get to see how our trading system works on historical data. Note that this version of our system monitors 3 markets at once. First we will always keep track of the EURUSD pair, so we can get our bias from it.

Fig 13: Our system in action on the EURUSD pair.
Our positions can only be opened if we observe the EURGBP and GBPUSD pairs, trending in opposite directions as in Fig 14 and 15 below. We will judge the trend in the two markets, using the Williams Percent Range. If the WPR is above the 50 level, we consider the trend bullish.

Fig 14: Our first confirmation pair, the GBPUSD
In this instance, we found a trading opportunity to buy the EURUSD. We identified this opportunity because the WPR readings of the two markets were on opposite sides of the 50 level. This imbalance, is likely to be followed by volatile market conditions, ideal for any breakout strategy.

Fig 15: Our second benchmark pair.
Fig 9 below shows how the balance of our simulated trading account is changing over time. Our goal is to deeply understand why our strategy is failing, so we can try to improve its weakness.
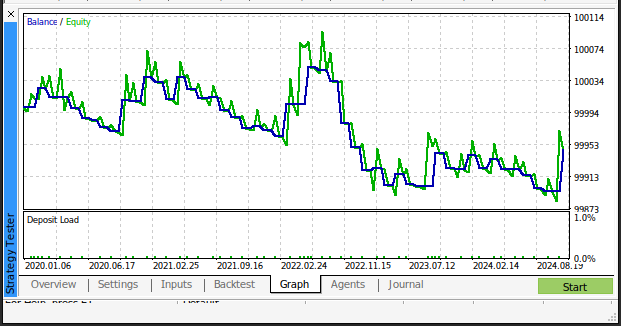
Fig 16: Plotting our account balance over time.
Unfortunately, the changes we made to our system have reduced the profitability of our trading application. Our average loss and profit increased by the same amounts. And the proportion of profitable trades fell marginally.
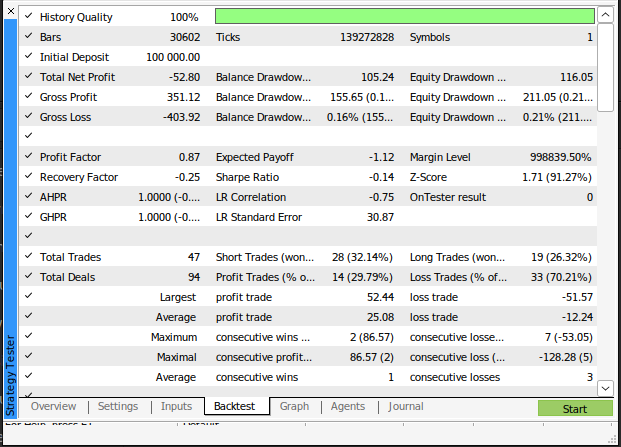
Fig 17: Detailed results from our back test.
Final Attempt To Improve
We failed to get improvement where it counts the most, profitability. Instead of trying to force our views on the market, we will instead allow the computer to learn how to use the moving averages better than what we are capable of doing. Our views on how to trade effectively are biased to a certain degree.
On the other hand, if we allow our computer to learn the relationship between the closing price and the moving average, then our computer can create its own trading rules and trade based on what it expects to happen next, as opposed to the reactive form of trading we have been practicing so far.
To get us started, I created a script to help us extract historical market data. Simply drag and drop the script on the market you desire to trade for us to get started. The script will fetch market data for you, and it will also fetch the two moving averages we need for our strategy in the same format we are using in our trading application.
//+------------------------------------------------------------------+
//|                                                      ProjectName |
//|                                      Copyright 2020, CompanyName |
//|                                       http://www.companyname.net |
//+------------------------------------------------------------------+
#property copyright "Gamuchirai Zororo Ndawana"
#property link      "https://www.mql5.com/en/users/gamuchiraindawa"
#property version   "1.00"
#property script_show_inputs

//+------------------------------------------------------------------+
//| Script Inputs                                                    |
//+------------------------------------------------------------------+
input int size = 100000; //How much data should we fetch?

//+------------------------------------------------------------------+
//| Global variables                                                 |
//+------------------------------------------------------------------+
int    ma_f_handler,ma_s_handler;
double ma_f_reading[],ma_s_reading[];

//+------------------------------------------------------------------+
//| On start function                                                |
//+------------------------------------------------------------------+
void OnStart()
  {
//--- Load indicator
   ma_s_handler  = iMA(Symbol(),PERIOD_CURRENT,60,0,MODE_EMA,PRICE_CLOSE);
   ma_f_handler  = iMA(Symbol(),PERIOD_CURRENT,5,0,MODE_EMA,PRICE_CLOSE);

//--- Load the indicator values
   CopyBuffer(ma_f_handler,0,0,size,ma_f_reading);
   CopyBuffer(ma_s_handler,0,0,size,ma_s_reading);

   ArraySetAsSeries(ma_f_reading,true);
   ArraySetAsSeries(ma_s_reading,true);

//--- File name
   string file_name = "Market Data " + Symbol() +" MA Cross" +  " As Series.csv";

//--- Write to file
   int file_handle=FileOpen(file_name,FILE_WRITE|FILE_ANSI|FILE_CSV,",");

   for(int i= size;i>=0;i--)
     {
      if(i == size)
        {
         FileWrite(file_handle,"Time","Open","High","Low","Close","MA 5","MA 60");
        }

      else
        {
         FileWrite(file_handle,iTime(Symbol(),PERIOD_CURRENT,i),
                   iOpen(Symbol(),PERIOD_CURRENT,i),
                   iHigh(Symbol(),PERIOD_CURRENT,i),
                   iLow(Symbol(),PERIOD_CURRENT,i),
                   iClose(Symbol(),PERIOD_CURRENT,i),
                   ma_f_reading[i],
                   ma_s_reading[i]
                  );
        }
     }
//--- Close the file
   FileClose(file_handle);

  }
//+------------------------------------------------------------------+
Analyzing The Data in Python
Now that you have your market data in CSV format, we can now get started building an AI model that will hopefully help us predict false breakouts and stay away from them.
import pandas as pd
import numpy  as np
from   sklearn.model_selection import TimeSeriesSplit,cross_val_score
from   sklearn.linear_model    import Ridge
from sklearn.metrics import mean_squared_error
import matplotlib.pyplot as plt
import seaborn as sns
Read in the market data we extracted earlier. Pay attention to the Time column in my data frame, notice that the last entry I have is dated 18 April 2019. This is being done deliberately. Recall that starting dates for the previous tests both started on the 1 January 2020. This means we are not fooling ourselves by giving the model all the answers to our test for it.
#Define the forecast horizon
look_ahead          = 24
#Read in the data
data                = pd.read_csv('Market Data EURUSD MA Cross As Series.csv')
#Drop the last 4 years
data                =  data.iloc[:(-24 * 365 * 4),:]
data.reset_index(drop=True,inplace=True)
#Label the data
data['Target']      = data['Close'].shift(-look_ahead)
data['MA 5 Target']      = data['MA 5'].shift(-look_ahead)
data['MA 5 Close Target']      = data['Target'] - data['MA 5 Target']
data['MA 60 Target']      = data['MA 60'].shift(-look_ahead)
data['MA 60 Close Target']      = data['Target'] - data['MA 60 Target']
data.dropna(inplace=True)
data.reset_index(drop=True,inplace=True)
data
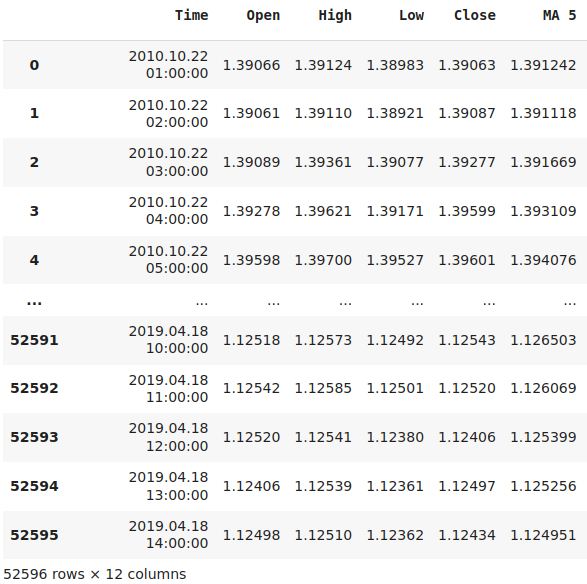
Fig 18: Our historical market data.
Let us test to see if in the EURUSD market, the moving averages are still easier to predict the price itself. To test, our hypothesis, we will train 30 identical neural networks to predict 3 targets one by one. First we will predict the future price, the 5 period moving average and the 60 period moving average. All targets will be projected 24 steps into the future. First, we will record our accuracy predicting price directly.
#Classical error
classical_error = []
epochs = 1000
for i in np.arange(0,30):
  model = MLPRegressor(hidden_layer_sizes=(10,4),max_iter=epochs,early_stopping=False,solver='lbfgs')
  classical_error.append(np.mean(np.abs(cross_val_score(model,data.loc[:,['Open','High','Low','Close']],data.loc[:,'Target'],cv=tscv,scoring='neg_mean_squared_error'))))
Next, we will record our accuracy predicting the 5 period moving average.
#MA Cross Over error
ma_5_error = []
for i in np.arange(0,30):
  model = MLPRegressor(hidden_layer_sizes=(10,4),max_iter=epochs,early_stopping=False,solver='lbfgs')
  ma_5_error.append(np.mean(np.abs(cross_val_score(model,data.loc[:,['Open','High','Low','Close','MA 5']],data.loc[:,'MA 5 Target'],cv=tscv,scoring='neg_mean_squared_error'))))
Lastly, we will record our accuracy predicting the 60 period moving average.
#New error
ma_60_error = []
for i in np.arange(0,30):
  model = MLPRegressor(hidden_layer_sizes=(10,4),max_iter=10000,early_stopping=False,solver='lbfgs')
  ma_60_error.append(np.mean(np.abs(cross_val_score(model,data.loc[:,['Open','High','Low','Close','MA 60']],data.loc[:,'MA 60 Target'],cv=tscv,scoring='neg_mean_squared_error'))))
When we plot our results. As we can see from Fig 12 below, predicting the 60 period moving average created the most error in our system, and predicting the 5 period moving average produced less error than predicting price directly.
plt.plot(classical_error)
plt.plot(ma_5_error)
plt.plot(ma_60_error)
plt.legend(['OHLC','MA 5 ','MA 60'])
plt.axhline(np.mean(classical_error),color='blue',linestyle='--')
plt.axhline(np.mean(ma_5_error),color='orange',linestyle='--')
plt.axhline(np.mean(ma_60_error),color='green',linestyle='--')
plt.grid()
plt.ylabel('Cross Validated Error')
plt.xlabel('Iteration')
plt.title('Comparing Different The Error Associated With Different Targets')
plt.show()
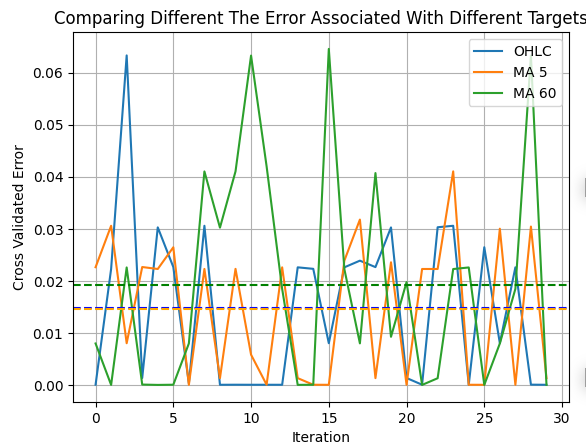
Fig 19: Visualizing the error associated with different targets.
Now let us attempt to export a model for our trading application. Import the libraries we need.
import onnx
from skl2onnx import convert_sklearn
from skl2onnx.common.data_types import FloatTensorType
from sklearn.neural_network import MLPRegressor
Specify the models we need. I'll use 2 models for this task, since the short period moving average is easy to predict I'll use a simple Ridge model to forecast it. However, our 60 period moving average proved challenging. Therefore, I'll use a neural network to predict the long term moving average.
ma_5_model = Ridge()
ma_5_model.fit(data[['Open','High','Low','Close','MA 5']],data['MA 5 Target'])
ma_5_height_model = Ridge()
ma_5_height_model.fit(data[['Open','High','Low','Close','MA 5']],data['MA 5 Close Target'])
ma_60_model = Ridge()
ma_60_model.fit(data[['Open','High','Low','Close','MA 60']],data['MA 60 Target'])
ma_60_height_model = Ridge()
ma_60_height_model.fit(data[['Open','High','Low','Close','MA 60']],data['MA 60 Close Target'])
Prepare to export to ONNX.
initial_type = [('float_input', FloatTensorType([1, 5]))]
ma_5_onx = convert_sklearn(ma_5_model, initial_types=initial_type, target_opset=12 )
ma_5_height_onx = convert_sklearn(ma_5_height_model, initial_types=initial_type, target_opset=12 )
ma_60_height_onx = convert_sklearn(ma_60_height_model, initial_types=initial_type, target_opset=12 )
ma_60_onx = convert_sklearn(ma_60_model, initial_types=initial_type, target_opset=12 )
Save to ONNX format.
onnx.save(ma_5_onx,'eurchf_ma_5_model.onnx')
onnx.save(ma_60_onx,'eurchf_ma_60_model.onnx')
onnx.save(ma_5_height_onx,'eurusd_ma_5_height_model.onnx')
onnx.save(ma_60_height_onx,'eurusd_ma_60_height_model.onnx')
Final Updates In MQL5
Let us apply our new models to see if they can help us filter out false breakouts in the market. The first update we need to make is importing the ONNX models we have just created.
//+------------------------------------------------------------------+
//|                                                MTF Channel 2.mq5 |
//|                                        Gamuchirai Zororo Ndawana |
//|                          https://www.mql5.com/en/gamuchiraindawa |
//+------------------------------------------------------------------+
#property copyright "Gamuchirai Zororo Ndawana"
#property link      "https://www.mql5.com/en/gamuchiraindawa"
#property version   "1.00"

//+------------------------------------------------------------------+
//| ONNX Resources                                                   |
//+------------------------------------------------------------------+
#resource "\\Files\\eurusd_ma_5_model.onnx"         as const uchar eurusd_ma_5_buffer[];
#resource "\\Files\\eurusd_ma_60_model.onnx"        as const uchar eurusd_ma_60_buffer[];
#resource "\\Files\\eurusd_ma_5_height_model.onnx"  as const uchar eurusd_ma_5_height_buffer[];
#resource "\\Files\\eurusd_ma_60_height_model.onnx" as const uchar eurusd_ma_60_height_buffer[];
Next, we need to create a few new variables associated with our models.
//+------------------------------------------------------------------+
//| Global varaibles                                                 |
//+------------------------------------------------------------------+
int     bias = 0;
int     state = 0;
int     confirmation = 0;
int     last_cross_over_state = 0;
int     atr_handler,ma_fast,ma_slow;
int     last_trade_state,current_state;
long    ma_5_model;
long    ma_60_model;
long    ma_5_height_model;
long    ma_60_height_model;
double  channel_high = 0;
double  channel_low  = 0;
double  o,h,l,c;
double  bias_level = 0;
double  vol,bid,ask,initial_sl;
double  atr[],ma_f[],ma_s[];
double  bo_h,bo_l;
vectorf ma_5_forecast = vectorf::Zeros(1);
vectorf ma_60_forecast = vectorf::Zeros(1);
vectorf ma_5_height_forecast = vectorf::Zeros(1);
vectorf ma_60_height_forecast = vectorf::Zeros(1);
We must extend the initialization routine so that it will now set up our ONNX models for us.
//+---------------------------------------------------------------+
//| Load our technical indicators and market data                 |
//+---------------------------------------------------------------+
void setup(void)
  {
//--- Reset our last trade state
   last_trade_state = 0;
//--- Mark the current high and low
   channel_high = iHigh("EURUSD",PERIOD_M30,1);
   channel_low  = iLow("EURUSD",PERIOD_M30,1);
   ObjectCreate(0,"Channel High",OBJ_HLINE,0,0,channel_high);
   ObjectCreate(0,"Channel Low",OBJ_HLINE,0,0,channel_low);
//--- Our trading volums
   vol = lot_multiple * SymbolInfoDouble("EURUSD",SYMBOL_VOLUME_MIN);
//--- Our technical indicators
   atr_handler  = iATR("EURUSD",PERIOD_CURRENT,14);
   ma_fast      = iMA("EURUSD",PERIOD_CURRENT,ma_f_period,0,MODE_EMA,PRICE_CLOSE);
   ma_slow      = iMA("EURUSD",PERIOD_CURRENT,ma_s_period,0,MODE_EMA,PRICE_CLOSE);
//--- Setup our ONNX models
//--- Define our ONNX model
   ulong input_shape [] = {1,5};
   ulong output_shape [] = {1,1};

//--- Create the model
   ma_5_model = OnnxCreateFromBuffer(eurusd_ma_5_buffer,ONNX_DEFAULT);
   ma_60_model = OnnxCreateFromBuffer(eurusd_ma_60_buffer,ONNX_DEFAULT);
   ma_5_height_model = OnnxCreateFromBuffer(eurusd_ma_5_height_buffer,ONNX_DEFAULT);
   ma_60_height_model = OnnxCreateFromBuffer(eurusd_ma_60_height_buffer,ONNX_DEFAULT);

//--- Store our models in a list
   long onnx_models[] = {ma_5_model,ma_5_height_model,ma_60_model,ma_60_height_model};

//--- Loop over the models and set them up
   for(int i = 0; i < 4; i++)
     {
      if(onnx_models[i] == INVALID_HANDLE)
        {
         Comment("Failed to load AI module correctly: Invalid handle");
        }

      //--- Validate I/O
      if(!OnnxSetInputShape(onnx_models[i],0,input_shape))
        {
         Comment("Failed to set input shape correctly:  Wrong input shape ",GetLastError()," Actual shape: ",OnnxGetInputCount(ma_5_model));
        }

      if(!OnnxSetOutputShape(onnx_models[i],0,output_shape))
        {
         Comment("Failed to load AI module correctly: Wrong output shape ",GetLastError()," Actual shape: ",OnnxGetOutputCount(ma_5_model));
        }
     }
  }
If our system is no longer in use, we should free up the resources we are no longer using.
//+------------------------------------------------------------------+
//| Expert deinitialization function                                 |
//+------------------------------------------------------------------+
void OnDeinit(const int reason)
  {
//--- Free the resources we don't need
   IndicatorRelease(atr_handler);
   IndicatorRelease(ma_fast);
   IndicatorRelease(ma_slow);
   OnnxRelease(ma_5_model);
   OnnxRelease(ma_5_height_model);
   OnnxRelease(ma_60_model);
   OnnxRelease(ma_60_height_model);
  }
When we receive updated prices, the only big difference here is that we will also seek to obtain a forecast from our AI models.
//+------------------------------------------------------------------+
//| Expert tick function                                             |
//+------------------------------------------------------------------+
void OnTick()
  {
//--- Keep track of time
   static datetime timestamp;
   datetime time = iTime(Symbol(),PERIOD_CURRENT,0);
   if(timestamp != time)
     {
      //--- Time Stamp
      timestamp = time;
      //--- Update system variables
      update();
      //--- Make a new prediction
      model_predict();
      if(PositionsTotal() == 0)
        {
         state = 0;
         find_setup();
        }
     }

//--- If we have positions open
   if(PositionsTotal() > 0)
      manage_setup();
  }
We have to define the function responsible for fetching a prediction from our ONNX models in MQL5.
//+------------------------------------------------------------------+
//| Get a prediction from our model                                  |
//+------------------------------------------------------------------+
void model_predict(void)
  {
   //--- Moving average inputs
   float  a = (float) ma_f[0];
   float  b = (float) ma_s[0];

   //--- Price quotes
   float op = (float) iOpen("EURUSD",PERIOD_H1,0);
   float hi = (float) iHigh("EURUSD",PERIOD_H1,0);
   float lo = (float) iLow("EURUSD",PERIOD_H1,0);
   float cl = (float) iClose("EURUSD",PERIOD_H1,0);

   //--- ONNX inputs
   vectorf fast_inputs = {op,hi,lo,cl,a};
   vectorf slow_inputs = {op,hi,lo,cl,b};

   Print("Fast inputs: ",fast_inputs);
   Print("Slow inputs: ",slow_inputs);

   //--- Inference
   OnnxRun(ma_5_model,ONNX_DATA_TYPE_FLOAT,fast_inputs,ma_5_forecast);
   OnnxRun(ma_5_height_model,ONNX_DATA_TYPE_FLOAT,fast_inputs,ma_5_height_forecast);
   OnnxRun(ma_60_model,ONNX_DEFAULT,slow_inputs,ma_60_forecast);
   OnnxRun(ma_60_height_model,ONNX_DATA_TYPE_FLOAT,fast_inputs,ma_60_height_forecast);
  }
The last change we made affects how our strategy will pick its trades. Instead of simply going in head first, our strategy will now place its trades based on the relationship it has learned between price and the moving average. Our trading application now has the flexibility to buy and sell even if it goes against the bias we believe is in the market.
Note there is a new function being called, valid setup, this function simply returns true if our breakout conditions are true.
//+---------------------------------------------------------------+
//| Find a setup                                                  |
//+---------------------------------------------------------------+
void find_setup(void)
{
//--- I have skipped parts of the code that remained the same
   if(valid_setup())
     {
      //--- Both models are forecasting rising prices
      if((c < (ma_60_forecast[0] + ma_60_height_forecast[0])) && (c < (ma_5_forecast[0] + ma_5_height_forecast[0])))
        {
         if(last_trade_state != 1)
           {
            Trade.Buy(vol,"EURUSD",ask,0,0,"Volatility Doctor");
            initial_sl = channel_low;
            last_trade_state = 1;
            last_cross_over_state = current_state;
           }
        }

      //--- Both models are forecasting falling prices
      if((c > (ma_60_forecast[0] + ma_60_height_forecast[0])) && (c > (ma_5_forecast[0] + ma_5_height_forecast[0])))
        {
         if(last_trade_state != -1)
           {
            Trade.Sell(vol,"EURUSD",bid,0,0,"Volatility Doctor");
            initial_sl = channel_high;
            last_trade_state = -1;
            last_cross_over_state = current_state;
           }
        }
     }
Check if we have broken out of the channel. If we have, the function will return true, otherwise false.
//+---------------------------------------------------------------+
//| Do we have a valid setup?                                     |
//+---------------------------------------------------------------+
bool valid_setup(void)
  {
   return(((confirmation == 1) && (bias == -1)  && (current_state != last_cross_over_state)) || ((confirmation == 1) && (bias == 1) && (current_state != last_cross_over_state)));
  }
I believe by now you are familiar with the settings we will specify for our back test. Recall, it is important to keep these settings consistent so we can isolate the changes in profitability that are associated with the changes we are making to our trading rules.

Fig 20: Some of the settings we will use for back testing our last trading strategy.
Recall that our model was only trained until 2019, but our test begins in 2020l. Therefore, we are closely simulating what actually would've happened if we had designed this system in the past.

Fig 21: The second batch of settings we will use for back testing our last trading strategy.
Again, our settings are the same across all three tests.

Fig 22: The settings we will use to control our application in the last test.
We can now see our model-based breakout trading application in action on the EURUSD. Recall that none of this data was shown to the models when were training them.
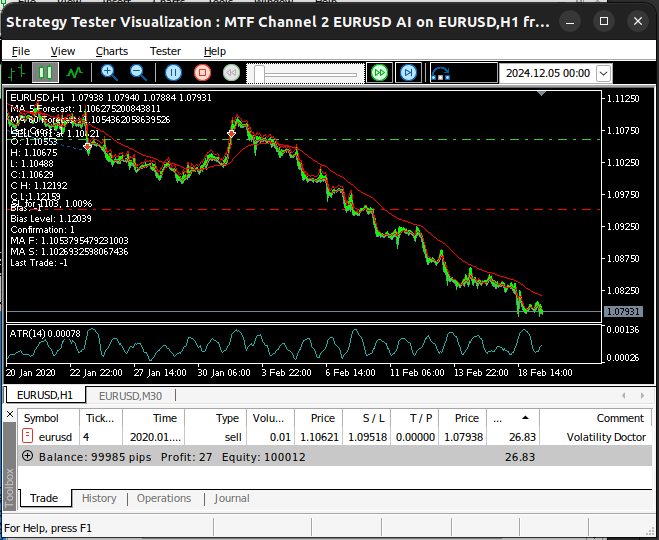
Fig 23: Our final model-based version of the breakout strategy in action.
We can see from Fig 23 below that we have finally managed to rectify the characteristic negative slope that our model had from the beginning, and we are now becoming more profitable.
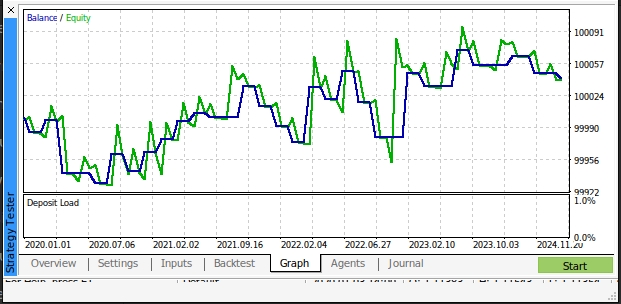
Fig 24: The back test results from testing our new model-based strategy.
Our goal was to increase the average profit and decrease the proportion of loosing trades, which we did. Our gross loss was $498 in the first test, $403 in the second test, and now it is $298. At the same time, our gross profit was $378 in the first test and is at $341 in this final test. So clearly, the changes we have made have been reducing our gross loss while keeping the gross profit almost the same. In our first system, 70% of all our trades were unprofitable. However, with our new system only 55% of all our trades were unprofitable.
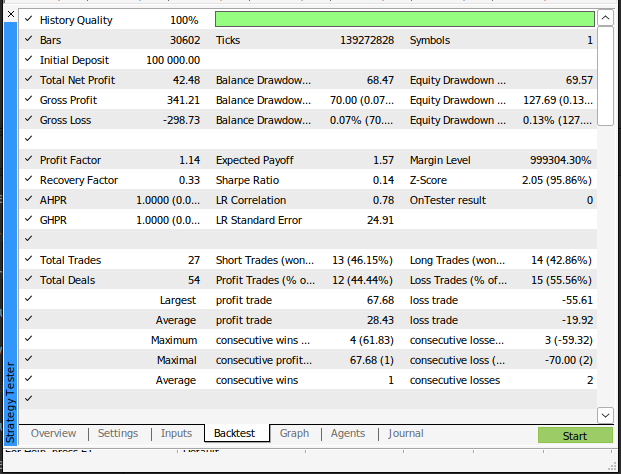
Fig 25: Detailed back test results from our model-based strategy.
Conclusion
Breakouts are potentially the best time of day to trade. The challenge posed by correctly identifying them is not to be taken lightly. In this article, we have worked together to build our own breakout trading strategy. We added more filters to our strategy in an attempt to make it more profitable. It may be the case that breakout strategies aren't ideal for the EURUSD market, and we may need to approach this market from a different angle. However, to successfully build a breakout trading strategy will take more time and effort than we have shared in this article, but the ideas we have shared here may be worth considering in your journey to success.
| File Name | Description |
|---|---|
| MQL5 EURUSD AI | Jupyter notebook used to build our model of the EURUSD market. |
| EURUSD MA 60 Model | ONNX model used to forecast the 60 period Moving Average. |
| EURUSD MA 60 Height Model | ONNX model used to forecast the difference between the future Close price and future 60 MA |
| EURUSD MA 5 Model | ONNX model intended to forecast the 5 period Moving Average. |
| EURUSD MA 5 Height Model | ONNX model used to forecast the difference between the future Close price and future 5 MA |
| MTF Channel 2 | The first implementation of our break-out strategy. |
| MTF Channel 2 EURUSD | The second implementation of our break-out strategy that used confirmation from benchmark pairs. |
| MTF Channel 2 EURUSD AI | The third implementation of our break-out strategy that was model-based. |
 Trading with the MQL5 Economic Calendar (Part 5): Enhancing the Dashboard with Responsive Controls and Filter Buttons
 Trading Insights Through Volume: Trend Confirmation
 Utilizing CatBoost Machine Learning model as a Filter for Trend-Following Strategies
 Price Action Analysis Toolkit Development Part (4): Analytics Forecaster EA
- Free trading apps
- Over 8,000 signals for copying
- Economic news for exploring financial markets
You agree to website policy and terms of use