
Developing A Swing Entries Monitoring (EA)
Contents:
- Introduction
- A Brief Recap of BTCUSD from 2021 to 2024
- Developing Swing Entry Monitoring EA
- Testing and Optimization
- Results and Analysis
- Conclusion
Introduction
BTCUSD is one of the prominent trading pairs with a significant long-term outlook. Today, we’ve selected it as an example to guide our development process.
Bitcoin's price is characterized by high volatility, driven by market sentiment, macroeconomic factors, and evolving regulatory landscapes. Identifying profitable entry levels amid these fluctuations is a challenging task, especially for traders relying solely on manual analysis. For instance, in the past two years, BTC's price has ranged from lows around $16,000 to its all-time high of $99,645.39 in November 2024. During this period, several key entry opportunities emerged around the EMA 100, offering valuable insights for long-term trading strategies.
The solution to the above challenge is to develop an MQL5 monitoring EA for long-term trade entry signals. This EA will:
- Continuously monitor a given pair's price movements.
- Use the EMA 100 as a dynamic support or resistance level to identify potential entry opportunities.
- Alert traders when specific conditions, like price bounces off the EMA 100, are met.
This tool will automate analysis, enabling traders to focus on decision-making rather than constant monitoring
The image below highlights key support levels for BTC aligned with the 100-day EMA.
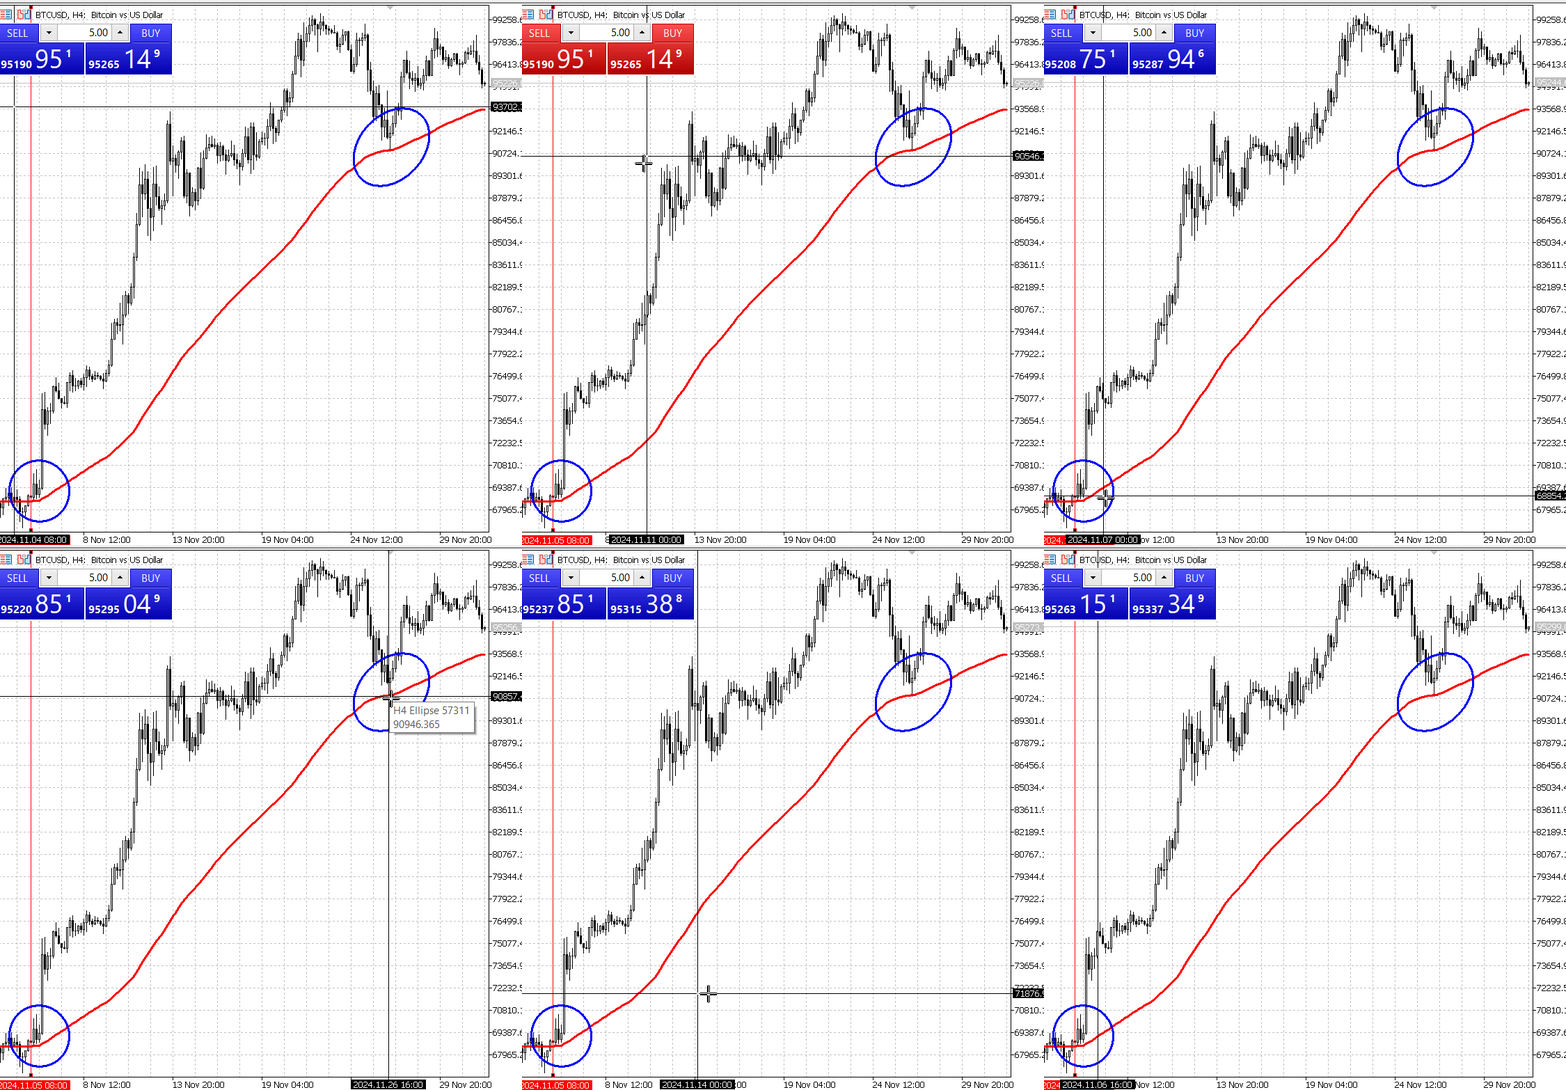
BTCUSD, H4: Bitcoin vs US Dollar: Price Bounce EMA 100
A Brief Recap of BTCUSD from 2021 to 2024
Between 2021 and 2024, Bitcoin experienced dramatic price shifts. After a steep decline in 2022, closing below $20,000 due to rising interest rates and market downturns, it rebounded in 2023, starting at $16,530 and ending at $42,258. In 2024, Bitcoin surged following Bitcoin Spot ETF approvals and a U.S. Federal Reserve rate cut, peaking at $99,645.39 in November.
At the time of writing, the pair is trading at approximately $97,300, representing a significant 146.5% increase compared to its price a year ago. Its all-time high, according to CoinGecko, was $99,645.39, recorded in early December 2024.
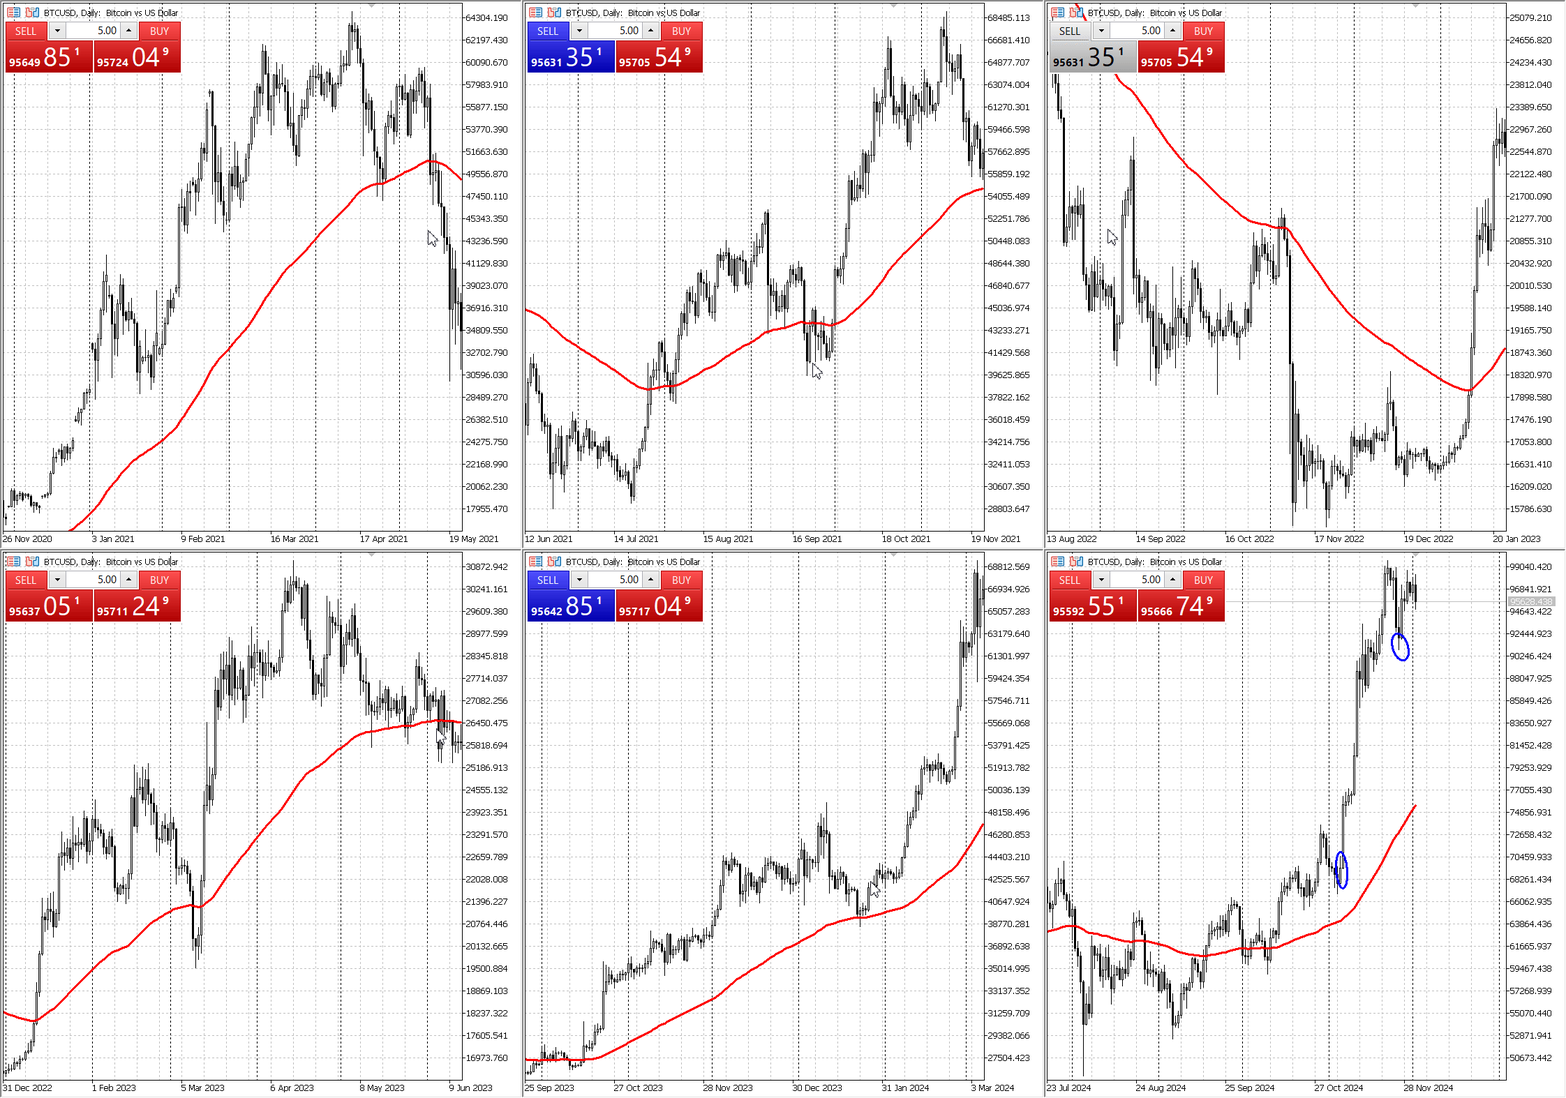
BTCUSD Daily Chart Price View 2021-2024
Developing a Swing Entry Monitoring (EA)
I have organized the development process into three steps to streamline our progress toward creating a fully functional Expert Advisor. The first step involves understanding the Moving Average we are utilizing, which forms the foundation for developing our custom indicator. This indicator will serve as a standalone tool and also lay the groundwork for building our Monitoring Expert Advisor in subsequent steps.
Step 1: Understanding the EMA 100 Strategy
The Exponential Moving Average (EMA) is a widely used indicator that places greater weight on recent data. The EMA 100, in particular, is a critical level in pair trading, often serving as a strong support or resistance point. Many profitable Bitcoin entry opportunities have historically occurred when the price bounced off the EMA 100, especially during volatile periods.
Step 2: Monitoring Indicator
Since we are using the Exponential Moving Average (EMA), an inbuilt feature of the MetaTrader 5 terminal, I decided to first develop a monitoring indicator that leverages these built-in tools. This approach simplifies the process of identifying key areas of interest during price action. Based on my experience, the indicator is capable of sending alerts via terminal notifications, push notifications, and even email.
However, it lacks the ability to handle web requests for advanced alerting services, such as integration with popular social networks. To overcome this limitation, we will move to Step 3, where the indicator will be enhanced into an Expert Advisor (EA). This transformation will enable more robust functionalities, including seamless communication through Telegram, ensuring a comprehensive and efficient monitoring system.
Here is the development breakdown of our Monitoring indicator;
Properties and Metadata:
This section defines essential metadata for the Expert Advisor (EA), including the copyright holder, a link to the author's profile, the version number, and a brief description of the Indicator's purpose. This information is crucial for documentation, helping users understand the creator and the intended functionality at a glance.
#property copyright "Clemence Benjamin"
#property link      "https://www.mql5.com/en/users/billionaire2024/seller"
#property version   "1.0"
#property description "EMA 100 Monitoring Indicator"
In this part, we configure the visual representations that will appear on the trading chart. The #property indicator_chart_window directive indicates that the EA will operate within the main chart window. By defining two indicator buffers (indicator_buffers 2), we prepare for displaying two distinct signals. The properties' indicator_type1 and indicator_type2 specify that both indicators will be visualized as arrows, with distinct colors (orange and blue) and labels indicating "Look for EMA 100 bounce." This setup enhances clarity for traders by providing immediate visual cues for potential trading opportunities based on the price's interaction with the Exponential Moving Average (EMA).
///Properties and Settings

#property indicator_chart_window
#property indicator_buffers 2
#property indicator_plots 2

#property indicator_type1 DRAW_ARROW
#property indicator_width1 5
#property indicator_color1 0xFFAA00
#property indicator_label1 "Look for EMA 100 bounce "

#property indicator_type2 DRAW_ARROW
#property indicator_width2 5
#property indicator_color2 0x0000FF
#property indicator_label2 "Look for EMA 100 bounce "
Buffer Definitions
This section defines the indicator buffers that hold values for the signals generated by the EA. Buffer1 and Buffer2 are declared as double arrays, which will store data for the two types of signals related to price movements and the EMA. The constants PLOT_MAXIMUM_BARS_BACK and OMIT_OLDEST_BARS are set to manage how many historical bars are processed, ensuring the program runs efficiently without overwhelming the system with outdated data. This design choice helps maintain performance while providing relevant and timely information to the user.
#define PLOT_MAXIMUM_BARS_BACK 5000
#define OMIT_OLDEST_BARS 50

//--- indicator buffers
double Buffer1[];
double Buffer2[];
Input Parameters:
In this part, we define user-configurable input parameters that enhance the EA's flexibility. The input int EMA_Period = 100; allows users to specify the period for calculating the Exponential Moving Average, making the EA adaptable to various trading strategies. Additionally, flags like Audible_Alerts and Push_Notifications are set to true by default, enabling real-time alerts and notifications for significant market events. Other variables such as Low, High, and MA_handle are also declared, which will store price data and handle moving average calculations, playing a crucial role in the EA's operations.
input int EMA_Period = 100;
datetime time_alert; //used when sending alert
bool Audible_Alerts = true;
bool Push_Notifications = true;
double myPoint; //initialized in OnInit
double Low[];
int MA_handle;
double MA[];
double High[];
Alert Function:
The myAlert function is designed to centralize alert management within the EA. It takes two parameters: type, which specifies the nature of the alert (e.g., "print", "error", "indicator"), and message, which contains the alert text. Depending on the type, the function either prints messages for debugging or sends alerts related to market changes. This approach improves code organization and readability, allowing for easier maintenance. By providing both audible alerts and push notifications, this function ensures that users remain informed about important market movements, which is critical for timely trading decisions.
void myAlert(string type, string message)
  {
   if(type == "print")
      Print(message);
   else if(type == "error")
     {
      Print(type+" | EMA 100 Monitor @ "+Symbol()+","+IntegerToString(Period())+" | "+message);
     }
   else if(type == "order")
     {
     }
   else if(type == "modify")
     {
     }
   else if(type == "indicator")
     {
      Print(type+" | EMA 100 Monitor @ "+Symbol()+","+IntegerToString(Period())+" | "+message);
      if(Audible_Alerts) Alert(type+" | EMA 100 Monitor @ "+Symbol()+","+IntegerToString(Period())+" | "+message);
      if(Push_Notifications) SendNotification(type+" | EMA 100 Monitor @ "+Symbol()+","+IntegerToString(Period())+" | "+message);
     }
  }
Initialization Function:
The OnInit function is the entry point when the EA is loaded. It initializes the indicator buffers and sets up the calculations for the Exponential Moving Average. The use of SetIndexBuffer links the defined buffers to the indicator plots, ensuring that values can be displayed on the chart. The function also checks for the successful creation of the moving average handle (MA_handle), providing error handling that enhances robustness. If any issues occur during initialization, clear error messages are printed, allowing users to troubleshoot effectively. This thorough setup is essential for the EA to function properly from the outset.
//+------------------------------------------------------------------+
//| Custom indicator initialization function                         |
//+------------------------------------------------------------------+
int OnInit()
  {
   SetIndexBuffer(0, Buffer1);
   PlotIndexSetDouble(0, PLOT_EMPTY_VALUE, EMPTY_VALUE);
   PlotIndexSetInteger(0, PLOT_DRAW_BEGIN, MathMax(Bars(Symbol(), PERIOD_CURRENT)-PLOT_MAXIMUM_BARS_BACK+1, OMIT_OLDEST_BARS+1));
   PlotIndexSetInteger(0, PLOT_ARROW, 233);
   SetIndexBuffer(1, Buffer2);
   PlotIndexSetDouble(1, PLOT_EMPTY_VALUE, EMPTY_VALUE);
   PlotIndexSetInteger(1, PLOT_DRAW_BEGIN, MathMax(Bars(Symbol(), PERIOD_CURRENT)-PLOT_MAXIMUM_BARS_BACK+1, OMIT_OLDEST_BARS+1));
   PlotIndexSetInteger(1, PLOT_ARROW, 234);
   //initialize myPoint
   myPoint = Point();
   if(Digits() == 5 || Digits() == 3)
     {
      myPoint *= 10;
     }
   MA_handle = iMA(NULL, PERIOD_CURRENT, EMA_Period, 0, MODE_SMA, PRICE_CLOSE);
   if(MA_handle < 0)
     {
      Print("The creation of iMA has failed: MA_handle=", INVALID_HANDLE);
      Print("Runtime error = ", GetLastError());
      return(INIT_FAILED);
     }

   return(INIT_SUCCEEDED);
  }
Calculation Function:
The OnCalculate function is the heart of the EA, where the logic for calculating indicator values resides. It processes incoming market data, retrieves price information, and calculates the moving average. The function begins by determining how many rates need to be processed based on the total and previously calculated rates. It then initializes the buffers and retrieves necessary data, such as low and high prices, before entering the main loop. This loop iterates through the price data, checking conditions for generating trading signals based on the relationship between the price and the EMA. The efficiency of this function is crucial, as it allows the EA to respond dynamically to market changes in real-time.
int OnCalculate(const int rates_total,
                const int prev_calculated,
                const datetime& time[],
                const double& open[],
                const double& high[],
                const double& low[],
                const double& close[],
                const long& tick_volume[],
                const long& volume[],
                const int& spread[])
  {
   int limit = rates_total - prev_calculated;
   //--- counting from 0 to rates_total
   ArraySetAsSeries(Buffer1, true);
   ArraySetAsSeries(Buffer2, true);
   //--- initial zero
   if(prev_calculated < 1)
     {
      ArrayInitialize(Buffer1, EMPTY_VALUE);
      ArrayInitialize(Buffer2, EMPTY_VALUE);
     }
   else
      limit++;
   datetime Time[];

   if(CopyLow(Symbol(), PERIOD_CURRENT, 0, rates_total, Low) <= 0) return(rates_total);
   ArraySetAsSeries(Low, true);
   if(BarsCalculated(MA_handle) <= 0)
      return(0);
   if(CopyBuffer(MA_handle, 0, 0, rates_total, MA) <= 0) return(rates_total);
   ArraySetAsSeries(MA, true);
   if(CopyHigh(Symbol(), PERIOD_CURRENT, 0, rates_total, High) <= 0) return(rates_total);
   ArraySetAsSeries(High, true);
   if(CopyTime(Symbol(), Period(), 0, rates_total, Time) <= 0) return(rates_total);
   ArraySetAsSeries(Time, true);
Main Logic:
Within the OnCalculate function, the main logic loop analyzes price movements in relation to the EMA. It checks for specific conditions, such as when the low price crosses below the EMA or when the high price crosses above it. When these conditions are met, the respective buffers (Buffer1 for a bounce below the EMA and Buffer2 for a bounce above) are populated with the current low or high prices, and alerts are triggered for the user. This mechanism is fundamental for providing actionable trading signals, enabling traders to make informed decisions based on technical analysis. The clear and structured approach to setting indicator values ensures that users receive timely and relevant information about potential trading opportunities.
//--- main loop
   for(int i = limit-1; i >= 0; i--)
     {
      if (i >= MathMin(PLOT_MAXIMUM_BARS_BACK-1, rates_total-1-OMIT_OLDEST_BARS)) continue; //omit some old rates to prevent "Array out of range" or slow calculation

      //Indicator Buffer 1
      if(Low[i] < MA[i]
      && Low[i+1] > MA[i+1] //Candlestick Low crosses below Moving Average
      )
        {
         Buffer1[i] = Low[i]; //Set indicator value at Candlestick Low
         if(i == 1 && Time[1] != time_alert) myAlert("indicator", "Look for EMA 100 bounce "); //Alert on next bar open
         time_alert = Time[1];
        }
      else
        {
         Buffer1[i] = EMPTY_VALUE;
        }
      //Indicator Buffer 2
      if(High[i] > MA[i]
      && High[i+1] < MA[i+1] //Candlestick High crosses above Moving Average
      )
        {
         Buffer2[i] = High[i]; //Set indicator value at Candlestick High
         if(i == 1 && Time[1] != time_alert) myAlert("indicator", "Look for EMA 100 bounce "); //Alert on next bar open
         time_alert = Time[1];
        }
      else
        {
         Buffer2[i] = EMPTY_VALUE;
        }
     }
   return(rates_total);
  }
//+------------------------------------------------------------------+
The full code for the indicators is here, with no errors:
#property copyright "Clemence Benjamin"
#property link      "https://www.mql5.com/en/users/billionaire2024/seller"
#property version   "1.0"
#property description "EMA 100 Monitoring Indicator"

//--- indicator settings
#property indicator_chart_window
#property indicator_buffers 2
#property indicator_plots 2

#property indicator_type1 DRAW_ARROW
#property indicator_width1 5
#property indicator_color1 0xFFAA00
#property indicator_label1 "Look for EMA 100 bounce "

#property indicator_type2 DRAW_ARROW
#property indicator_width2 5
#property indicator_color2 0x0000FF
#property indicator_label2 "Look for EMA 100 bounce "

#define PLOT_MAXIMUM_BARS_BACK 5000
#define OMIT_OLDEST_BARS 50

//--- indicator buffers
double Buffer1[];
double Buffer2[];

input int EMA_Period = 100;
datetime time_alert; //used when sending alert
bool Audible_Alerts = true;
bool Push_Notifications = true;
double myPoint; //initialized in OnInit
double Low[];
int MA_handle;
double MA[];
double High[];

void myAlert(string type, string message)
  {
   if(type == "print")
      Print(message);
   else if(type == "error")
     {
      Print(type+" | EMA 100 Monitor @ "+Symbol()+","+IntegerToString(Period())+" | "+message);
     }
   else if(type == "order")
     {
     }
   else if(type == "modify")
     {
     }
   else if(type == "indicator")
     {
      Print(type+" | EMA 100 Monitor @ "+Symbol()+","+IntegerToString(Period())+" | "+message);
      if(Audible_Alerts) Alert(type+" | EMA 100 Monitor @ "+Symbol()+","+IntegerToString(Period())+" | "+message);
      if(Push_Notifications) SendNotification(type+" | EMA 100 Monitor @ "+Symbol()+","+IntegerToString(Period())+" | "+message);
     }
  }

//+------------------------------------------------------------------+
//| Custom indicator initialization function                         |
//+------------------------------------------------------------------+
int OnInit()
  {
   SetIndexBuffer(0, Buffer1);
   PlotIndexSetDouble(0, PLOT_EMPTY_VALUE, EMPTY_VALUE);
   PlotIndexSetInteger(0, PLOT_DRAW_BEGIN, MathMax(Bars(Symbol(), PERIOD_CURRENT)-PLOT_MAXIMUM_BARS_BACK+1, OMIT_OLDEST_BARS+1));
   PlotIndexSetInteger(0, PLOT_ARROW, 233);
   SetIndexBuffer(1, Buffer2);
   PlotIndexSetDouble(1, PLOT_EMPTY_VALUE, EMPTY_VALUE);
   PlotIndexSetInteger(1, PLOT_DRAW_BEGIN, MathMax(Bars(Symbol(), PERIOD_CURRENT)-PLOT_MAXIMUM_BARS_BACK+1, OMIT_OLDEST_BARS+1));
   PlotIndexSetInteger(1, PLOT_ARROW, 234);
   //initialize myPoint
   myPoint = Point();
   if(Digits() == 5 || Digits() == 3)
     {
      myPoint *= 10;
     }
   MA_handle = iMA(NULL, PERIOD_CURRENT, EMA_Period, 0, MODE_SMA, PRICE_CLOSE);
   if(MA_handle < 0)
     {
      Print("The creation of iMA has failed: MA_handle=", INVALID_HANDLE);
      Print("Runtime error = ", GetLastError());
      return(INIT_FAILED);
     }

   return(INIT_SUCCEEDED);
  }

//+------------------------------------------------------------------+
//| Custom indicator iteration function                              |
//+------------------------------------------------------------------+
int OnCalculate(const int rates_total,
                const int prev_calculated,
                const datetime& time[],
                const double& open[],
                const double& high[],
                const double& low[],
                const double& close[],
                const long& tick_volume[],
                const long& volume[],
                const int& spread[])
  {
   int limit = rates_total - prev_calculated;
   //--- counting from 0 to rates_total
   ArraySetAsSeries(Buffer1, true);
   ArraySetAsSeries(Buffer2, true);
   //--- initial zero
   if(prev_calculated < 1)
     {
      ArrayInitialize(Buffer1, EMPTY_VALUE);
      ArrayInitialize(Buffer2, EMPTY_VALUE);
     }
   else
      limit++;
   datetime Time[];

   if(CopyLow(Symbol(), PERIOD_CURRENT, 0, rates_total, Low) <= 0) return(rates_total);
   ArraySetAsSeries(Low, true);
   if(BarsCalculated(MA_handle) <= 0)
      return(0);
   if(CopyBuffer(MA_handle, 0, 0, rates_total, MA) <= 0) return(rates_total);
   ArraySetAsSeries(MA, true);
   if(CopyHigh(Symbol(), PERIOD_CURRENT, 0, rates_total, High) <= 0) return(rates_total);
   ArraySetAsSeries(High, true);
   if(CopyTime(Symbol(), Period(), 0, rates_total, Time) <= 0) return(rates_total);
   ArraySetAsSeries(Time, true);
   //--- main loop
   for(int i = limit-1; i >= 0; i--)
     {
      if (i >= MathMin(PLOT_MAXIMUM_BARS_BACK-1, rates_total-1-OMIT_OLDEST_BARS)) continue; //omit some old rates to prevent "Array out of range" or slow calculation

      //Indicator Buffer 1
      if(Low[i] < MA[i]
      && Low[i+1] > MA[i+1] //Candlestick Low crosses below Moving Average
      )
        {
         Buffer1[i] = Low[i]; //Set indicator value at Candlestick Low
         if(i == 1 && Time[1] != time_alert) myAlert("indicator", "Look for EMA 100 bounce "); //Alert on next bar open
         time_alert = Time[1];
        }
      else
        {
         Buffer1[i] = EMPTY_VALUE;
        }
      //Indicator Buffer 2
      if(High[i] > MA[i]
      && High[i+1] < MA[i+1] //Candlestick High crosses above Moving Average
      )
        {
         Buffer2[i] = High[i]; //Set indicator value at Candlestick High
         if(i == 1 && Time[1] != time_alert) myAlert("indicator", "Look for EMA 100 bounce "); //Alert on next bar open
         time_alert = Time[1];
        }
      else
        {
         Buffer2[i] = EMPTY_VALUE;
        }
     }
   return(rates_total);
  }
//+------------------------------------------------------------------+
Step 3: EA development
In this section, we will guide you through the development of a simple yet effective Swing Entry Monitoring Expert Advisor (EA) using MQL5. This EA is designed to monitor market prices, with a particular focus on Bitcoin as an example, and to send alerts based on predefined conditions.
To streamline this process, we will omit metadata details, as these were thoroughly explained during the indicator development phase. Let’s break down the code step-by-step, ensuring each part is easy to understand and implement.
1. Input Parameters:
input string IndicatorName = "ema100_monitoring_indicator"; // Name of the custom indicator
input bool EnableTerminalAlerts = true;
input bool EnablePushNotifications = true;
input bool EnableTelegramAlerts = false;
input string TelegramBotToken = "YOUR_BOT_TOKEN"; // Replace with your bot token
input string TelegramChatID = "YOUR_CHAT_ID";     // Replace with your chat ID
In this part, we define various customizable input parameters that enhance the EA's flexibility and usability. The IndicatorName parameter allows us to specify the name of the custom indicator we wish to monitor, defaulting to "Bitcoin Monitor." The boolean flags—EnableTerminalAlerts, EnablePushNotifications, and EnableTelegramAlerts—allow us to tailor our alert preferences. For instance, we can choose to receive notifications directly in the trading terminal, on our mobile devices, or via Telegram. Additionally, we must input our Telegram bot token and chat ID to enable Telegram alerts. This customization empowers other users to optimize their trading experience according to their preferences and needs.
2. Indicator Handles:
int indicatorHandle = INVALID_HANDLE;
int emaHandle = INVALID_HANDLE;
This section declares the necessary variables to manage the indicators used in the EA. The indicatorHandle and emaHandle variables will store references to the custom indicator and the Exponential Moving Average (EMA), respectively. Both handles are initialized to INVALID_HANDLE, indicating that they are not yet assigned. This setup is crucial for the EA’s functionality, as it allows the program to interface with the specified indicators and retrieve relevant market data for analysis.
3. Alert Function:
void AlertMessage(string message) {
   if (EnableTerminalAlerts) Alert(message);
   if (EnablePushNotifications) SendNotification(message);
   if (EnableTelegramAlerts) SendTelegramMessage(message);
}
The AlertMessage function plays a vital role in managing alert notifications within the EA. This function takes a string parameter, message, which contains the text of the alert to be sent. It checks the user’s preferences for alert types—terminal alerts, push notifications, and Telegram messages—and sends the message accordingly. By centralizing alert management in this function, the code becomes more organized and easier to maintain. This functionality is particularly important for traders who rely on timely notifications to make informed decisions based on market movements.
4. Telegram Alerting:
void SendTelegramMessage(string message) {
   if (EnableTelegramAlerts) {
      string url = "https://api.telegram.org/bot" + TelegramBotToken + "/sendMessage?chat_id=" + TelegramChatID + "&text=" + message;
      int timeout = 5000;
      ResetLastError();

      char postData[];
      uchar result[];
      string response;

      int res = WebRequest("GET", url, NULL, timeout, postData, result, response);

      if (res != 200) {
         Print("Telegram WebRequest failed. Error: ", GetLastError(), ", HTTP Code: ", res);
      } else {
         Print("Telegram message sent successfully: ", response);
      }
   }
}
To facilitate communication with users, the SendTelegramMessage function is implemented. This function constructs a URL that utilizes the Telegram API to send messages to a specified chat. It first checks if Telegram alerts are enabled. If they are, the function prepares and sends a GET request to the Telegram server with the constructed URL, including the bot token and chat ID. The function also handles potential errors during the request, providing feedback to the user if the message fails to send. This feature allows users to receive alerts directly on Telegram, enhancing accessibility and convenience.
5. Initialization Function:
int OnInit() {
   Print("Bitcoin Monitoring EA started.");

   // Attach the custom indicator to the chart
   indicatorHandle = iCustom(_Symbol, _Period, IndicatorName);
   if (indicatorHandle == INVALID_HANDLE) {
      Print("Failed to attach indicator: ", IndicatorName, ". Error: ", GetLastError());
      return(INIT_FAILED);
   }

   // Attach built-in EMA 100 to the chart
   emaHandle = iMA(_Symbol, _Period, 100, 0, MODE_EMA, PRICE_CLOSE);
   if (emaHandle == INVALID_HANDLE) {
      Print("Failed to create EMA 100. Error: ", GetLastError());
      return(INIT_FAILED);
   }

   // Add EMA 100 to the terminal chart
   if (!ChartIndicatorAdd(0, 0, emaHandle)) {
      Print("Failed to add EMA 100 to the chart. Error: ", GetLastError());
   }

   return(INIT_SUCCEEDED);
}
The OnInit function is executed when the EA is first loaded. It is responsible for setting up the necessary indicators and ensuring that the EA is ready for operation. Within this function, the custom indicator is attached to the chart using its name, and the handle is checked to confirm successful attachment. If the attachment fails, an error message is printed to help diagnose the issue. Additionally, the function creates an EMA with a period of 100 and verifies its successful creation before adding it to the chart. Proper initialization is crucial for the EA’s functionality, as it ensures that all components are correctly set up and ready to process market data.
6. Deinitialization Function:
void OnDeinit(const int reason) {
   Print(" EA stopped.");
   if (indicatorHandle != INVALID_HANDLE) {
      IndicatorRelease(indicatorHandle);
   }
   if (emaHandle != INVALID_HANDLE) {
      IndicatorRelease(emaHandle);
   }
}
The OnDeinit function is called when the EA is removed from the chart or when the terminal is closed. Its primary purpose is to clean up resources and prevent memory leaks. This function checks if the indicator handles are valid and, if so, releases them to free up system resources. The function also prints a message indicating that the EA has stopped, providing users with clear feedback about the EA's status. Proper deinitialization is essential for maintaining optimal performance and ensuring that the trading environment remains clutter-free.
7. Main Logic:
void OnTick() {
   static datetime lastAlertTime = 0; // Prevent repeated alerts for the same signal

   if (indicatorHandle == INVALID_HANDLE || emaHandle == INVALID_HANDLE) return;

   double buffer1[], buffer2[];
   ArraySetAsSeries(buffer1, true);
   ArraySetAsSeries(buffer2, true);

   // Read data from the custom indicator
   if (CopyBuffer(indicatorHandle, 0, 0, 1, buffer1) < 0) {
      Print("Failed to copy Buffer1. Error: ", GetLastError());
      return;
   }
   if (CopyBuffer(indicatorHandle, 1, 0, 1, buffer2) < 0) {
      Print("Failed to copy Buffer2. Error: ", GetLastError());
      return;
   }

   // Check for signals in Buffer1
   if (buffer1[0] != EMPTY_VALUE && TimeCurrent() != lastAlertTime) {
      string message = "Signal detected: Look for EMA 100 bounce (Low). Symbol: " + _Symbol;
      AlertMessage(message);
      lastAlertTime = TimeCurrent();
   }

   // Check for signals in Buffer2
   if (buffer2[0] != EMPTY_VALUE && TimeCurrent() != lastAlertTime) {
      string message = "Signal detected: Look for EMA 100 bounce (High). Symbol: " + _Symbol;
      AlertMessage(message);
      lastAlertTime = TimeCurrent();
   }

   // Debugging EMA 100 value
   double emaValueArray[];
   ArraySetAsSeries(emaValueArray, true); // Ensure it's set as series
   if (CopyBuffer(emaHandle, 0, 0, 1, emaValueArray) > 0) {
      Print("EMA 100 Current Value: ", emaValueArray[0]);
   } else {
      Print("Failed to read EMA 100 buffer. Error: ", GetLastError());
   }
}
The OnTick function contains the core logic of the EA, executing every time the market receives a new tick of data. This function checks the validity of the indicator handles before proceeding with its calculations. It initializes arrays to hold data from the custom indicator and retrieves the latest values from the indicator buffers. If a signal is detected in either buffer, the function triggers an alert through the AlertMessage function, notifying users of potential trading opportunities. Additionally, the function retrieves the current value of the EMA for debugging purposes, providing transparency about the EA's functioning. This real-time analysis allows the EA to respond quickly to market changes, making it a valuable tool for traders.
Altogether our EA code :
//+------------------------------------------------------------------+
//| Bitcoin Monitoring Expert Advisor                                |
//| Copyright 2024, Clemence Benjamin                                |
//| https://www.mql5.com/en/users/billionaire2024/seller            |
//+------------------------------------------------------------------+
#property copyright "Clemence Benjamin"
#property link      "https://www.mql5.com/en/users/billionaire2024/seller"
#property version   "1.0"
#property description "BTCUSD Monitoring Expert Advisor"

//--- Input parameters
input string IndicatorName = "ema100_monitoring_indicator"; // Name of the custom indicator
input bool EnableTerminalAlerts = true;
input bool EnablePushNotifications = true;
input bool EnableTelegramAlerts = false;
input string TelegramBotToken = "YOUR_BOT_TOKEN";         // Replace with your bot token
input string TelegramChatID = "YOUR_CHAT_ID";             // Replace with your chat ID

//--- Indicator handles
int indicatorHandle = INVALID_HANDLE;
int emaHandle = INVALID_HANDLE;

//--- Alert function
void AlertMessage(string message) {
   if (EnableTerminalAlerts) Alert(message);
   if (EnablePushNotifications) SendNotification(message);
   if (EnableTelegramAlerts) SendTelegramMessage(message);
}

//--- Telegram Alerting
void SendTelegramMessage(string message) {
   if (EnableTelegramAlerts) {
      string url = "https://api.telegram.org/bot" + TelegramBotToken + "/sendMessage?chat_id=" + TelegramChatID + "&text=" + message;
      int timeout = 5000;
      ResetLastError();

      char postData[];
      uchar result[];
      string response;

      int res = WebRequest("GET", url, NULL, timeout, postData, result, response);

      if (res != 200) {
         Print("Telegram WebRequest failed. Error: ", GetLastError(), ", HTTP Code: ", res);
      } else {
         Print("Telegram message sent successfully: ", response);
      }
   }
}

//+------------------------------------------------------------------+
//| Expert initialization function                                   |
//+------------------------------------------------------------------+
int OnInit() {
   Print("Bitcoin Monitoring EA started.");

   // Attach the custom indicator to the chart
   indicatorHandle = iCustom(_Symbol, _Period, IndicatorName);
   if (indicatorHandle == INVALID_HANDLE) {
      Print("Failed to attach indicator: ", IndicatorName, ". Error: ", GetLastError());
      return(INIT_FAILED);
   }

   // Attach built-in EMA 100 to the chart
   emaHandle = iMA(_Symbol, _Period, 100, 0, MODE_EMA, PRICE_CLOSE);
   if (emaHandle == INVALID_HANDLE) {
      Print("Failed to create EMA 100. Error: ", GetLastError());
      return(INIT_FAILED);
   }

   // Add EMA 100 to the terminal chart
   if (!ChartIndicatorAdd(0, 0, emaHandle)) {
      Print("Failed to add EMA 100 to the chart. Error: ", GetLastError());
   }

   return(INIT_SUCCEEDED);
}

//+------------------------------------------------------------------+
//| Expert deinitialization function                                 |
//+------------------------------------------------------------------+
void OnDeinit(const int reason) {
   Print("Bitcoin Monitoring EA stopped.");
   if (indicatorHandle != INVALID_HANDLE) {
      IndicatorRelease(indicatorHandle);
   }
   if (emaHandle != INVALID_HANDLE) {
      IndicatorRelease(emaHandle);
   }
}

void OnTick() {
   static datetime lastAlertTime = 0; // Prevent repeated alerts for the same signal

   if (indicatorHandle == INVALID_HANDLE || emaHandle == INVALID_HANDLE) return;

   double buffer1[], buffer2[];
   ArraySetAsSeries(buffer1, true);
   ArraySetAsSeries(buffer2, true);

   // Read data from the custom indicator
   if (CopyBuffer(indicatorHandle, 0, 0, 1, buffer1) < 0) {
      Print("Failed to copy Buffer1. Error: ", GetLastError());
      return;
   }
   if (CopyBuffer(indicatorHandle, 1, 0, 1, buffer2) < 0) {
      Print("Failed to copy Buffer2. Error: ", GetLastError());
      return;
   }

   // Check for signals in Buffer1
   if (buffer1[0] != EMPTY_VALUE && TimeCurrent() != lastAlertTime) {
      string message = "Signal detected: Look for EMA 100 bounce (Low). Symbol: " + _Symbol;
      AlertMessage(message);
      lastAlertTime = TimeCurrent();
   }

   // Check for signals in Buffer2
   if (buffer2[0] != EMPTY_VALUE && TimeCurrent() != lastAlertTime) {
      string message = "Signal detected: Look for EMA 100 bounce (High). Symbol: " + _Symbol;
      AlertMessage(message);
      lastAlertTime = TimeCurrent();
   }

   // Debugging EMA 100 value
   double emaValueArray[];
   ArraySetAsSeries(emaValueArray, true); // Ensure it's set as series
   if (CopyBuffer(emaHandle, 0, 0, 1, emaValueArray) > 0) {
      Print("EMA 100 Current Value: ", emaValueArray[0]);
   } else {
      Print("Failed to read EMA 100 buffer. Error: ", GetLastError());
   }
}
Testing and Optimization
After successfully compiling the code, we proceeded to test it using the Strategy Tester in the MetaTrader 5 terminal. Below are some images showcasing the testing process and results.
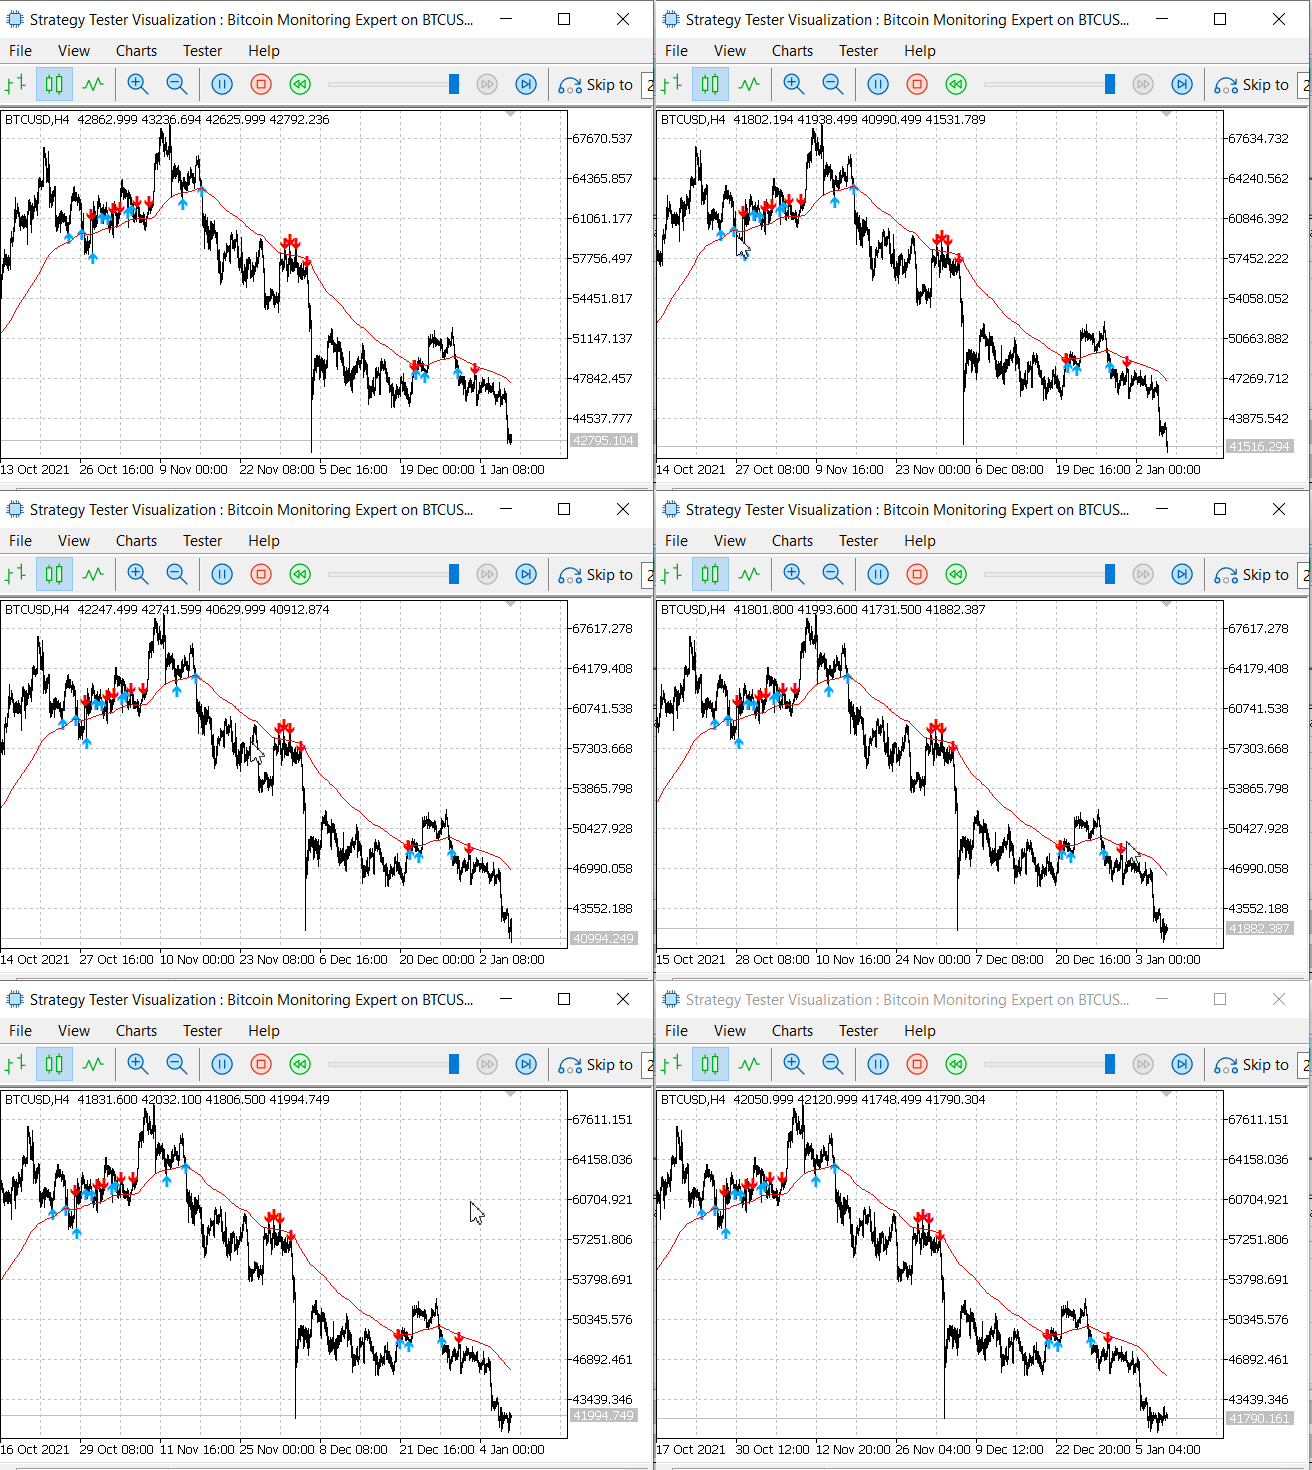
Bitcoin Monitoring Expert: Running on Strategy Tester
We successfully demonstrated the EA's real-time price monitoring capabilities during the Strategy Tester run. Below is an illustration showcasing the process and the EA's performance in action.
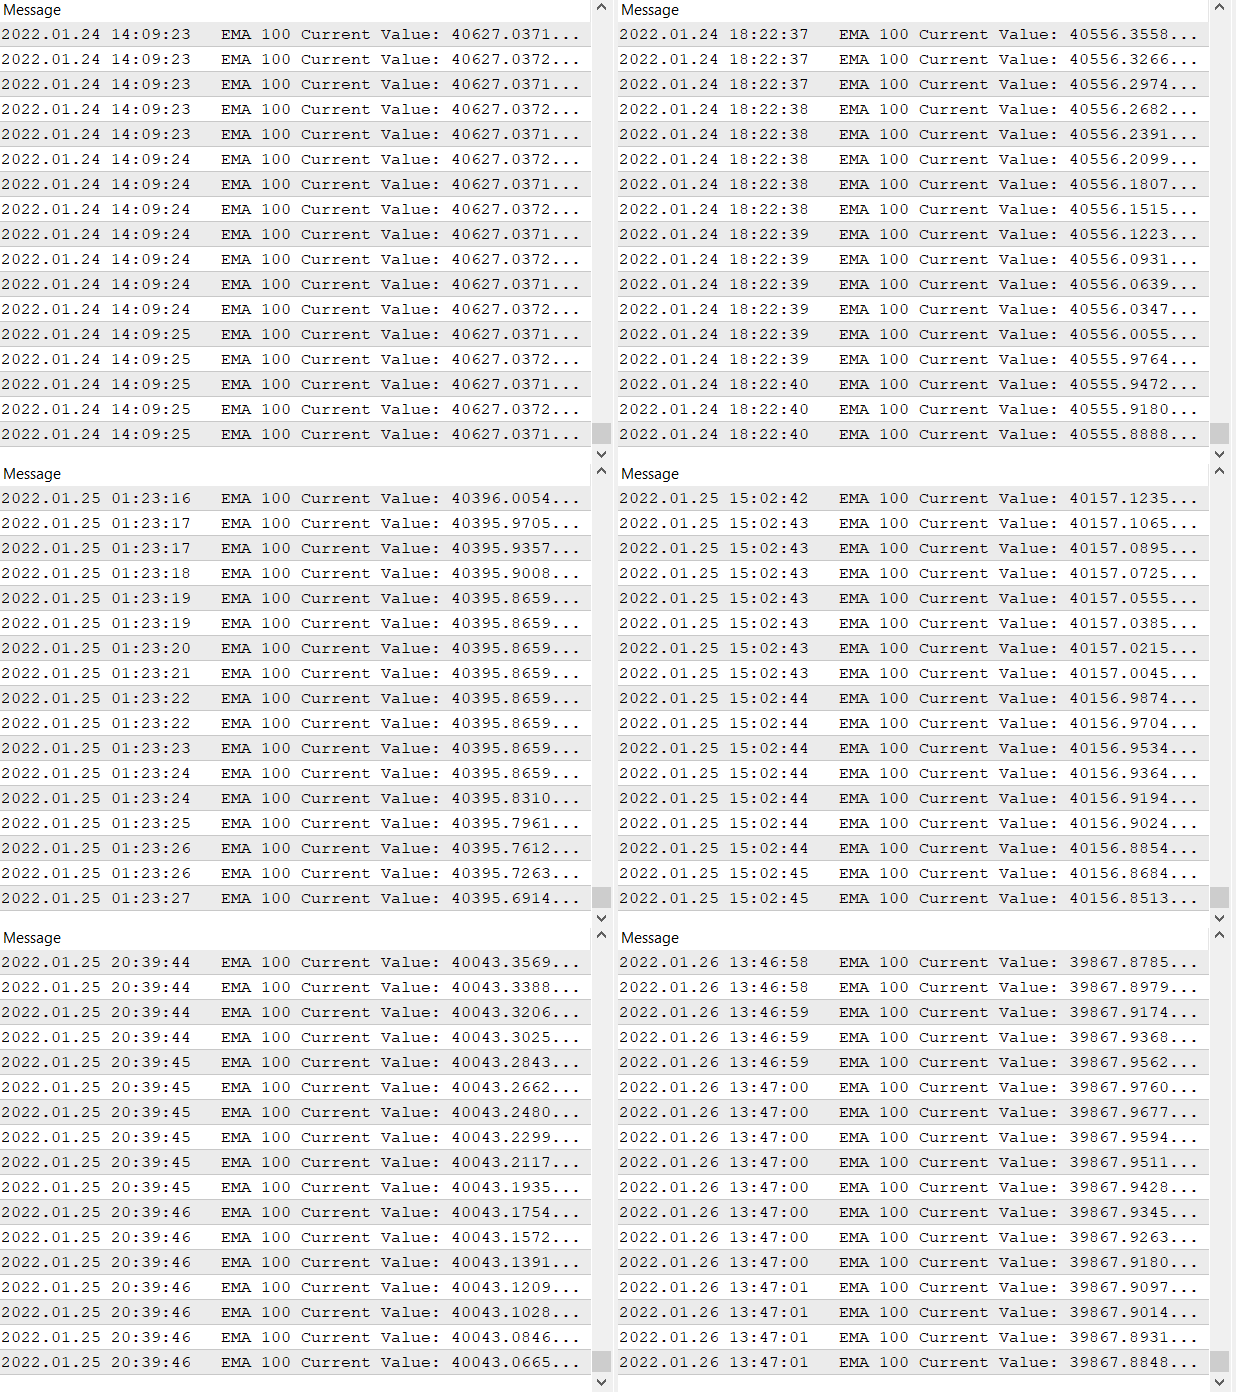
On Tick BTC Price Changes Monitored: Year 2022
Results and Analysis
We successfully visualized the indicator's performance by observing its interaction with the EMA 100 across higher timeframes, particularly H4 and D1. The system demonstrates its ability to send alerts in three distinct ways, including Telegram notifications. Price consistently respected the chosen EMA, as evidenced by the illustrations we’ve shared. The image below captures the launch of both the EA and the indicator on the MetaTrader 5 terminal, showcasing their integration and functionality.
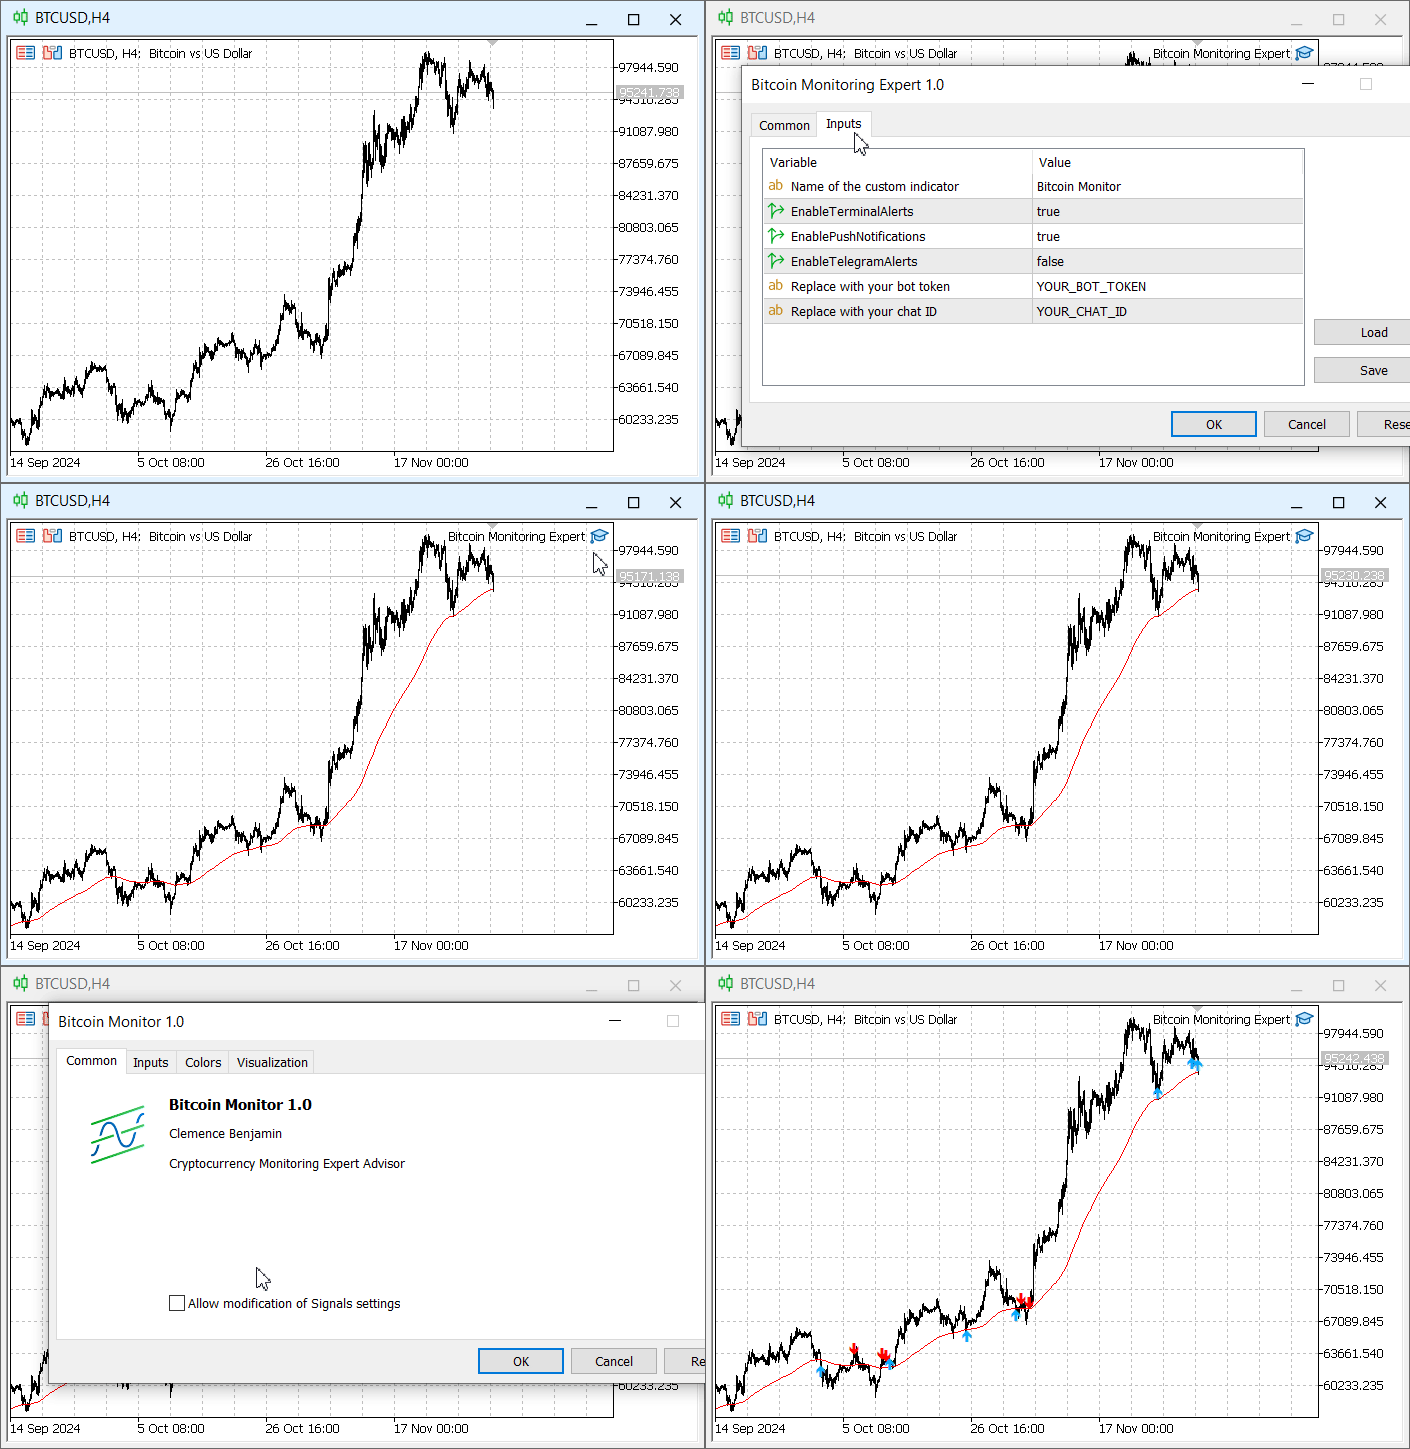
Adding the EA and Indicator to the chart
Conclusion
The Monitoring EA, we developed in this article, serves as a valuable tool for every trader. By automating price monitoring and integrating strategies like the EMA 100, it reduces the manual effort required to identify trading opportunities. While we developed it for BTCUSD, it can be extended to other instruments or customized for additional indicators. This project saved a motivational foundational simple for beginners to get started. The sky is the limit, so go ahead and try different approaches.
Download the attached EA and Indicator, back-test it with your preferred settings, and refine it to suit your trading strategy. Stay ahead in the dynamic world of trading by combining technical analysis with automation. Please note that this system is designed exclusively for monitoring and alerting purposes, with no trading features integrated at this stage. For about Telegram credentials, visit these article: Link 1 and Link 2
Table of attached files:
| Files | Description |
|---|---|
| ema100_monitoring_indicator.mq5 | Custom indicator based on EMA 100 bounce strategy |
| bitcoin_monitoring_expert.mq5 | Expert Advisor to enable Telegram alerting functionality via WebRequest and also monitors continuously. |
 Developing a Replay System (Part 55): Control Module
 Build Self Optimizing Expert Advisors in MQL5 (Part 3): Dynamic Trend Following and Mean Reversion Strategies
 Adaptive Social Behavior Optimization (ASBO): Schwefel, Box-Muller Method
 Neural Networks Made Easy (Part 97): Training Models With MSFformer
- Free trading apps
- Over 8,000 signals for copying
- Economic news for exploring financial markets
You agree to website policy and terms of use