
From Novice to Expert: Support and Resistance Strength Indicator (SRSI)
Contents
- Introduction
- Discussion Overview
- Evidence of today's market nature.
- Implementation of MQL5 to develop SRSI.
- Testing and Results
- Conclusion
- Attachment (SRSI source file)
Introduction
Markets consistently respect past price levels that have influenced their movements. A typical trader’s day often begins with manually drawing these key levels using the well-known line tool in MetaTrader 5. However, this manual process can lead to missed prominent levels or misjudged significance, highlighting the need for an automated solution.
One might ask why automation is necessary. While humans excel in complex, creative tasks and adapting to new situations, we often struggle with consistency and handling large volumes of data. Research by Mark Angelo D. Julian, Danilo B. Villarino, and Kristine T. Soberano in their July 7, 2024, paper, "The Human Brain Versus Computer: Which is Smarter?" underscores this point. Their study reveals that although humans excel at understanding context, computers are far superior in processing speed, data accuracy, and performing repetitive calculations. This contrast drives our ongoing development of algorithms for trading and data analysis.
Discussion Overview
Today, we will apply problem-solving techniques using MQL5 programming to tackle the aforementioned challenge. This discussion is designed for traders of all skill levels, from novices to experts, as we address key concepts that impact everyone. As you know, MetaTrader 5 is essentially a vast repository of price data, analytical tools, and historical information. Candlestick series, for example, are calculated bars representing open, high, low, and close prices, and popular indicators like Moving Averages are derived from these values. Imagine manually reviewing 5,000 candlesticks—this process is not only tedious but also prone to error. That’s why automating the identification of support and resistance levels is so beneficial.
While there are already several tools available in the market—both free and paid—today we are exploring a unique approach. This session is not just about the final product; it’s also about sharing the MQL5 programming skills you need to build your own custom solution. Below is an outline of the advantages of the Support and Resistance Strength Indicator (SRSI) we’re developing:
- Efficient Data Processing: Analyzes extensive historical candlestick data to pinpoint key levels.
- Continuous Automation: Operates automatically and continuously, reducing manual errors.
- Level Differentiation: Identifies both weak and strong support and resistance levels.
- Clear Visuals: Provides a clear, visual representation of these critical levels.
- Comprehensive Notifications: Offers user notifications via Terminal, and push notifications.
In the following sections, we will begin by gathering historical price data using MetaTrader 5 charts and manually identified support and resistance levels. This initial analysis will provide evidence comparing current market behavior with past performance. Next, we will dive into the development process, where I will share and break down the code for our custom indicator—explaining every line in detail to ensure you fully understand how to implement MQL5 and translate your ideas into code.
Finally, we will review the testing process and present our results, leaving you with both enhanced programming skills and a working solution. Take your time, follow along, and enjoy the coding journey.
Evidence of today's market nature
My MetaTrader 5 platform is connected to Deriv.com brokerage, providing me with access to a wide range of trading pairs. Depending on the account type, I can trade volatility pairs, forex pairs, stock pairs, and more. The image provided shows a vast selection of additional pairs available for trading. For this research, I chose several pairs from this collection to analyze.
To view the pairs offered by your broker and add them to your Market Watch list, simply press CTRL + U on your keyboard or click the red, rounded icon (as shown in the image below) to open the Symbols window. Then, double-click the desired pair to add it automatically to your list.
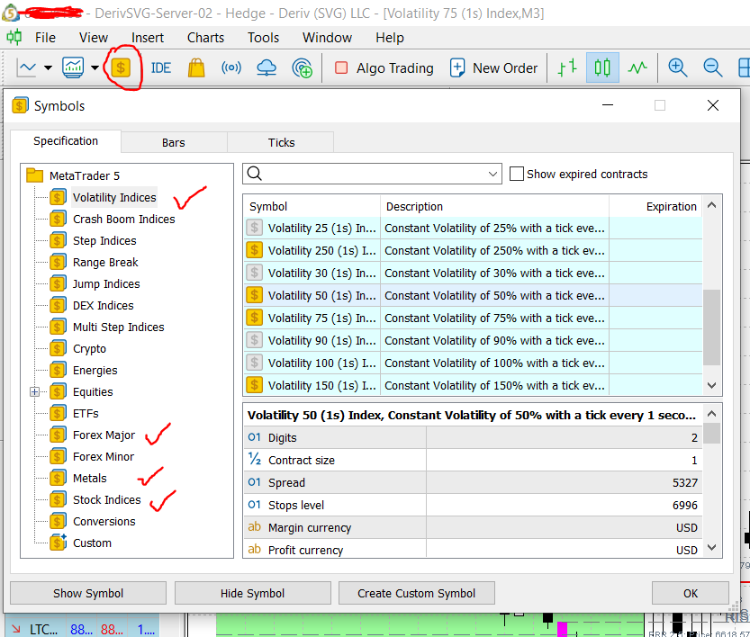
DerivSVG MetaTrader 5 Symbols
Synthetic Pairs
I began my analysis with a synthetic pair under Volatility Indices—Volatility 75 (1s) Index—on the weekly timeframe. When this pair was introduced around 2020, it was initially expensive but soon experienced a prolonged crash, forming a strong downtrend for weeks. Traders who shorted the pair during that period likely made significant profits. However, my primary focus is on market structure, particularly over the past three years.
The sustained downtrend likely conditioned traders to adopt a trend-following mindset, expecting further declines. However, as shown in the image below, the market dynamics have shifted. The higher timeframe now exhibits a choppy ranging structure, with similar characteristics observed in lower timeframes. Such conditions make it difficult for swing traders to navigate effectively.
In these circumstances, price action based on support and resistance becomes crucial for identifying key trading opportunities. The image below illustrates this market behavior, reinforcing the importance of a structured approach to technical analysis.
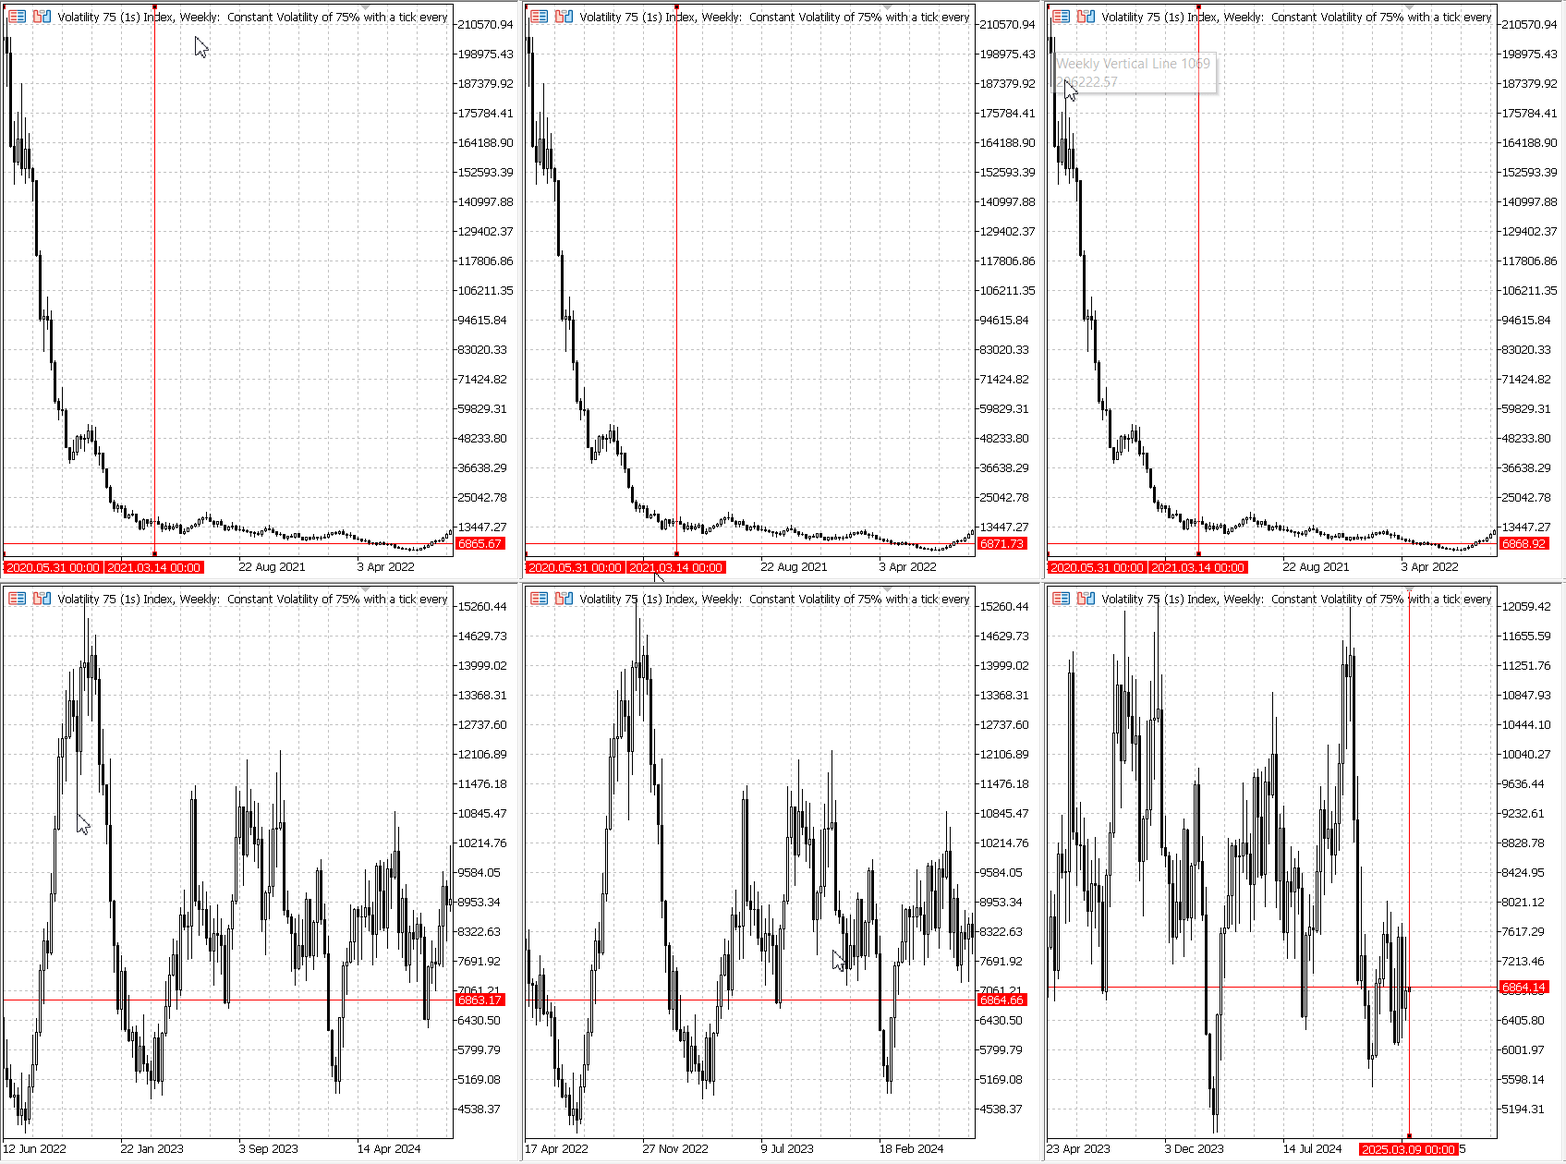
Volatility 75 (1s) Index
Stocks Pair
I analyzed the US Tech weekly chart, and it is evident that the market has been trending upwards, with periodic corrections along the way. These corrections often lead to consolidation phases, where price movement slows before resuming the trend. In an uptrending market, corrections typically establish strong support zones, reinforcing the bullish momentum.
At this higher timeframe, it is difficult to identify the precise patterns that influence price action on lower timeframes. However, as we delve deeper, we will see how the concept of support and resistance remains applicable across different timeframes, allowing us to observe various market patterns in more detail.
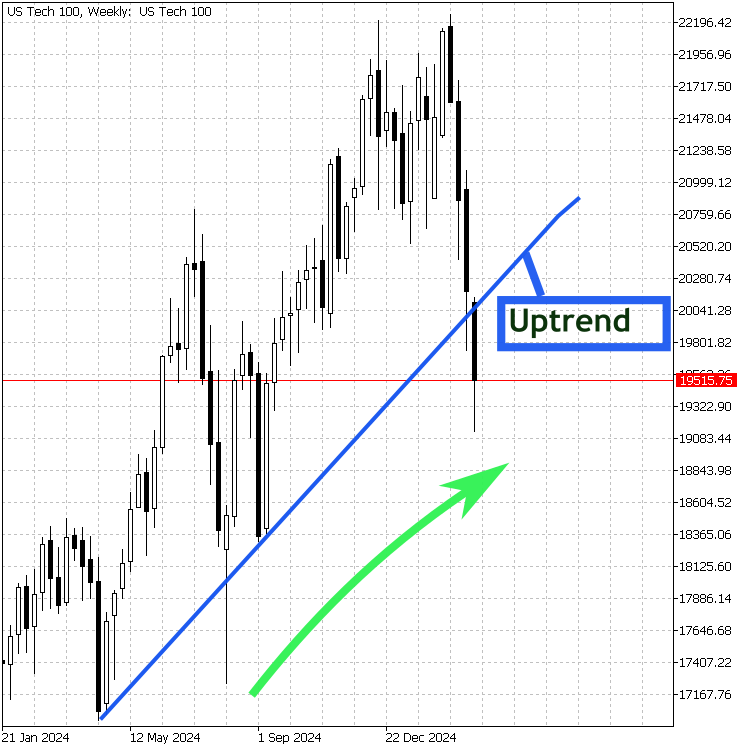
US Tech 100Weekly
Forex Pair
The EUR/USD weekly chart reveals a small phase of impulse followed by a prolonged period of fluctuations. This behavior is evident on the higher timeframe and extends to lower timeframes as well. The key takeaway here is the extended range-bound price action, highlighting how the market spends significant time consolidating rather than trending. The image below serves as proof of this prolonged market behavior within a defined range.
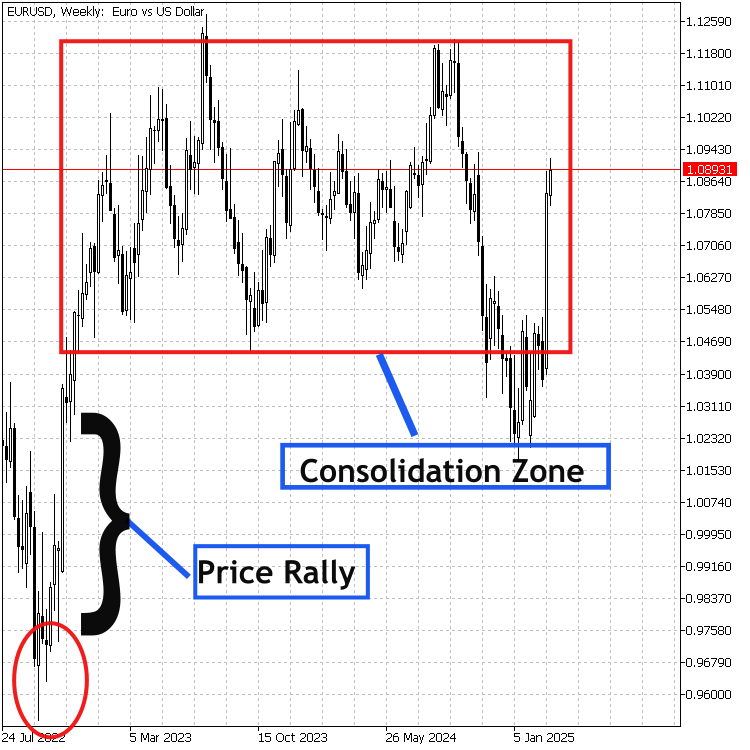
EURUSDWeekly
In conclusion, from the above exercise, it is clear that while market prices experience rising or falling trends, they strongly rely on prior price levels for testing and validation. During consolidation phases, these horizontal levels, based on the chosen timeframe, become key areas where price tends to react.
However, not every level is strong enough to trigger a significant price movement. Additionally, even well-established support or resistance levels do not guarantee a price reaction, but they do offer a higher probability of influencing market behavior if proven to be strong.
In the next section, we will briefly review the fundamentals of support and resistance before diving into the algorithm development.
Implementation of MQL5 to develop SRSI
Defining Support and Resistance
Support is generally defined as a zone of demand where multiple price levels converge, indicating that buyers are inclined to step in and push the price higher. This area represents a "floor" for the market, where the accumulation of buying interest tends to prevent further declines.
- In practical terms, support is not usually a single price point but a zone where previous lows or multiple touchpoints have established buyer confidence.
Conversely, Resistance is a zone of supply where multiple price levels converge, suggesting that sellers are likely to intervene and drive the price down. This area acts as a "ceiling" for the market, where selling pressure overcomes buying pressure, often preventing the price from rising further. Like support, resistance is typically observed as a range rather than a precise level, due to the presence of multiple highs or touchpoints that reinforce the selling interest.
With this understanding in mind, working with support and resistance becomes much simpler. In the video below, I'll walk you through my routine to show you how I typically draw these lines.
Algorithm design and Implementation
We need the program to replicate how I manually identify and mark Support and Resistance zones. After reviewing the video, I’ve summarized the key steps here:
- Identify Extreme Turning Points: These are significant highs (for resistance) or lows (for support) where the price reverses direction.
- Find Other Testing Points: Look for additional price levels where the price equals or comes within 5 pips of the extreme turning point, confirming its significance.
- Form Bounce Zones: Create rectangular zones that encompass the extreme turning points and their testing points, with the zone extending around these touches.
- Customize Zone Dimensions:
- Height: The vertical size of the zone rectangle (in pips) should be adjustable.
- Width: The horizontal size of the zone (in candlestick bars to the right) should be adjustable.
Generally, we will configure our program to scan a customizable number of candles, identifying conditions that meet our criteria and drawing the appropriate shapes, lines, and labels. We will also provide input options to control various features of the program. For alerts, we will implement push notifications and terminal alerts, delivering them periodically within a customizable 4-hour interval. Unlike other indicators, support and resistance levels do not require constant monitoring, so this approach ensures timely notifications without excessive alerts. Below, I explain the details step by step, along with code snippets.
When you open MetaEditor and choose to create a new custom indicator, it gives you a basic template to work with. This template is like a blank canvas that helps developers get started, and it’s where we’ll build our SRSI indicator. Here’s what it looks like:
//+------------------------------------------------------------------+
//|                                                        _SRSI.mq5 |
//|                                   Copyright 2025, Metaquotes Ltd |
//|                                            https://www.mql5.com/ |
//+------------------------------------------------------------------+
#property copyright "Copyright 2025, Metaquotes Ltd"
#property link      "https://www.mql5.com/"
#property version   "1.00"
#property indicator_chart_window
//+------------------------------------------------------------------+
//| Custom indicator initialization function                         |
//+------------------------------------------------------------------+
int OnInit()
  {
//--- indicator buffers mapping

//---
   return(INIT_SUCCEEDED);
  }
//+------------------------------------------------------------------+
//| Custom indicator iteration function                              |
//+------------------------------------------------------------------+
int OnCalculate(const int rates_total,
                const int prev_calculated,
                const datetime &time[],
                const double &open[],
                const double &high[],
                const double &low[],
                const double &close[],
                const long &tick_volume[],
                const long &volume[],
                const int &spread[])
  {
//---

//--- return value of prev_calculated for next call
   return(rates_total);
  }
//+------------------------------------------------------------------+
We will use this as a foundational guide, ensuring that all key functions are properly implemented. In the subsequent steps, we will complete the template, integrate new features, and provide detailed explanations of their functionalities. Please follow along until the end for a comprehensive understanding.
Step 1: Customizing Indicator Properties
To start, we customize the indicator’s properties to personalize it and meet MetaTrader 5 requirements. We update the copyright and link details to reflect our own information. We add a setting for stricter error checking to catch mistakes during development. The indicator is set to display on the main chart window. Since MetaTrader 5 requires at least one buffer, we define a single hidden "dummy" buffer, as our indicator will use custom objects (lines and rectangles) rather than plotted buffer data.
#property copyright "Clemence Benjamin"
#property link      "https://www.mql5.com/en/users/billionaire2024/seller"
#property version   "1.00"
#property strict          // Enforces stricter error checking
#property indicator_chart_window
#property indicator_buffers 1  // MT5 requires at least one buffer
#property indicator_plots 1    // Ties to the buffer (even if unused for plotting)
Step 2: Adding User Inputs
Next, we add user-configurable inputs to make the indicator adaptable. We include an option to set how many past bars the indicator analyzes, a price range (e.g., default 7 pips) for detecting level tests, a minimum number of tests needed for a level to be considered strong, and a toggle to show or hide rectangular zones around strong levels. These inputs allow users to tweak the indicator’s behavior without altering the code.
input int InpLookBack = 1000;        // Number of bars to analyze
input double InpTestProximity = 0.0007; // Price range for tests (e.g., 7 pips)
input int InpMinTests = 3;           // Minimum tests for strong levels
input bool InpShowRectangles = true; // Show zones as rectangles
Step 3: Creating a Dummy Buffer
MetaTrader 5 mandates that every indicator has at least one buffer, even if it’s not displayed. We create a global array to act as this dummy buffer. During initialization, we bind it to a buffer slot and hide it from the chart. This fulfills MetaTrader 5 requirement while letting us focus on drawing custom support and resistance levels.
double DummyBuffer[]; Using it:
int OnInit()
{
   SetIndexBuffer(0, DummyBuffer, INDICATOR_DATA);   // Bind buffer to index 0
   PlotIndexSetInteger(0, PLOT_DRAW_TYPE, DRAW_NONE); // Hide it from the chart
   return(INIT_SUCCEEDED);
}
Step 4: Defining Data Structures
To keep our data organized, we use enums and structs. We define an enum to categorize levels (e.g., strong support, weak resistance) for clarity. A struct for price levels stores each level’s price, test count, type, and identification time. Another struct defines zones around strong levels, holding their top and bottom prices and time range. We also set up global arrays to store strong levels, weak levels, and zones, plus a variable to track the last alert time.
enum ENUM_LEVEL_TYPE {
   LEVEL_STRONG_SUPPORT,      // Strong support level
   LEVEL_STRONG_RESISTANCE,   // Strong resistance level
   LEVEL_WEAK_SUPPORT,        // Weak support level
   LEVEL_WEAK_RESISTANCE      // Weak resistance level
};

struct PriceLevel {
   double price;           // Price value of the level
   int test_count;         // Number of times price tested it
   ENUM_LEVEL_TYPE type;   // Strong or weak, support or resistance
   datetime time;          // Time the level was identified
};

struct Zone {
   double top;             // Top price of the zone
   double bottom;          // Bottom price of the zone
   datetime start_time;    // When the zone starts
   datetime end_time;      // When the zone ends (current time)
};

PriceLevel StrongLevels[];    // Array for strong levels
PriceLevel WeakLevels[];      // Array for weak levels
Zone Zones[];                 // Array for strong level zones
datetime LastAlertTime = 0;   // Tracks the last alert time
Step 5: Detecting Swing Points
Support and resistance levels often form at swing highs and lows. We create a function to identify swing highs by checking if a bar’s high exceeds the highs of the 5 bars before and after it, marking a peak. Similarly, a function for swing lows checks if a bar’s low is below the lows of the surrounding 5 bars, indicating a trough. Using a 5-bar window on each side ensures these points are significant.
bool IsSwingHigh(int index, const double &high[])
{
   int window = 5;  // Check 5 bars on each side
   for (int i = 1; i <= window; i++) {
      if (index - i < 0 || index + i >= ArraySize(high)) return false; // Out of bounds
      if (high[index] <= high[index - i] || high[index] <= high[index + i]) return false; // Not a peak
   }
   return true;
}

bool IsSwingLow(int index, const double &low[])
{
   int window = 5;  // Check 5 bars on each side
   for (int i = 1; i <= window; i++) {
      if (index - i < 0 || index + i >= ArraySize(low)) return false; // Out of bounds
      if (low[index] >= low[index - i] || low[index] >= low[index + i]) return false; // Not a trough
   }
   return true;
}
Step 6: Counting Price Tests
A level’s strength depends on how often price tests it. We add a function to count these tests by examining bars after a swing point. It checks if each bar’s high or low falls within the defined price range of the level, incrementing a counter for each test. The total test count determines if the level is strong or weak based on the user’s minimum threshold.
int CountLevelTests(double price, int start_index, const double &high[], const double &low[])
{
   int tests = 0;
   for (int i = start_index + 1; i < ArraySize(high); i++) {
      if (MathAbs(high[i] - price) <= InpTestProximity || MathAbs(low[i] - price) <= InpTestProximity) {
         tests++;
      }
   }
   return tests;
}
Step 7: Processing Levels
We process each swing point into a level using a dedicated function. It records the price, test count, time, and type (strong/weak, support/resistance) based on whether it’s a swing high or low and meets the test threshold. For strong levels, it also defines a zone with a price range around the level. The level is then stored in the appropriate array (strong or weak) for later use.
void ProcessLevel(int index, double price, bool is_high, const double &high[], const double &low[], const datetime &time[])
{
   PriceLevel level;
   level.price = price;
   level.test_count = CountLevelTests(price, index, high, low);
   level.time = time[index];

   if (is_high) {
      level.type = (level.test_count >= InpMinTests) ? LEVEL_STRONG_RESISTANCE : LEVEL_WEAK_RESISTANCE;
   } else {
      level.type = (level.test_count >= InpMinTests) ? LEVEL_STRONG_SUPPORT : LEVEL_WEAK_SUPPORT;
   }

   if (level.test_count >= InpMinTests) {
      ArrayResize(StrongLevels, ArraySize(StrongLevels) + 1);
      StrongLevels[ArraySize(StrongLevels) - 1] = level;
      Zone zone;
      zone.start_time = time[index];
      zone.end_time = TimeCurrent();
      zone.top = price + InpTestProximity;
      zone.bottom = price - InpTestProximity;
      ArrayResize(Zones, ArraySize(Zones) + 1);
      Zones[ArraySize(Zones) - 1] = zone;
   } else {
      ArrayResize(WeakLevels, ArraySize(WeakLevels) + 1);
      WeakLevels[ArraySize(WeakLevels) - 1] = level;
   }
}
Step 8: Drawing on the Chart
To display the levels, we use two rendering functions. One draws strong levels with a gray rectangle (if enabled) for the zone and a solid line—blue for support, red for resistance—plus a label ("SS" or "SR"). The other draws weak levels with a dashed line—light blue for support, pink for resistance—and a label ("WS" or "WR"). Each object gets a unique name based on it's time to ensure proper management on the chart.
void RenderZone(const Zone &zone, const PriceLevel &level)
{
   string name = "Zone_" + TimeToString(zone.start_time);
   if (InpShowRectangles) {
      ObjectCreate(0, name, OBJ_RECTANGLE, 0, zone.start_time, zone.top, zone.end_time, zone.bottom);
      ObjectSetInteger(0, name, OBJPROP_COLOR, clrLightGray);
      ObjectSetInteger(0, name, OBJPROP_FILL, true);
   }

   string line_name = "Line_" + TimeToString(level.time);
   ObjectCreate(0, line_name, OBJ_HLINE, 0, 0, level.price);
   ObjectSetInteger(0, line_name, OBJPROP_COLOR, (level.type == LEVEL_STRONG_SUPPORT) ? clrBlue : clrRed);
   ObjectSetString(0, line_name, OBJPROP_TEXT, (level.type == LEVEL_STRONG_SUPPORT) ? "SS" : "SR");
}

void RenderWeakLine(const PriceLevel &level)
{
   string name = "WeakLine_" + TimeToString(level.time);
   ObjectCreate(0, name, OBJ_HLINE, 0, 0, level.price);
   ObjectSetInteger(0, name, OBJPROP_STYLE, STYLE_DASH);
   ObjectSetInteger(0, name, OBJPROP_COLOR, (level.type == LEVEL_WEAK_SUPPORT) ? clrLightBlue : clrPink);
   ObjectSetString(0, name, OBJPROP_TEXT, (level.type == LEVEL_WEAK_SUPPORT) ? "WS" : "WR");
}
Step 9: Sending Alerts
We include a function to send alerts about strong levels without spamming the user. It checks if an hour has passed since the last alert and if strong levels exist. If so, it creates a message with the latest strong level’s type, price, and the current price, then displays it. The alert time is updated to prevent frequent notifications.
void SendPeriodicAlert(double current_price)
{
   if (TimeCurrent() - LastAlertTime < 3600) return; // Wait 1 hour between alerts
   if (ArraySize(StrongLevels) == 0) return;         // No strong levels, no alert

   PriceLevel latest = StrongLevels[ArraySize(StrongLevels) - 1];
   string message = "SRZones Alert: Strong " +
                    ((latest.type == LEVEL_STRONG_SUPPORT) ? "Support" : "Resistance") +
                    " at " + DoubleToString(latest.price, 5) +
                    ", Current Price: " + DoubleToString(current_price, 5);
   Alert(message);
   LastAlertTime = TimeCurrent();
}
Step 10: Clearing Old Drawings
To keep the chart clean, we add a function to remove old objects. It deletes all previously drawn zones, strong level lines, and weak level lines using specific name prefixes. This runs before each full recalculation to refresh the display with current levels.
void ClearDisplayObjects()
{
   ObjectsDeleteAll(0, "Zone_");       // Delete all zones
   ObjectsDeleteAll(0, "Line_");       // Delete strong lines
   ObjectsDeleteAll(0, "WeakLine_");   // Delete weak lines
}
Step 11: Running the Logic in OnCalculate
Finally, we tie everything together in the main calculation function. On startup or when a new bar forms, it clears old objects and resets arrays. It determines a starting point based on the user-defined lookback period, ensuring enough data for swing detection. It loops through the bars, identifies swing highs and lows, processes them into levels, and stores them. Then, it renders all strong and weak levels and checks for alerts. The function returns the number of processed bars to MetaTrader 5.
int OnCalculate(const int rates_total,
                const int prev_calculated,
                const datetime &time[],
                const double &open[],
                const double &high[],
                const double &low[],
                const double &close[],
                const long &tick_volume[],
                const long &volume[],
                const int &spread[])
{
   if (prev_calculated == 0 || rates_total > prev_calculated) { // Full recalc on start or new bar
      ClearDisplayObjects();
      ArrayResize(StrongLevels, 0);
      ArrayResize(WeakLevels, 0);
      ArrayResize(Zones, 0);

      int start = MathMax(5, rates_total - InpLookBack); // Start within lookback period
      for (int i = start; i < rates_total - 5; i++) {    // Leave room for swing checks
         if (IsSwingHigh(i, high)) ProcessLevel(i, high[i], true, high, low, time);
         if (IsSwingLow(i, low)) ProcessLevel(i, low[i], false, high, low, time);
      }

      for (int i = 0; i < ArraySize(StrongLevels); i++) {
         RenderZone(Zones[i], StrongLevels[i]);
      }
      for (int i = 0; i < ArraySize(WeakLevels); i++) {
         RenderWeakLine(WeakLevels[i]);
      }

      SendPeriodicAlert(close[rates_total - 1]);
   }
   return(rates_total); // Tell MT5 how many bars were processed
}
After assembling all the pieces and resolving various issues, we successfully compiled our final product, which is attached at the end of this discussion. In the next section, we will share our testing experience and provide final thoughts in the conclusion.
Testing and Results
The first step involved launching the indicator and adding it to the chart with default settings, using EURUSD as the reference. Other currency pairs may require initial adjustments, particularly the pip value, for the indicator to display correctly. For example, when testing on the Volatility 75 (1s) index, no zones appeared until I adjusted the pip setting to 70.
Initially, as shown in the image below, the rectangle width was relatively small and required customization to increase its size, which we adjusted in the next image. All settings responded well, with noticeable changes on the chart. Additionally, all labels are clearly displayed, and you have the option to hide them as needed.
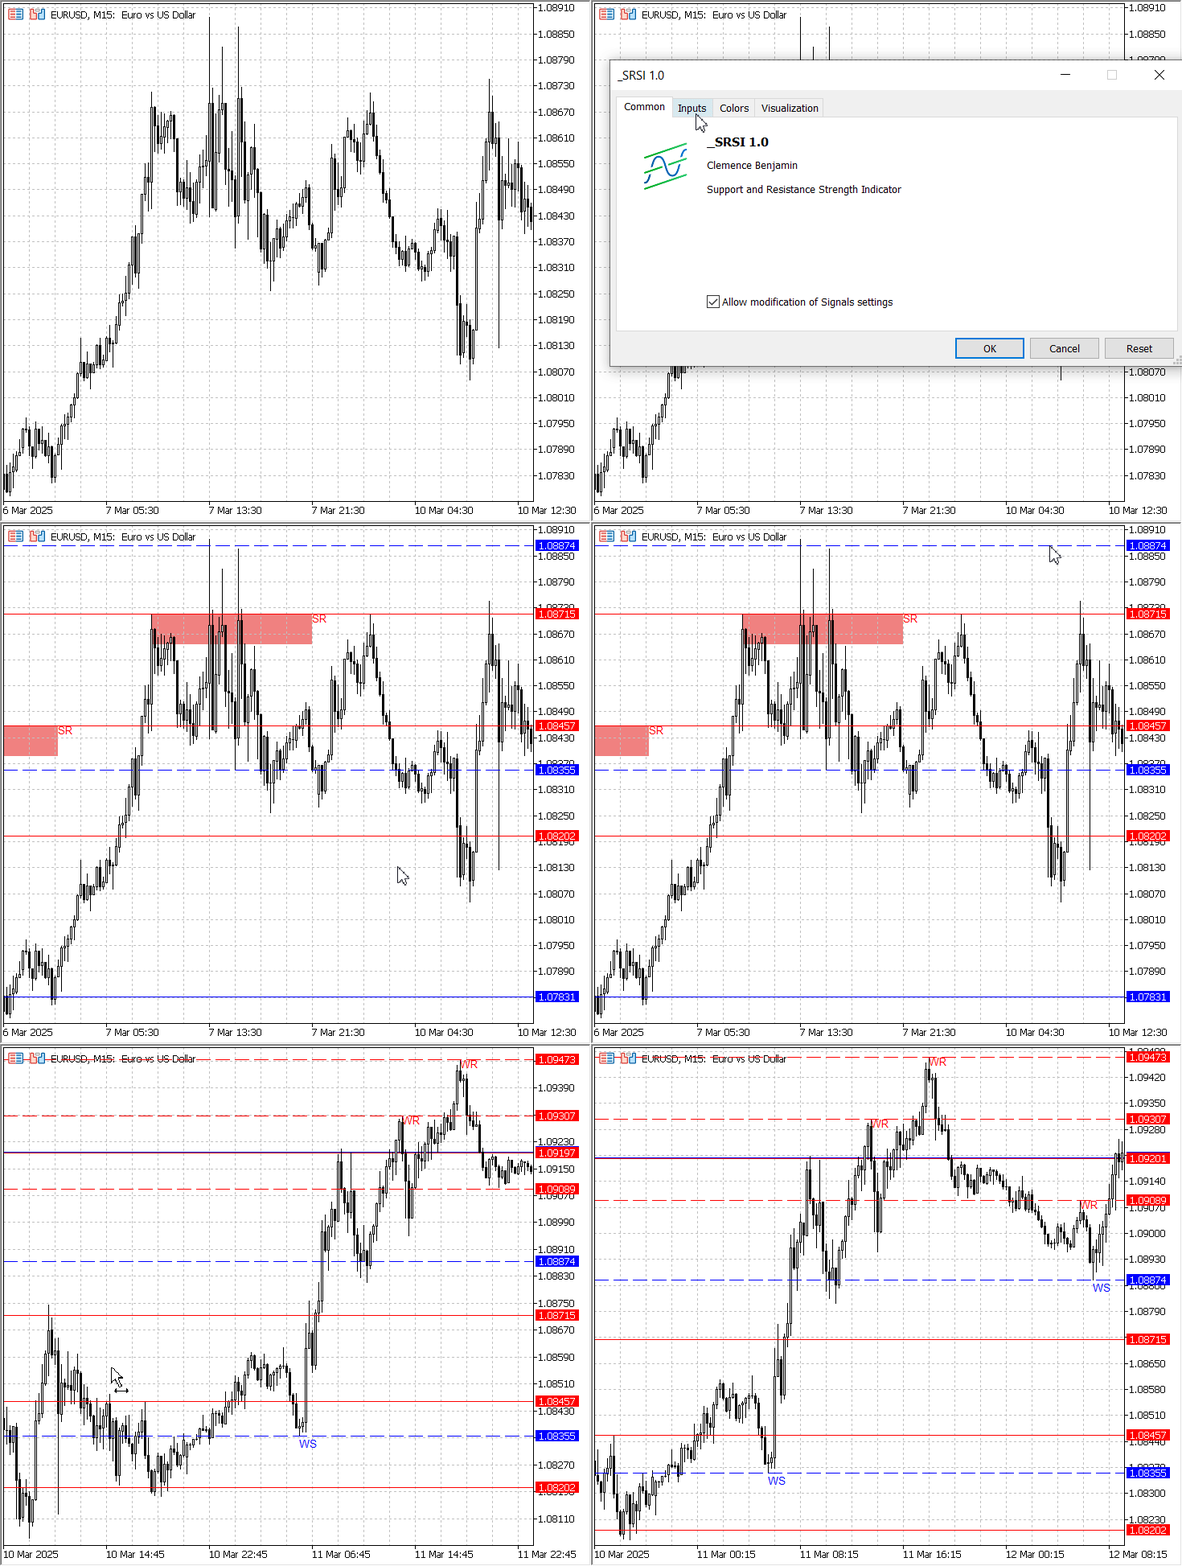
Adding Support and Resistance Strength Indicator (SRSI) to chart.
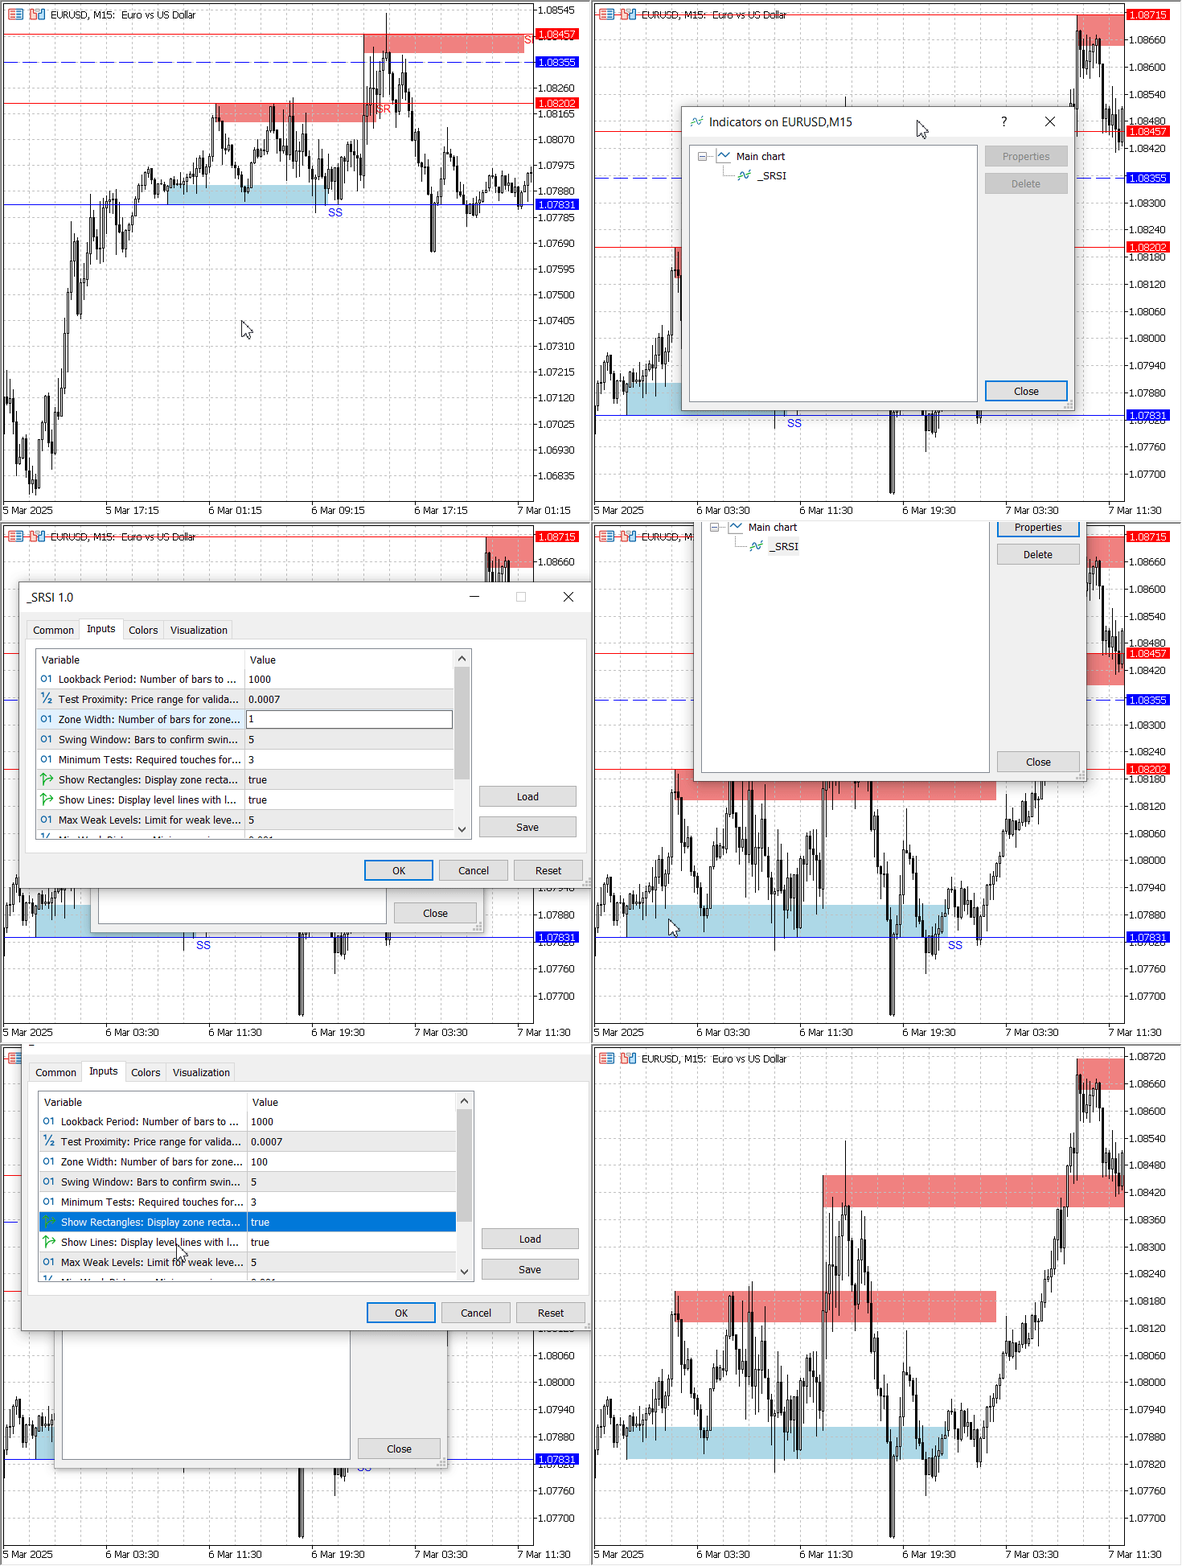
Customizing the settings for SRSI
Upon the initial launch, the indicator sends an alert displaying the prevailing support or resistance level along with the current price. This helps users anticipate potential supply and demand zones. Below is an expert log showing the alert details.
2025.03.10 07:44:42.548 _SRSI (EURUSD,M15)      Alert: Key Level: SR at 1.08715 | Current Price: 1.09021
2025.03.10 07:54:04.239 _SRSI (EURUSD,M15)      Alert: Key Level: SR at 1.08715 | Current Price: 1.09033
2025.03.10 07:55:04.965 _SRSI (EURUSD,M5)       Alert: Key Level: SR at 1.09013 | Current Price: 1.09044
2025.03.10 09:25:13.506 _SRSI (EURUSD,M5)       Alert: Key Level: SR at 1.09013 | Current Price: 1.09210
2025.03.10 11:26:46.761 _SRSI (EURUSD,M5)       Alert: Key Level: SR at 1.09013 | Current Price: 1.09192
Additionally, there is an option for push notifications in the settings, while terminal notifications are enabled by default. If an alert is triggered, the alert window will automatically appear on the terminal screen.
Terminal Alerts Window: SRSI indicator working
Conclusion
Our discussion goal has been successfully achieved with the development of an error-free indicator. From our tests, the design objectives were met, delivering the expected functionality. Now, I can effortlessly draw my support and resistance lines with just a few clicks, and the algorithm automatically screens them for reliability. As you may have noticed in the video, the manual process can be quite slow, but with the algorithm, these levels are calculated instantly with each tick. Throughout this process, we gathered valuable MQL5 insights for indicator development, and while the indicator’s performance can be assessed over time, there are various ways advanced developers can refine and expand upon it.
In this approach, we introduced structs as a means of writing more professional and organized code. However, there’s always room for improvement, and I believe you have your own ideas and suggestions for enhancing this tool. You are welcome to modify and experiment with it, and don’t hesitate to share your thoughts in the comments below.
I hope you found this discussion insightful. Until next time—happy coding and successful trading, fellow developers!
Attachment (SRSI source file)
| File | Description |
|---|---|
| _SRSI.mq5 | A Support and Resistance Strength Indicator that dynamically draws adjustable rectangular zones, clearly labeling strong support (SS) and strong resistance (SR). Additionally, it plots dashed lines to indicate weaker support (WS) and resistance (WR) levels for better visualization. |
 Resampling techniques for prediction and classification assessment in MQL5
 USD and EUR index charts — example of a MetaTrader 5 service
 Exploring Advanced Machine Learning Techniques on the Darvas Box Breakout Strategy
 A New Approach to Custom Criteria in Optimizations (Part 1): Examples of Activation Functions
- Free trading apps
- Over 8,000 signals for copying
- Economic news for exploring financial markets
You agree to website policy and terms of use
I really like your article and tried it on FX pairs which seem to work well... How about Indexes like US30? what are the setting would you recommend? i tried setting the text proximity to 0.035 and the results seems funny
Thank you!
Thank you!
Hello Friend
I am following your articles and they are informative. Thanks for sharing and spreading knowledge.
I have tried 21Period ATR multiple as below:
gTestProximity = (MathMax((75/_Digits),0.10*getATR(rates_total - 1))); // (n*getATR(index) replaced for ...InpTextProximity;
gMinDistance = (MathMax((150/_Digits),0.20*getATR(rates_total - 1))); // (n*getATR(index) replaced for ...InpMinWeakDistance;
This helped me getting SRZones for both EURUSD and XAUUSD pairs with quite difference in there values 1.08000 to 3000.00.
May be useful for the readers of your article with further fine tuning a little bit. Then the indicator settings could be universal for most of symbols.
Hi, my good friend @Anil Varma.
Thank you for sharing this unique approach! I’ll definitely give it a try.
Hello Friend
I am following your articles and they are informative. Thanks for sharing and spreading knowledge.
I have tried 21Period ATR multiple as below:
gTestProximity = (MathMax((75/_Digits),0.10*getATR(rates_total - 1))); // (n*getATR(index) replaced for ...InpTextProximity;
gMinDistance = (MathMax((150/_Digits),0.20*getATR(rates_total - 1))); // (n*getATR(index) replaced for ...InpMinWeakDistance;
This helped me getting SRZones for both EURUSD and XAUUSD pairs with quite difference in there values 1.08000 to 3000.00.
May be useful for the readers of your article with further fine tuning a little bit. Then the indicator settings could be universal for most of symbols.
Could you share your version of the ATR indicator?
Hello
Could you share your version of the ATR indicator?
Hi @Evgeny Fedorenko
First sorry for replying too late, actually I have diverted my attention to Quant Financial Modeling course.
Secondly I did not created any indicator for myself, just tried Clemence Benjamin indicator code with the tweak suggested in my post.
Hope this helps you out.