Reimagining Classic Strategies in MQL5 (Part II): FTSE100 and UK Gilts
There are potentially infinite ways for the modern investor to integrate AI into their trading strategies. It is highly unlikely that any individual investor will have enough time to carefully analyze each strategy before deciding which one to trust with your capital. In this series of articles, we will explore the vast landscape of possible applications of AI in the trading environment. Our goal is to help you identify a strategy that is suitable for your particular investor profile.
Trading Strategy Overview
The Financial Times Stock Exchange 100 (FTSE100) is a globally recognized index tracking the performance of the 100 largest companies listed on the London Stock Exchange (LSE). The index was created in 1984 with a value of 1000 points, and is currently trading around 8000 points. The companies inside the index are weighted proportionally to their market capitalization, meaning that larger companies have more influence over the market than smaller companies.
All Governments in the developed world issue liabilities denominated in their domestic currency, and the UK government is no exception. The gilt is a UK government debt instrument, and it is also listed on the LSE. Gilts are fixed income securities that are available in 2 different types. The first type is the conventional guilt, and it constitutes the majority of guilt sales. This conventional guilt pays out a fixed coupon to the bearer of the guilt until maturity, upon maturity the final coupon and principal are paid back to the investor.
The second type of guilt is the index-linked guilt. This particular guilt does not have a fixed coupon rate, rather the payouts received from the bond are allowed to float, to compensate the investor for the total inflation accrued whilst holding on to the guilt. These index-linked guilts are not as popular as the fixed guilts due to their unpredictable cash flow streams.
There is an inverse relationship between the yield of a bond and the demand for a bond. Whenever a particular bond is in high demand among investors, the yield associated with the bond falls, conversely if the bond is performing poorly, its yield will rise in an attempt to kindle investor interest.
Typically, whenever the stock markets are performing dismally, investors tend to withdraw their funds from the risky stock market and rather invest it in safer securities like government bonds. Conversely, when investors regain confidence in the stock market, they tend to withdraw their funds from the safe government bonds and invest in the stock market. The primary reason for this behavior is rooted in the spread of expected returns. On average, the stock market guarantees greater average returns than the bond market, making it more attractive. However, the stock market carries greater intrinsic risk, making its investors quite sensitive to signs of weakness.
Methodology Overview
We built an AI-powered Expert Advisor to learn its own trading rules regarding the two markets. Typically as investors, we are biased towards strategies that appeal to us, however by taking an algorithmic learning approach, we can rest assured that our program is making all its decisions based on the data we have collected.
Financial time series data are notoriously noisy. When dealing with noisy datasets, it is well known that simpler models can perform just as well as Neural Networks. Therefore, we implemented a Linear Regression model from scratch in MQL5 using the matrix and vector API. We standardized and scaled our input data before fitting our model because our input data were on different scales, the Gilts and UK100 symbol are on different scales. We employed the pseudo-inverse solution to calculate our model parameters.
Furthermore, we guided our AI model using technical analysis, therefore our system will only enter a trade if our technical indicators also lead us to the same conclusion. Lastly, we also used our AI system to help us detect potential reversals and also decide when to close our positions. In our previous articles, when we developed our Linear Models from scratch, one of the users commented that the model’s output was beyond the acceptable range. In this article, we have attempted to resolve that issue by including a column for our model intercept and by standardizing and scaling our data.
Implementation in MQL5
To get started, we first built a script in MQL5 to get an idea of how all the pieces of our Expert Advisor will fit together. First, we have to define the inputs for our application. We need to define how much data to fetch, and how far into the future we should forecast. Recall that the more data you fetch, the more computationally intensive the application will be eventually. Therefore, we try to strike a balance here by allowing the end user to fetch as much data as they believe their resources can handle. Furthermore, we should keep in mind that market regimes change. Therefore, we may not gain any improvements in performance by fetching all the data available.
Lately, market quotes are being offered algorithmically, as opposed to the system of open outcry that preceded it. There may be no value in studying market quotes based on market behavior that we are unlikely to ever see again. Therefore, we will narrow our focus to only recent data.
//+------------------------------------------------------------------+
//|                                                  UK100 Gilts.mq5 |
//|                                        Gamuchirai Zororo Ndawana |
//|                          https://www.mql5.com/en/gamuchiraindawa |
//+------------------------------------------------------------------+
#property copyright "Gamuchirai Zororo Ndawana"
#property link      "https://www.mql5.com/en/gamuchiraindawa"
#property version   "1.00"
#property script_show_inputs

//+------------------------------------------------------------------+
//| Inputs                                                           |
//+------------------------------------------------------------------+
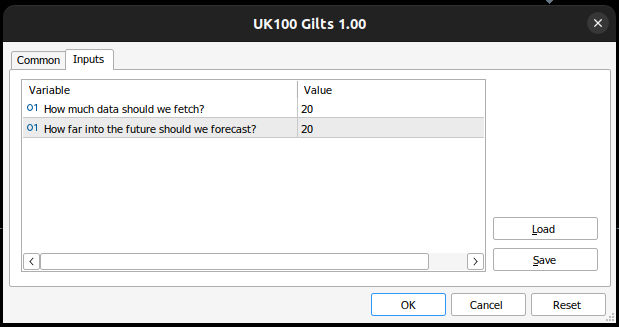
input int fetch = 20;                  //How much data should we fetch?
input int look_ahead = 20;             //How far into the future should we forecast?
Now we can start defining the heart of our script, first we will define variables that we will need throughout our script.
//+------------------------------------------------------------------+
//| Script program start function                                    |
//+------------------------------------------------------------------+
void OnStart()
  {
//--- Global variables we will need inside our expert advisor
   matrix coefficients = matrix::Zeros(1,9);
   vector mean_values = vector::Zeros(8);
   vector std_values = vector::Zeros(8);
   vector intercept = vector::Ones(fetch);
   matrix input_matrix = matrix::Zeros(9,fetch);
   matrix gilts_data,uk100_data,target;
Now let us fetch the data that we need, notice that the input data is being lagged by look_ahead number of steps and the target data is being fetched ahead of the input data.
//--- First we will fetch the market data
   gilts_data.CopyRates("UKGB_Z4",PERIOD_CURRENT,COPY_RATES_OHLC,1+look_ahead,fetch);
   uk100_data.CopyRates("UK100",PERIOD_CURRENT,COPY_RATES_OHLC,1+look_ahead,fetch);
   target.CopyRates("UK100",PERIOD_CURRENT,COPY_RATES_CLOSE,1,fetch);
We now need to create an input matrix. The first column in our input matrix will be the number one, repeated for as many times as the input fetch. This is because this entry of ones is simply supposed to be multiplied by our calculation of the bias term in our linear model. From there, we fill in the data related to the UK government bonds and the FTSE 100.
//--- Fill in the input matrix
   input_matrix.Row(intercept,0);
   input_matrix.Row(gilts_data.Row(0),1);
   input_matrix.Row(gilts_data.Row(1),2);
   input_matrix.Row(gilts_data.Row(2),3);
   input_matrix.Row(gilts_data.Row(3),4);
   input_matrix.Row(uk100_data.Row(0),5);
   input_matrix.Row(uk100_data.Row(1),6);
   input_matrix.Row(uk100_data.Row(2),7);
   input_matrix.Row(uk100_data.Row(3),8);
Let us see the data we have fetched, to ensure the data is the right size and that the matrices we have are conformable for the manipulations we are about to perform. Note that if our matrices are not the appropriate sizes, our calculations will fail and return errors upon execution.
//--- Display the data fetched
   Print("Input matrix: ");
   Print("Rows: ",input_matrix.Rows()," Columns: ",input_matrix.Cols());
   Print(input_matrix);

   Print("Target: ");
   Print("Rows: ",target.Rows()," Columns: ",target.Cols());
   Print(target);

   Print("UK100: ");
   Print("Rows: ",uk100_data.Rows()," Columns: ",uk100_data.Cols());
   Print(uk100_data);

   Print("GILTS: ");
   Print("Rows: ",gilts_data.Rows()," Columns: ",gilts_data.Cols());
   Print(gilts_data);
To scale and normalize our input data, we need to calculate the mean and standard deviation values for each column we are dealing with. When I was first learning machine learning, I was not sure when it was necessary to scale and standardize the data. However, overtime I've learned a rule of thumb that scaling is necessary when your inputs are on different scales, so for example our gilts market data ranges in the 100's but our FTSE100 market data ranges in the 8000's therefore scaling here is necessary. Note, it is never necessary to scale the target.
//--- Calculate the scaling values
   mean_values = input_matrix.Mean(1);
   std_values = input_matrix.Std(1);
   Print("Mean values: ");
   Print(mean_values);

   Print("Std values: ");
   Print(std_values);
Now, for us to normalize our input data, we first subtract the column mean and then divide by the standard deviation. This preprocessing step, helps our model learn effectively, and it is critical to perform when the model inputs are on different scales, such as our case.
//--- Normalizing and scaling our input data
   for(int i = 0; i < 8; i++)
     {
      //--- Extract the vector
      vector temp = input_matrix.Row(i + 1);
      //--- Scale the data
      temp = ((temp - mean_values[i+1]) / std_values[i+1]);
      //--- Write the data back
      input_matrix.Row(temp,i+1);
     }

//--- Finished normalizing the data
   Print("Finished normalizing the data.");
   Print(input_matrix);
Let us now calculate our model parameters, the coefficients of our linear model. We can do so by performing a matrix multiplication of the target data and the pseudo-inverse of the input data, this will return us a 1xn matrix with 1 coefficient value for each column in our matrix. The sign of each coefficient value tells us the slope, or whether the target increases or decreases as the input variable increases.
//--- Now we can calculate our coefficient values
   coefficients = target.MatMul(input_matrix.PInv());

   Print("Coefficient values");
   Print(coefficients);
To obtain a forecast from our model, we firs have to fetch current input data values, scale them and then apply the linear regression formula to get our model’s prediction.
//--- Now we can obtain a forecast from our model
   gilts_data.CopyRates("UKGB_Z4",PERIOD_CURRENT,COPY_RATES_OHLC,0,1);
   uk100_data.CopyRates("UK100",PERIOD_CURRENT,COPY_RATES_OHLC,0,1);

//--- Scale our inputs
   gilts_data[0,0] = ((gilts_data[0,0] - mean_values[1]) / std_values[1]);
   gilts_data[1,0] = ((gilts_data[1,0] - mean_values[2]) / std_values[2]);
   gilts_data[2,0] = ((gilts_data[2,0] - mean_values[3]) / std_values[3]);
   gilts_data[3,0] = ((gilts_data[3,0] - mean_values[4]) / std_values[4]);
   uk100_data[0,0] = ((uk100_data[0,0] - mean_values[5]) / std_values[5]);
   uk100_data[1,0] = ((uk100_data[1,0] - mean_values[6]) / std_values[6]);
   uk100_data[2,0] = ((uk100_data[2,0] - mean_values[7]) / std_values[7]);
   uk100_data[3,0] = ((uk100_data[3,0] - mean_values[8]) / std_values[8]);

   Print("Normalized inputs: ");
   Print(gilts_data);
   Print(uk100_data);

   double forecast = (
                        (1 * coefficients[0,0]) +
                        (gilts_data[0,0] * coefficients[0,1]) +
                        (gilts_data[1,0] * coefficients[0,2]) +
                        (gilts_data[2,0] * coefficients[0,3]) +
                        (gilts_data[3,0] * coefficients[0,4]) +
                        (uk100_data[0,0] * coefficients[0,5]) +
                        (gilts_data[1,0] * coefficients[0,6]) +
                        (gilts_data[2,0] * coefficients[0,7]) +
                        (gilts_data[3,0] * coefficients[0,8])
                     );

//--- Give our predictions
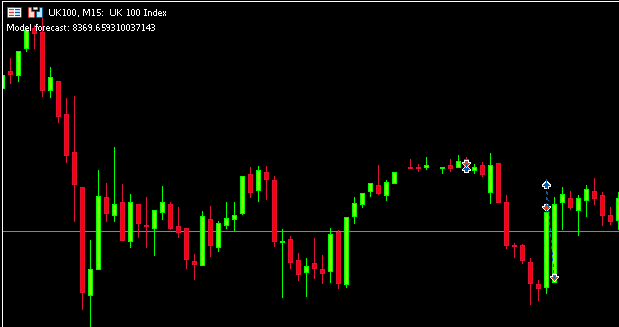
   Comment("Model forecast: ",forecast);

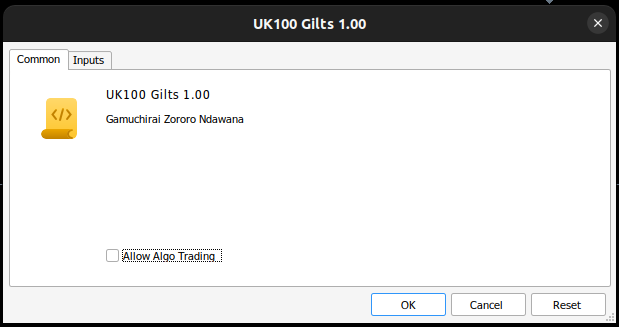
Fig 1: Our script

Fig 2: Our script inputs

Fig 3: Our model's forecast
Building Our Expert Advisor in MQL5
Now that we have come this far, we are ready to start building our Expert Advisor. To get started building our application, we will first import the trade library so that we can manage our positions.
//+------------------------------------------------------------------+
//|                                                  UK100 Gilts.mq5 |
//|                                        Gamuchirai Zororo Ndawana |
//|                          https://www.mql5.com/en/gamuchiraindawa |
//+------------------------------------------------------------------+
#property copyright "Gamuchirai Zororo Ndawana"
#property link      "https://www.mql5.com/en/gamuchiraindawa"
#property version   "1.00"

//+------------------------------------------------------------------+
//|Libraries we need                                                 |
//+------------------------------------------------------------------+
#include <Trade/Trade.mqh>             //Trade class
CTrade Trade;                          //Initialize the class
Then we will set up the inputs for our application so that the end user can decide how much data to fetch and how far into the future we should forecast.
//+------------------------------------------------------------------+
//| Inputs                                                           |
//+------------------------------------------------------------------+
input int fetch = 20;                  //How much data should we fetch?
input int look_ahead = 20;             //How far into the future should we forecast?
We also need global variables that will be used throughout the program.
//+------------------------------------------------------------------+
//| Global vairables                                                 |
//+------------------------------------------------------------------+
matrix coefficients = matrix::Zeros(1,9);
vector mean_values = vector::Zeros(8);
vector std_values = vector::Zeros(8);
vector intercept = vector::Ones(fetch);
matrix input_matrix = matrix::Zeros(9,fetch);
matrix gilts_data,uk100_data,target;
double willr_buffer[],rsi_buffer[];
int willr_handler,rsi_handler;
double forecast,bid,ask;
int model_forecast = 0;
int state = 0;
Let us define a function responsible for fetching our training data and getting the scaling values we need to standardize and scale our data. Notice that we are using matrices instead of arrays, this is because we intend to take advantage of the specialized matrix and vector functions included in the MQL5 API.
//+------------------------------------------------------------------+
//| Let us fetch our training data                                   |
//+------------------------------------------------------------------+
void fetch_training_data(void)
  {
//--- First we will fetch the market data
   gilts_data.CopyRates("UKGB_Z4",PERIOD_CURRENT,COPY_RATES_OHLC,1+look_ahead,fetch);
   uk100_data.CopyRates("UK100",PERIOD_CURRENT,COPY_RATES_OHLC,1+look_ahead,fetch);
   target.CopyRates("UK100",PERIOD_CURRENT,COPY_RATES_CLOSE,1,fetch);

//--- Fill in the input matrix
   input_matrix.Row(intercept,0);
   input_matrix.Row(gilts_data.Row(0),1);
   input_matrix.Row(gilts_data.Row(1),2);
   input_matrix.Row(gilts_data.Row(2),3);
   input_matrix.Row(gilts_data.Row(3),4);
   input_matrix.Row(uk100_data.Row(0),5);
   input_matrix.Row(uk100_data.Row(1),6);
   input_matrix.Row(uk100_data.Row(2),7);
   input_matrix.Row(uk100_data.Row(3),8);

//--- Display the data fetched
   Print("Input matrix: ");
   Print("Rows: ",input_matrix.Rows()," Columns: ",input_matrix.Cols());
   Print(input_matrix);

   Print("Target: ");
   Print("Rows: ",target.Rows()," Columns: ",target.Cols());
   Print(target);

   Print("UK100: ");
   Print("Rows: ",uk100_data.Rows()," Columns: ",uk100_data.Cols());
   Print(uk100_data);

   Print("GILTS: ");
   Print("Rows: ",gilts_data.Rows()," Columns: ",gilts_data.Cols());
   Print(gilts_data);

//--- Calculate the scaling values
   mean_values = input_matrix.Mean(1);
   std_values = input_matrix.Std(1);

   Print("Mean values: ");
   Print(mean_values);

   Print("Std values: ");
   Print(std_values);
  }
//+------------------------------------------------------------------+
Now that we have our scaling values, let us define a function to actually scale and standardize our input data.
//+------------------------------------------------------------------+
//| Let us scale and standardize the training data                   |
//+------------------------------------------------------------------+
void scale_training_data(void)
  {
//--- Normalizing and scaling our input data
   for(int i = 0; i < 8; i++)
     {
      //--- Extract the vector
      vector temp = input_matrix.Row(i + 1);
      //--- Scale the data
      temp = ((temp - mean_values[i+1]) / std_values[i+1]);
      //--- Write the data back
      input_matrix.Row(temp,i+1);
     }

//--- Finished normalizing the data
   Print("Finished normalizing the data.");
   Print(input_matrix);
  }
After our training data has been scaled and standardized, we are ready to calculate our model parameters.
//+------------------------------------------------------------------+
//| Calculate coefficient values                                     |
//+------------------------------------------------------------------+
void calculate_coefficient_values(void)
  {
//--- Now we can calculate our coefficient values
   coefficients = target.MatMul(input_matrix.PInv());

   Print("Coefficient values");
   Print(coefficients);
  }
We also need a function responsible for fetching a prediction from our model. Our procedure is simple, we will first fetch the market data, scale the data and then finally apply the linear regression formula to obtain a prediction.
//+------------------------------------------------------------------+
//| Fetch a forecast from our model                                  |
//+------------------------------------------------------------------+
void fetch_forecast(void)
  {
//--- Now we can obtain a forecast from our model
   gilts_data.CopyRates("UKGB_Z4",PERIOD_CURRENT,COPY_RATES_OHLC,0,1);
   uk100_data.CopyRates("UK100",PERIOD_CURRENT,COPY_RATES_OHLC,0,1);

//--- Scale our inputs
   gilts_data[0,0] = ((gilts_data[0,0] - mean_values[1]) / std_values[1]);
   gilts_data[1,0] = ((gilts_data[1,0] - mean_values[2]) / std_values[2]);
   gilts_data[2,0] = ((gilts_data[2,0] - mean_values[3]) / std_values[3]);
   gilts_data[3,0] = ((gilts_data[3,0] - mean_values[4]) / std_values[4]);
   uk100_data[0,0] = ((uk100_data[0,0] - mean_values[5]) / std_values[5]);
   uk100_data[1,0] = ((uk100_data[1,0] - mean_values[6]) / std_values[6]);
   uk100_data[2,0] = ((uk100_data[2,0] - mean_values[7]) / std_values[7]);
   uk100_data[3,0] = ((uk100_data[3,0] - mean_values[8]) / std_values[8]);

   Print("Normalized inputs: ");
   Print(gilts_data);
   Print(uk100_data);

//--- Calculate the model's prediction
   forecast = (
                 (1 * coefficients[0,0]) +
                 (gilts_data[0,0] * coefficients[0,1]) +
                 (gilts_data[1,0] * coefficients[0,2]) +
                 (gilts_data[2,0] * coefficients[0,3]) +
                 (gilts_data[3,0] * coefficients[0,4]) +
                 (uk100_data[0,0] * coefficients[0,5]) +
                 (gilts_data[1,0] * coefficients[0,6]) +
                 (gilts_data[2,0] * coefficients[0,7]) +
                 (gilts_data[3,0] * coefficients[0,8])
              );

//--- Store the model's prediction
   if(forecast < iClose("UK100",PERIOD_CURRENT,0))
     {
      model_forecast = -1;
     }

   if(forecast > iClose("UK100",PERIOD_CURRENT,0))
     {
      model_forecast = 1;
     }

//--- Give the user feedback
   Comment("Model forecast: ",forecast);
  }
Finally, we also need a function to fetch current market data and technical indicator data.
//+------------------------------------------------------------------+
//| This function will fetch current market data                     |
//+------------------------------------------------------------------+
void update_market_data(void)
  {
//--- Market prices
   bid = SymbolInfoDouble("UK100",SYMBOL_BID);
   ask = SymbolInfoDouble("UK100",SYMBOL_ASK);

//--- Technical indicators
   CopyBuffer(rsi_handler,0,0,1,rsi_buffer);
   CopyBuffer(willr_handler,0,0,1,willr_buffer);
  }
We also need 2 functions that will validate our AI model’s prediction against our technical indicator readings. We wish to only enter high probability setups when both our technical and quantitative analysis both point in the same direction.
//+------------------------------------------------------------------+
//| This function will check if we have oppurtunities to buy         |
//+------------------------------------------------------------------+
void check_bullish_sentiment(void)
  {
   if((willr_buffer[0] > -20) && (rsi_buffer[0] > 70))
     {
      Trade.Buy(0.2,"UK100",ask,ask-5,ask+5,"UK100 Gilts AI");
      state = 1;
     }
  }

//+------------------------------------------------------------------+
//| This function will check if we have oppurtunities to sell        |
//+------------------------------------------------------------------+
void check_bearish_sentiment(void)
  {
   if((willr_buffer[0] < -80) && (rsi_buffer[0] <370))
     {
      Trade.Sell(0.2,"UK100",ask,ask-5,ask+5,"UK100 Gilts AI");
      state = -1;
     }
  }
Not only that, but we are now ready to start defining the initialization procedure for our Expert Advisor. First, we need to fetch the training data, from there we need to scale and standardize our training data, afterward, we will calculate our coefficient values, and finally, we will set up our technical indicators and validate that our technical indicators are valid.
//+------------------------------------------------------------------+
//| Expert initialization function                                   |
//+------------------------------------------------------------------+
int OnInit()
  {
//--- Fetch the training data
   fetch_training_data();

//--- Scale the training data
   scale_training_data();

//--- Calculate the coefficients
   calculate_coefficient_values();

//--- Setup the indicators
   rsi_handler = iRSI("UK100",PERIOD_CURRENT,20,PRICE_CLOSE);
   willr_handler = iWPR("UK100",PERIOD_CURRENT,30);

//--- Validate the technical indicators
   if((rsi_handler == INVALID_HANDLE) || (willr_handler == INVALID_HANDLE))
     {
      Comment("Failed to load indicators. ",GetLastError());
      return(INIT_FAILED);
     }

//--- Everything went well
   return(INIT_SUCCEEDED);
  }
Whenever our Expert Advisor is removed from the chart, we will free up the resources we are no longer using. We will detach the indicators we used in our technical analysis and furthermore, we will also remove our Expert Advisor off the chart.
//+------------------------------------------------------------------+
//| Expert deinitialization function                                 |
//+------------------------------------------------------------------+
void OnDeinit(const int reason)
  {
//--- Free up the resoruces we don't need
   IndicatorRelease(willr_handler);
   IndicatorRelease(rsi_handler);
   ExpertRemove();
  }
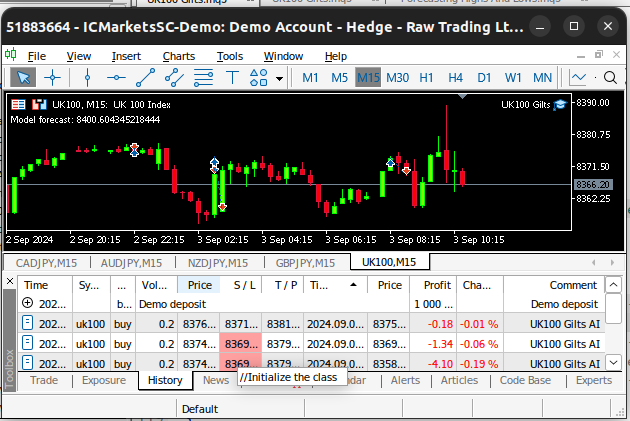
Finally, whenever we receive updated prices, we will first update our market data, then fetch a forecast from our AI model. If we have no open positions, we will check if our technical indicators align with our AI model before we open our positions. Otherwise, if we already have open positions, we will check if our AI model is forecasting a reversal against our open position. If our model is expecting a reversal, we will close our open positions.
//+------------------------------------------------------------------+
//| Expert tick function                                             |
//+------------------------------------------------------------------+
void OnTick()
  {
//--- Fetch updated market data
   update_market_data();

//--- Fetch a forecast from our model
   fetch_forecast();

//--- Check for a position we can open
   if(PositionsTotal() == 0)
     {
      if(model_forecast == 1)
        {
         check_bullish_sentiment();
        }

      else
         if(model_forecast == -1)
           {
            check_bearish_sentiment();
           }
     }

//--- Check for a reversal
   else
      if(PositionsTotal() > 0)
        {
         if(model_forecast != state)
           {
            Alert("Reversal detected by our AI system! Closing all positions now.");
            Trade.PositionClose("UK100");
           }
        }
  }
//+------------------------------------------------------------------+

Fig 4: Our AI system in action
Conclusion
In today's article we have demonstrated how you can build an AI guided Expert Advisor in MQL5, the biggest advantage of our approach is that we can change time-frame without having to re-calibrate our application, whereas if we implemented our solution using ONNX, we would need at least 1 ONNX model for each time-frame we wish to trade. Our current solution is self optimizing and able to work under many different conditions.
Warning: All rights to these materials are reserved by MetaQuotes Ltd. Copying or reprinting of these materials in whole or in part is prohibited.
This article was written by a user of the site and reflects their personal views. MetaQuotes Ltd is not responsible for the accuracy of the information presented, nor for any consequences resulting from the use of the solutions, strategies or recommendations described.
 Self Optimizing Expert Advisor with MQL5 And Python (Part III): Cracking The Boom 1000 Algorithm
 MQL5 Wizard Techniques you should know (Part 37): Gaussian Process Regression with Linear and Matérn Kernels
 Example of Stochastic Optimization and Optimal Control
 Formulating Dynamic Multi-Pair EA (Part 1): Currency Correlation and Inverse Correlation
- Free trading apps
- Over 8,000 signals for copying
- Economic news for exploring financial markets
You agree to website policy and terms of use
Check out the new article: Reimagining Classic Strategies in MQL5 (Part II): FTSE100 and UK Gilts.
Author: Gamuchirai Zororo Ndawana
Good explanation of each section of code.