
Automating Trading Strategies with Parabolic SAR Trend Strategy in MQL5: Crafting an Effective Expert Advisor
Introduction
Algorithmic trading strategies have greatly revolutionized financial trading by allowing traders to quickly make informed decisions. This has helped to eliminate human error and emotional biases as the automated systems follow predetermined parameters in the fast-paced market environment. Therefore, in automated trading, there is consistency as the system uses the same logic to execute trades every time.
It is a common practice to build and implement automated techniques using MetaTrader 5. This article delves deeply into the process of creating an Expert Advisor (EA) that uses the Parabolic SAR indicator to execute trades automatically.
An Overview of Parabolic SAR Strategy
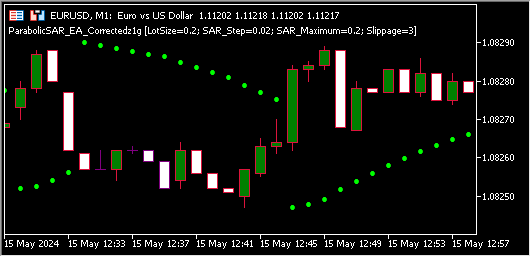
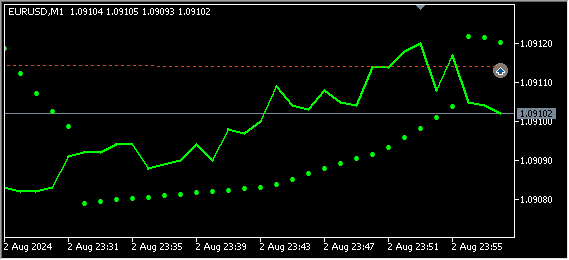
Parabolic SAR indicator. This indicator was invented in 1978 by Welles Wilder. The indicator highlights potential reversal points in the market trend through a series of dots on a chart that follows the price movement above and below. When the dots are below the price, the market is in an uptrend; when they are above, the market is downtrend. This makes it particularly useful for identifying potential reversal points, where a trend could be coming to an end.
SAR Step: This helps in determining how close the SAR dots track price. The lower step lags dots behind the price, decreasing sensitivity. A higher step moves dots closer to the price, increasing sensitivity.
SAR Dots: This acts as an acceleration factor as an upper limit. In a trending market, the Parabolic SAR increases steps to catch up with prices. Therefore, traders are able to identify entry and exit points for potential trend reversals.
This strategy can be integrated with other indicators to make it more comprehensive or used as a standalone strategy in trending markets such as forex and commodities.
Implementation in MQL5
In the header, we include basic metadata like copyright and version number. The Trade.mqh library is included to handle trade operations, that is opening and closing positions.
#property copyright "Copyright 2024, MetaQuotes Ltd." "Duke"
#property link      "https://www.mql5.com"
#property version   "1.00"
#include <Trade\Trade.mqh>
Let us now define the input parameters that allow us to customize the EA.
LotSize: It helps the EA to determine the size of the trades. That means a small LotSize will reduce the risks and profits due to reduced trade size. Also, if the LotSize is big, it means that there will be increased risks and profit.
SAR_Step and SAR_Maximum: They control the sensitivity of the Parabolic SAR in price movement detection and Parabolic SAR indicator calculation.
Slippage: This will help the EA in setting the maximum allowable slippage when placing orders.
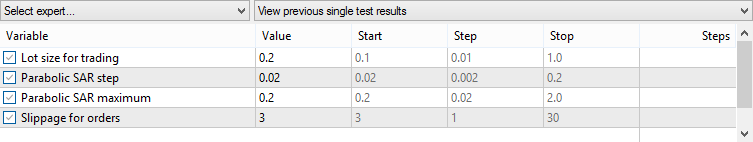
//--- Input parameters
input double LotSize = 0.2  ;                    // Lot size for trading
input double SAR_Step = 0.02;                    // Parabolic SAR step
input double SAR_Maximum = 0.2;                  // Parabolic SAR maximum
input int Slippage = 3;                          // Slippage for orders
We can create an instance of the CTrade class to manage trade operations.
//--- Trade object
CTrade trade;
Our next step is the OnInit function which is executed when the EA is loaded. In this simple EA, it just prints a confirmation message for the successful initialization of the Expert Advisor (EA) log. Therefore, we will verify that the EA has been loaded and initialized without any problem. This function is also of use in debugging ensuring that the EA is ready to start processing data. The function can also return INIT_FAILED if the initialization has failed by for reason, stopping the EA from operating.
int OnInit()
  {
//--- Initialization code here
   Print("Parabolic SAR EA Initialized");
   return(INIT_SUCCEEDED);
  }
We move to the OnDeint function. When the EA is recompiled, it is removed from the chart. This action activates the OnDeint function to carry out clean-up tasks and ensure resources are released appropriately. You can determine if the EA was explicitly removed, recompiled, or the result of the terminal shutdown by looking at this log, this can offer insightful information during the development and testing stage. This function can be expanded to any necessary clean-up procedures. For example, you may need to close any open resources, release file handles, or save the current state.
This will help to enhance dependability and stability as it will ensure performance problems from early runs do not interfere with the EA's ability to reload or restart.
void OnDeinit(const int reason)
  {
//--- Cleanup code here
   Print("Parabolic SAR EA Deinitialized");
  }
After the OnDeint we look at the OnTick function. This function is the core of the EA, executed with each market tick. It calculates the Parabolic SAR value and compares it with the last closing price. Based on this comparison, the EA determines whether to open a buy or sell order.
//+------------------------------------------------------------------+
//| Expert tick function                                             |
//+------------------------------------------------------------------+
void OnTick()
  {
//--- Get the Parabolic SAR value
   double sar = iSAR(_Symbol, _Period, SAR_Step, SAR_Maximum);        // Calculate the Parabolic SAR value
   double lastPrice = iClose(_Symbol, _Period, 1);                    // Get the close price of the previous candle

//--- Check if there is an existing position
   if(!IsPositionOpen(_Symbol))
     {
      //--- Determine trade direction based on SAR
      if(lastPrice > sar)
        {
         OpenBuyOrder();                                              // If the last price is above the SAR, open a buy order
        }
      else
         if(lastPrice < sar)
           {
            OpenSellOrder();                                          // If the last price is below the SAR, open a sell order
           }
     }
  }
We can now break down the OnTick function for better understanding.
- The Parabolic SAR calculation: The first line of the code calculates the Parabolic SAR value:
double sar = iSAR(_Symbol, _Period, SAR_Step, SAR_Maximum); // Calculate the Parabolic SAR value
- iSAR(): This is a built-in function in the MetaTrader platforms that calculates the Parabolic SAR indicator value for a given asset over a specified period.
- _Symbol: Refers to the financial instrument or trading asset like EUR/USD, Gold or any other trading item that you are currently analyzing.
- _Period: This indicates the chart's time frame (such as 1-minute, 1-hour, 1-day, etc.) This helps the function in determining which candles to use for calculating the SAR.
- _SAR_Step and SAR Maximum: These are parameters specific to the Parabolic SAR indicator that controls its sensitivity. The SAR_Step is the incremental step value that accelerates the indicator as the trend progresses , while the SAR Maximum caps the acceleration to prevent the indicator from reacting too quickly to price changes.
- Retrieving the previous Candle's Close Price: The next line retrieves the closing price of the last completed candle:
double lastPrice = iClose(_Symbol, _Period, 1); // Get the close price of the previous candle
- iClose(): This function returns the closing price of a particular candle in the chart.
- _Symbol and _Period: Just like the iSAR() function, this refers to the specific financial instrument and timeframe being analyzed.
- 1: This parameter specifies which candle's close price we want. In this case, 1 indicates the last completed candle(the previous one), as the current candle is still forming.
This value, stored in the LastPrice, represents the final price level at which the asset traded when the last candle closed.
We use the Parabolic SAR code to automate decisions on setting stop-losses and determining trade exits or reversals. For instance, if the closing price falls below the SAR value in a long position, it may indicate a trend reversal, prompting a trader to close the position or consider a short one. The EA uses this comparison to determine if the market continuing its trend or reversing, this helps to remove emotions and rely on clear signals for trading.
When building a trading algorithm, it's common to implement a check to see if a position for a specific asset(symbol) is already open.
//--- Check if there is an existing position
   if(!IsPositionOpen(_Symbol))
IsPositinOpen(_Symbol): This function checks if there is currently an open position for the symbol _Symbol. Symbol typically represents the ticker or asset code.
!IsPositionOpen(_Symbol): This means that the condition becomes true only if no open position for the given symbol.
The if statement: If there is no open position for the given symbol, the code inside the if block will execute. This could involve opening a new position, executing a trade, or triggering other trading logic.
Therefore, this function will ensure that there is no overtrading that will be caused by opening multiple positions for the same symbol. This will help the system to maintain better control over trading activity.
The Parabolic SAR tracks trends, indicating entry and exit points with a trailing stop-loss that adjusts with price movements. A crossover signals a potential trend reversal.
 //--- Determine trade direction based on SAR
      if(lastPrice > sar)
        {
         OpenBuyOrder();                                              // If the last price is above the SAR, open a buy order
        }
      else
         if(lastPrice < sar)
           {
            OpenSellOrder();                                          // If the last price is below the SAR, open a sell order
           }
     }
  }
LastPrice: This represents the current market price of the asset being traded.
sar: This is the value of the Parabolic SAR at the current time.
Through comparison of the two, the algorithm determines if the trend is uptrend or downtrend and acts accordingly.
The Buy and Sell Logic
Buy Orders: Buy orders are initiated when the last price exceeds the sar value, indicating an upward trend. The algorithm then triggers the OpenBuyOrder() function to execute the trade, based on the assumption that the market will continue to rise with price above the SAR.
Sell Orders: Conversely, if the lastPrice is lower than the SAR, this is interpreted as a signal that the market is in a downward trend. The algorithm responds by calling the OpenSellOrder() function, initiating a sell trade. Here, the strategy assumes that since the price has dipped below the SAR, the market may continue to decline.
The code prioritizes the evaluation of a buy order first. If the condition for a buy order (lastprice > sar)is satisfied, the system immediately executes a buy trade. If that condition is not met, the code then checks for a sell condition (lastPrice<sar). If the condition is true, a sell trade is executed.
Our next step is the utility function
Here we start with checking for the OpenPositions function. The IsPositionOpen function checks if there is already an open position for the current trading symbol. This prevents the EA from opening multiple positions in the same direction simultaneously.
//+------------------------------------------------------------------+
//|Check if there is an open position for the given symbol           |
//+------------------------------------------------------------------+
bool IsPositionOpen(string symbol)
  {
   uint total=PositionsTotal();                                     //Get the total number of open positions
   for(uint i=0; i<total; i++)
     {
      string POSITION_SYMBOL=PositionGetSymbol(i);                 //Get the symbol of the position
      if(POSITION_SYMBOL == _Symbol)                               //Check if the symbol matches the current symbol
        {
         return true;
        }
     }
   return false;
  }
We now look into it in detail by breaking down the function code as follows;
- Input Parameters: The function takes a string symbol argument representing a desired symbol, such as a currency pair or a stock ticker.
- Gets Total Positions: The function retrieves the total number of currently open positions using PositionsTotal(). This function returns the number of positions open in the terminal at the time of execution.
- Iterates Through Positions: Using a for loop, the code iterates through all open positions. The variable total holds the number of open positions, the loop runs from 0 to total - 1.
- Compare symbols: The retrieved symbol, POSITION_SYMBOL, is then compared with the current symbol using the condition if (POSITION_SYMBOL==_SYMBOL). The variable _Symbol is a predefined identifier representing the symbol of the chart from which the function is called. If the symbols match, it indicates that there is already an open position for the given symbol.
- Return Value: If the function finds a match( i.e., a position for the given symbol is already open), it returns true. If no matching position is found after the loop has checked all the open positions, the function returns false, indicating that there are no open positions for the specified symbol.
This function is particularly useful in preventing the algorithm from opening a new position on the same when one is already active. For instance, if you are trading "EURUSD" and the function returns true, the strategy could avoid opening a new position and instead focus on managing the existing one.
Our next utility function is OpenBuyOrder(); this function is responsible for executing a buy trade. It attempts to open a buy order with a specified lot size, while also including error handling to ensure that the process is completed correctly or to notify the trader if something goes wrong.
//+------------------------------------------------------------------+
//| Open a Buy order                                                 |
//+------------------------------------------------------------------+
void OpenBuyOrder()
  {
   if(trade.Buy(LotSize, NULL, 0, 0, 0, "Buy Order"))
     {
      Print("Buy order placed successfully");
     }
   else
     {
      Print("Error placing buy order: ", GetLastError());
     }
  }
The function is declared as void OpenBuyOrder (), this means it does not return any value but performs a specific task, in this case placing a buy order.
The function uses the method of trade.Buy() to execute a buy order. The method requires the following parameters:
- LotSize: This specifies the size of the order and in our case, it is 0.2.
- Null: Refers to the current symbol of the chart from which the function is called. In this case, NULL defaults to the symbol on the current chart.
- 0: It sets the price at which the order is placed. Using zero indicates that the order will be executed at the current market price.
- 0: This parameter represents the stop-loss level. 0 means that no stop-loss is specified when the order is opened.
- 0: This parameter is the take profit level. Setting it to zero means no take profit is set initially.
- "Buy Order": This is the comment associated with the order, used for identification purposes.
If the order is placed successfully (if(trade.Buy(....) evaluates to true), the function calls the Print() function to log the message: "Buy order placed successfully". This provides feedback to the trader that the order was successfully executed.
If the order fails (else), the function logs an error message: "Error placing buy order", followed by the specific error code returned by GetLastError(). The GetLastError () function retrieves the last error that occurred in the system, giving the trader a developer valuable information for troubleshooting the issue.
Our last utility function is, Opening a Sell Order: This function is designed to automate the process of opening a sell order in an algorithmic trading system. This function mirrors the logic of the OpenBuyOrder() function but is tailored for short trades, or sell orders, in the market.
//+------------------------------------------------------------------+
//| Open a Sell order                                                |
//+------------------------------------------------------------------+
void OpenSellOrder()
  {
   if(trade.Sell(LotSize, NULL, 0, 0, 0, "Sell Order"))
     {
      Print("Sell order placed successfully");
     }
   else
     {
      Print("Error placing sell order: ", GetLastError());
     }
  }
The function void OpenSellOrder() does not return any value but focuses on performing a specific task: placing a sell order.
The trade.Sell() method is used to initiate a sell order. The parameters passed to this method are as follows:
- Lotsize: This defines the number of lots for the sell order and in our case, it is 0.2.
- NULL: Represents the symbol of the current chart from which the function is being called. By passing null, the function defaults to trading the symbol on the current chart.
- 0: Sets the price for the order. By using 0, the order will be executed at the current market price.
- 0: Represents the stop-loss level. A value of 0 means no stop-loss level is specified when the order is opened.
- 0: Specified the take-profit level. A value of zero means no take-profit is set initially.
- Sell order: This is a comment attached to the order, which helps identify and track the order.
If the sell order is placed successfully, the logs a success message using the Print() function. The message "Sell order placed successfully" will appear in the terminal's log to confirm that the trade has been executed.
In case the sell order fails for any reason, the function logs an error message: "Error placing sell order:", followed by the specific error code returned by GetLastError(). This helps diagnose why the sell order was not placed.
Below is the full code of our article:
//+------------------------------------------------------------------+
//|                                              ParabolicSAR_EA.mq5 |
//|                            Copyright 2024, MetaQuotes Ltd."Duke" |
//|                                             https://www.mql5.com |
//+------------------------------------------------------------------+
#property copyright "Copyright 2024, MetaQuotes Ltd." "Duke"
#property link      "https://www.mql5.com"
#property version   "1.00"
#include <Trade\Trade.mqh>

//--- Input parameters
input double LotSize = 0.2  ;                    // Lot size for trading
input double SAR_Step = 0.02;                    // Parabolic SAR step
input double SAR_Maximum = 0.2;                 // Parabolic SAR maximum
input int Slippage = 3;                        // Slippage for orders

//--- Trade object
CTrade trade;

//+------------------------------------------------------------------+
//| Expert initialization function                                   |
//+------------------------------------------------------------------+
int OnInit()
  {
//--- Initialization code here
   Print("Parabolic SAR EA Initialized");
   return(INIT_SUCCEEDED);
  }

//+------------------------------------------------------------------+
//| Expert deinitialization function                                 |
//+------------------------------------------------------------------+
void OnDeinit(const int reason)
  {
//--- Cleanup code here
   Print("Parabolic SAR EA Deinitialized");
  }

//+------------------------------------------------------------------+
//| Expert tick function                                             |
//+------------------------------------------------------------------+
void OnTick()
  {
//--- Get the Parabolic SAR value
   double sar = iSAR(_Symbol, _Period, SAR_Step, SAR_Maximum);        // Calculate the Parabolic SAR value
   double lastPrice = iClose(_Symbol, _Period, 1);                    // Get the close price of the previous candle

//--- Check if there is an existing position
   if(!IsPositionOpen(_Symbol))
     {
      //--- Determine trade direction based on SAR
      if(lastPrice > sar)
        {
         OpenBuyOrder();                                              // If the last price is above the SAR, open a buy order
        }
      else
         if(lastPrice < sar)
           {
            OpenSellOrder();                                          // If the last price is below the SAR, open a sell order
           }
     }
  }
//+------------------------------------------------------------------+
//|Check if there is an open position for the given symbol           |
//+------------------------------------------------------------------+
bool IsPositionOpen(string symbol)
  {
   uint total=PositionsTotal();                                     //Get the total number of open positions
   for(uint i=0; i<total; i++)
     {
      string POSITION_SYMBOL=PositionGetSymbol(i);                 //Get the symbol of the position
      if(POSITION_SYMBOL == _Symbol)                               //Check if the symbol matches the current symbol
        {
         return true;
        }
     }
   return false;
  }
//+------------------------------------------------------------------+
//| Open a Buy order                                                 |
//+------------------------------------------------------------------+
void OpenBuyOrder()
  {
   if(trade.Buy(LotSize, NULL, 0, 0, 0, "Buy Order"))
     {
      Print("Buy order placed successfully");
     }
   else
     {
      Print("Error placing buy order: ", GetLastError());
     }
  }

//+------------------------------------------------------------------+
//| Open a Sell order                                                |
//+------------------------------------------------------------------+
void OpenSellOrder()
  {
   if(trade.Sell(LotSize, NULL, 0, 0, 0, "Sell Order"))
     {
      Print("Sell order placed successfully");
     }
   else
     {
      Print("Error placing sell order: ", GetLastError());
     }
  }
Up to this point we have now implemented our EA.
Below are the backtest results:
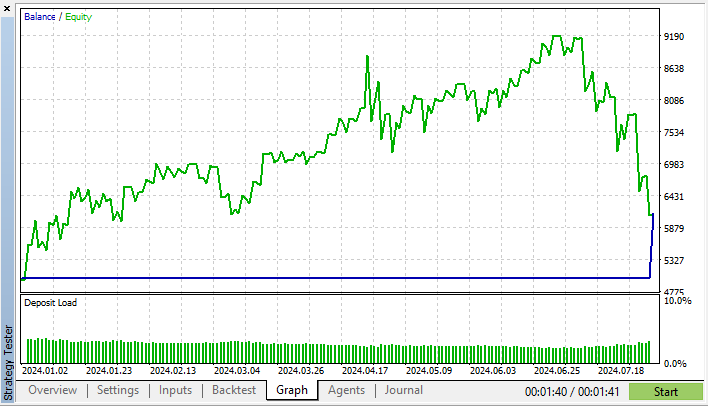
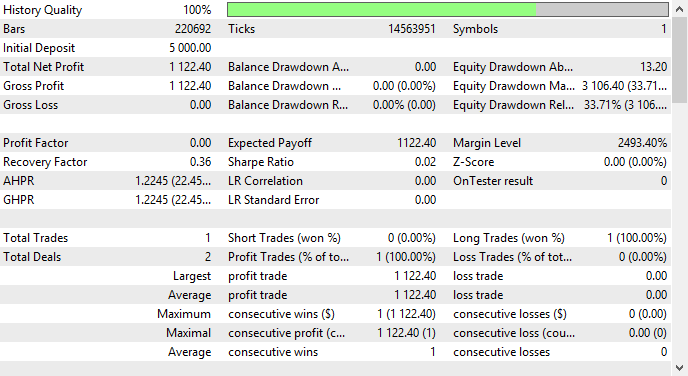
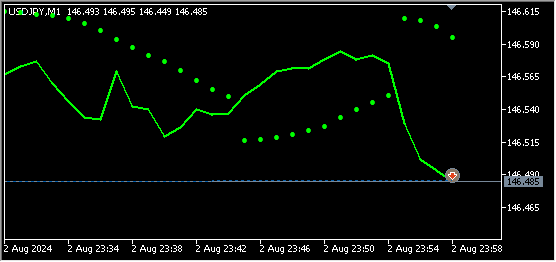
The testing was on USDJPY in a M1 chart. The testing period was from 2024.01.01 to 2024.08.05. Type of modeling, every tick.
Below are the input parameters used in the testing process:
After several tests on an M1 chart, I was able to realize that:
- This strategy is suitable for USDJPY and EURUSD.
- This strategy does not work well in GBPUSD.
Conclusion
From the results we can conclude that, this simple Expert Advisor (EA) can assure a trader of some good results if, further refinement and adaptation is done to the EA to enhance it's management and also reduce exposure of the assets to high risks. This will involve risk-implementing risk management features like adding a trailing stop that will help to enhance the performance of the EA by securing profits as the market moves favorably. Parameter optimization, several tests, and fine-tunes settings like SAR Step and Maximum for optimal performance in various market conditions.
Disclaimer : This code is only intended to help traders get the basics of implementing Parabolic SAR strategy: Crafting an effective Expert Advisor, the demo results that we obtained from our back test don't guarantee future performance of the EA in trading.
Thorough back testing and forward testing are crucial before live deployment, with continuous monitoring essential to prevent unexpected losses and make quick adjustments. Automating trading with this strategy can help minimize human errors and fatigue, allowing for the creation of a sophisticated and profitable trading system through customization, optimization, and testing. Therefore, embracing this type of automation can lead to more efficient capitalization on opportunities and improved trading performance. Up to this point the article has demonstrated and provided the necessary knowledge and skills required for implementation of Parabolic SAR Strategy. Any other resources required for implementation can be accessed in our MQL5 platform.
- Free trading apps
- Over 8,000 signals for copying
- Economic news for exploring financial markets
You agree to website policy and terms of use
PSAR with Deep Learning Models give excellent results.
can you please point out how you use dl and psar?
https://www.mql5.com/en/articles/15589
Good joke
That's a good one.
not a bad one.
Without it I wouldn't have noticed that :
on the website the article is dated 10 March 2025, first comment 26 Aug 2024 7 months BEFORE publication :-)
"dark water in the sky"
on the website the article is dated 10 Mar 2025, first comment 26 Aug 2024 7 months BEFORE publication :-)
That's the date of the translation. The original article was published on 23 Aug 2024