
Deconstructing examples of trading strategies in the client terminal

Contents
Introduction
In the early 1990s, Japanese candlestick charts and candlestick patterns developed by technical analyst Steve Nison were introduced to Western financial markets. Since then, knowledge of candlestick patterns has become as essential for traders as the ability to apply classical technical analysis.
For some time now, a new Free Robots folder has appeared in the EA directory of the client terminal:
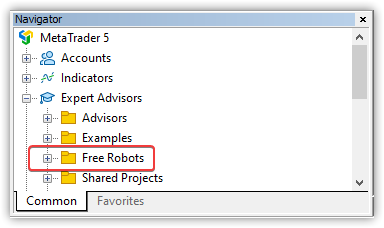
The folder contains 28 EAs - examples of trading strategies for independent study and application of the principles laid down in the strategy for your own developments. The trading strategies presented in the Free Robots folder are EAs that trade on candlestick patterns supported by indicator signals.
To confirm candlestick pattern signals, the values of one of four oscillator indicators are used: CCI, MFI, RSI and Stochastic Oscillator. Thus, 7 EAs trading on candlestick patterns are presented for study (each with two patterns - one pattern for long and one for short positions), and each of these EAs is presented in four copies - according to the number of confirming indicators.
Trading strategies overeview
Each of the trading strategies uses two similar patterns different in direction and name:
1. BlackCrows WhiteSoldiers
| | 3 White Soldiers: Buy pattern — 3 consecutive white candles with a body of sufficient size. Used as a signal of a possible reversal of the downward (bearish) trend. |
| | 3 Black Crows: Sell pattern — 3 consecutive black candles with a body of sufficient size. Used as a signal of a possible reversal of the upward (bullish) trend. |
Based on the candlestick patterns described above, the terminal offers four training EAs:
- BlackCrows WhiteSoldiers CCI.mq5 — EA based on 3 White Soldiers and 3 Black Crows patterns with confirmation of signals by the CCI indicator.
- BlackCrows WhiteSoldiers MFI.mq5 — EA based on 3 White Soldiers and 3 Black Crows patterns with confirmation of signals by the MFI indicator.
- BlackCrows WhiteSoldiers RSI.mq5 — EA based on 3 White Soldiers and 3 Black Crows patterns with confirmation of signals by the RSI indicator.
- BlackCrows WhiteSoldiers Stoch.mq5 — EA based on 3 White Soldiers and 3 Black Crows patterns with confirmation of signals by the Stochastic Oscillator indicator.
2. BullishBearish Engulfing
| | Bullish Engulfing: Buy pattern A "bullish engulfing" occurs when, during a downtrend, a bearish candle is followed by a bullish candle whose body completely engulfs the body of the bearish one. It is a signal of a possible reversal of the downward (bearish) trend. |
| | Bearish Engulfing: Sell pattern A "bearish engulfing" occurs when, during an uptrend, a bullish candle is followed by a bearish candle whose body completely engulfs the body of the bullish one. It is a signal of a possible reversal of the upward (bullish) trend. |
Based on the candlestick patterns described above, the terminal offers four training EAs:
- BullishBearish Engulfing CCI.mq5 — EA based on Bullish Engulfing and Bearish Engulfing patterns with confirmation of signals by the CCI indicator.
- BullishBearish Engulfing MFI.mq5 — EA based on Bullish Engulfing and Bearish Engulfing patterns with confirmation of signals by the MFI indicator.
- BullishBearish Engulfing RSI.mq5 — EA based on Bullish Engulfing and Bearish Engulfing patterns with confirmation of signals by the RSI indicator.
- BullishBearish Engulfing Stoch.mq5 — EA based on Bullish Engulfing and Bearish Engulfing patterns with confirmation of signals by the Stochastic Oscillator indicator.
3. BullishBearish Harami
| | Bullish Harami: Buy pattern A "bullish harami" pattern occurs when a long bearish candlestick is followed by a bullish candlestick with its body completely contained within the body of the bearish one during a downtrend. It is a signal of a possible reversal of the downward (bearish) trend. |
| | Bearish Harami: Sell pattern A "bearish harami" pattern occurs when, during an uptrend, a long bullish candlestick is followed by a bearish candlestick with its body completely contained within the body of the bullish one. It is a signal of a possible reversal of the upward (bullish) trend. |
Based on the candlestick patterns described above, the terminal offers four training EAs:
- BullishBearish Harami CCI.mq5 — EA based on Bullish Harami and Bearish Harami patterns with confirmation of signals by the CCI indicator.
- BullishBearish Harami MFI.mq5 — EA based on Bullish Harami and Bearish Harami patterns with confirmation of signals by the MFI indicator.
- BullishBearish Harami RSI.mq5 — EA based on Bullish Harami and Bearish Harami patterns with confirmation of signals by the RSI indicator.
- BullishBearish Harami Stoch.mq5 — EA based on Bullish Harami and Bearish Harami patterns with confirmation of signals by the Stochastic Oscillator indicator.
4. BullishBearish MeetingLines
| | Bullish Meeting Lines: Buy pattern "Bullish meeting lines" are a combination of a bearish and a bullish candlestick that have the same (or very close) closing prices. The length of the bodies of both candles is greater than average. It is a signal of a possible reversal of the downward (bearish) trend. |
| | Bearish Meeting Lines: Sell pattern "Bearish meeting lines" are a combination of a bullish and a bearish candlestick that have the same (or very close) closing prices. The length of the bodies of both candles is greater than average. It is a signal of a possible reversal of the upward (bullish) trend. |
Based on the candlestick patterns described above, the terminal offers four training EAs:
- BullishBearish MeetingLines CCI.mq5 — EA based on Bullish Meeting Lines and Bearish Meeting Lines patterns with confirmation of signals by the CCI indicator.
- BullishBearish MeetingLines MFI.mq5 — EA based on Bullish Meeting Lines and Bearish Meeting Lines patterns with confirmation of signals by the MFI indicator.
- BullishBearish MeetingLines RSI.mq5 — EA based on Bullish Meeting Lines and Bearish Meeting Lines patterns with confirmation of signals by the RSI indicator.
- BullishBearish MeetingLines Stoch.mq5 — EA based on Bullish Meeting Lines and Bearish Meeting Lines patterns with confirmation of signals by the Stochastic Oscillator indicator.
5. DarkCloud PiercingLine
| | Piercing Line: Buy pattern A "piercing line" is a combination of a bearish and a bullish candlesticks. It is the opposite analog of the Dark Cloud Cover pattern. First, there is a large black candle, the next one has a low opening (below the minimum of the previous one) and a close above the middle of the first candle. It is a signal of a possible reversal of the downward (bearish) trend. |
| | Dark Cloud Cover: Sell pattern A "dark cloud cover" is a combination of a bullish and bearish candlesticks. First, there is a large white candle, the next candle has a high open (higher than the previous high) and a close below the middle of the first candle. This is one of the few cases where the high and low are taken into account. It is a signal of a possible reversal of the upward (bullish) trend. |
Based on the candlestick patterns described above, the terminal offers four training EAs:
- DarkCloud PiercingLine CCI.mq5 — EA based on PiercingLine and Dark Cloud Cover with confirmation of signals by the CCI indicator.
- DarkCloud PiercingLine MFI.mq5 — EA based on PiercingLine and Dark Cloud Cover with confirmation of signals by the MFI indicator.
- DarkCloud PiercingLine RSI.mq5 — EA based on PiercingLine and Dark Cloud Cover with confirmation of signals by the RSI indicator.
- DarkCloud PiercingLine Stoch.mq5 — EA based on PiercingLine and Dark Cloud Cover with confirmation of signals by the Stochastic Oscillator indicator.
6. HangingMan Hammer
| | Hammer: Buy pattern A "hammer" is a candle with a small body and a long lower shadow that appears after a downward trend. A hammer is a strong signal that the bear market's reign is coming to an end. |
| | Hanging Man: Sell pattern A "hanging man" is a candle with a small body and a long lower shadow that appears after an upward trend. A hanging man signals the end of the upward trend. |
Based on the candlestick patterns described above, the terminal offers four training EAs:
- HangingMan Hammer CCI.mq5 — EA based on Hammer and Hanging Man patterns with confirmation of signals by the CCI indicator.
- HangingMan Hammer MFI.mq5 — EA based on Hammer and Hanging Man patterns with confirmation of signals by the MFI indicator.
- HangingMan Hammer RSI.mq5 — EA based on Hammer and Hanging Man patterns with confirmation of signals by the RSI indicator.
- HangingMan Hammer Stoch.mq5 — EA based on Hammer and Hanging Man patterns with confirmation of signals by the Stochastic Oscillator indicator.
7. MorningEvening StarDoji
| | Morning Star: Buy pattern A "morning star" consists of three candles and appears during a downtrend: 1. A long black candle is followed by a candle with a small body (color does not matter) that does not intersect with the body of the black one. 2. The small body of the second candle means that the market has moved from a downward trend to a balance of power between bulls and bears. 3. The third candle of this pattern is a bullish one. Its body usually does not intersect with the body of the second candle, and the closing level is located inside the body of the first (bearish) candle. The pattern is a signal of a possible reversal of the downward (bearish) trend. |
| | Morning Doji Star: Buy pattern A "morning doji star" is a special case of the Morning Star pattern. In this case, the second candle of the pattern has the same open and close prices. In other words, it has no body. The pattern is a signal of a possible reversal of the downward (bearish) trend. |
| | Evening Star: Sell pattern An "evening star" also consists of three candles and appears during an uptrend: 1. A long white candle is followed by a candle with a small body (color does not matter) that does not intersect with the body of the white candle. 2. The small body of the second candle means that the market has moved from an uptrend to a balance of power between bulls and bears. 3. The third candle of this pattern is a black candle, the body of which usually does not intersect with the body of the second candle, and the closing level is located inside the body of the first (bullish) candle. The pattern is a signal of a possible reversal of the upward (bullish) trend. |
| | Evening Doji Star: Sell pattern An "evening doji star" is a special case of the Evening Star pattern. In this case, the second candle of the pattern has the same open and close prices. In other words, it has no body. The pattern is a signal of a possible reversal of the downward (bearish) trend. |
Based on the candlestick patterns described above, the terminal offers four training EAs:
- MorningEvening StarDoji CCI.mq5 — EA based on Morning Star (Morning Doji Star) and Evening Star (Evening Doji Star) patterns with confirmation of signals by the CCI indicator.
- MorningEvening StarDoji MFI.mq5 — EA based on Morning Star (Morning Doji Star) and Evening Star (Evening Doji Star) patterns with confirmation of signals by the MFI indicator.
- MorningEvening StarDoji RSI.mq5 — EA based on Morning Star (Morning Doji Star) and Evening Star (Evening Doji Star) patterns with confirmation of signals by the RSI indicator.
- MorningEvening StarDoji Stoch.mq5 — EA based on Morning Star (Morning Doji Star) and Evening Star (Evening Doji Star) patterns with confirmation of signals by the Stochastic Oscillator indicator.
All indicators used in EAs serve to confirm entries into a long or short position (in case of appropriate signals from candlestick patterns) and to close open positions based on indicator signals.
The tables below show the indicator values used to confirm position entries and to close open positions:
| Indicator | Buy | Sell |
|---|---|---|
| CCI | CCI (1)<-50 — CCI indicator value on the last completed bar is less than -50 | CCI(1)>50 — CCI indicator value on the last completed bar exceeds 50 |
| MFI | MFI(1)<40 — MFI indicator value on the last completed bar is less than 40 | MFI(1)>60 — MFI indicator value on the last completed bar exceeds 60 |
| RSI | RSI(1)<40 — RSI indicator line value on the last completed bar is less than 40 | RSI(1)>60 — RSI indicator line value on the last completed bar exceeds 60 |
| Stochastic | Stochastic Signal(1)<30 — Stochastic signal line value on the last completed bar is less than 30 | Stochastic Signal(1)>70 — Stochastic signal line value on the last completed bar exceeds 70 |
Technical indicator signals for closing positions occur when the indicator value crosses the border of the extreme zone, namely, entering or exiting the overbought or oversold zone.
| Indicator | Closing a long position | Closing a short position |
|---|---|---|
| CCI | CCI indicator crossing the level of 80 or -80 downwards | CCI indicator crossing the level of -80 or 80 upwards |
| MFI | MFI indicator crossing the level of 70 or 30 downwards | MFI indicator crossing the level of 30 or 70 upwards |
| RSI | RSI indicator crossing the level of 70 or 30 downwards | RSI indicator crossing the level of 30 or 70 upwards |
| Stochastic | Stochastic indicator signal line crossing the level of 80 or 20 downwards | Stochastic indicator signal line crossing the level of 20 or 80 upwards |
One separate EA works on a pair of candlestick patterns in opposite directions, and is presented in four versions of confirming indicators.
As a result, we have 7 * 4 = 28 different EAs organized according to a single structure. Let's consider the unified logic of all EAs using flow diagrams.
General logic
If you open any of the mentioned EAs in the code editor and study its code, you will see a simple structure:
The EA logic is based on flags and variables declared at the global level:
- ExtSignalOpen — position open signal. 1 — Buy, -1 — Sell, 0 — no signal,
- ExtSignalClose — position close signal. 2 — long, -2 — short, 0 — no signal,
- ExtPatternInfo — text description of the currently found pattern,
- ExtDirection — opened position direction. Text description,
- ExtPatternDetected — found pattern flag (true/false),
- ExtConfirmed — flag of a pattern signal confirmed by the indicator (true/false),
- ExtCloseByTime — flag indicating that closing is required based on the position holding time (true/false),
- ExtCheckPassed — successful data retrieval flag (true/false).
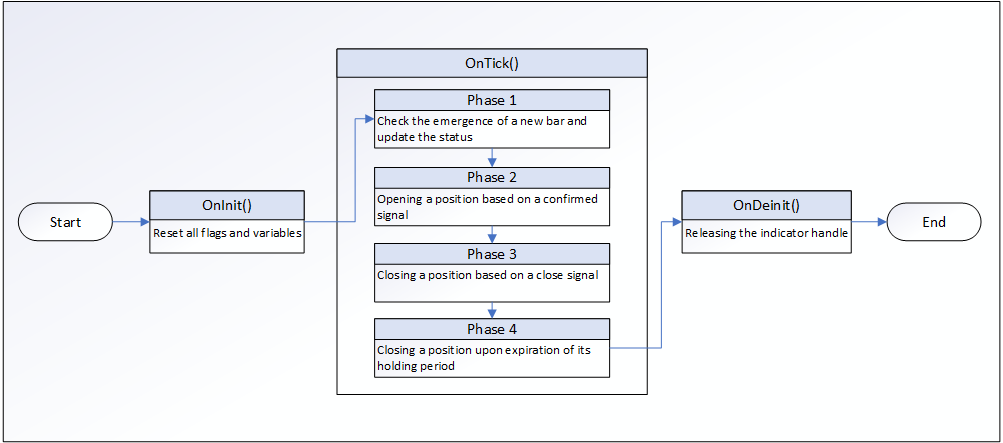
The EA logic is sequential and consists of the flag initialization block in the OnInit() handler and four processing stages in the OnTick() handler.
- Stage 1 — checking for a new bar and updating the environment and state of flags,
- Stage 2 — opening a position,
- Stage 3 — closing a position,
- Stage 4 — closing a position after its lifetime expires.
Let's consider the EA operation logic.
EA operation logic flow diagram
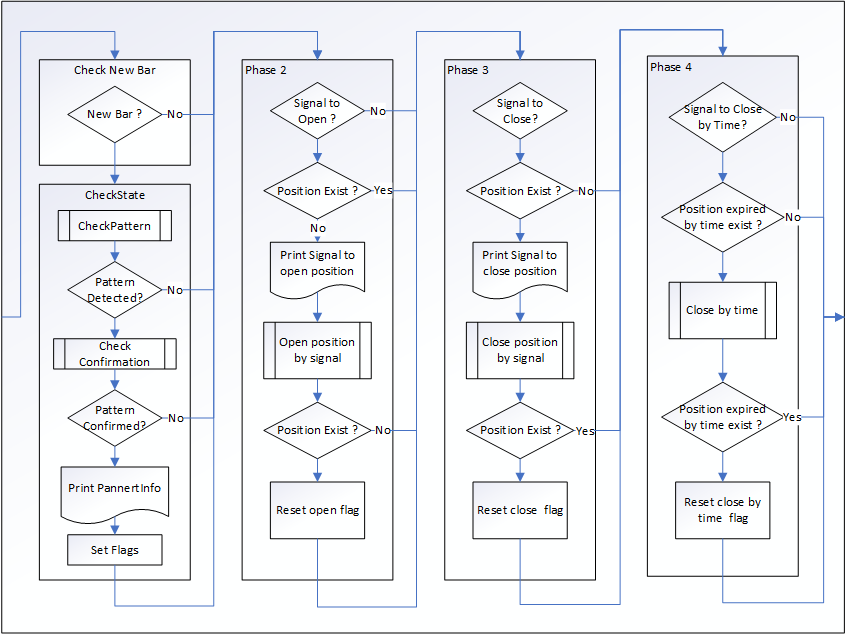
The flow diagram shows the four stages of the EA's work:
Stage 1:
- Check for a new bar.
If it is a new bar, check the current state: - Check candlestick formations for a pattern.
- If the pattern is found, check the pattern signal confirmation using the indicator.
- If the pattern signal is confirmed, display information about the found pattern in the journal and set the position open flags.
Stage 2:
- If there is a signal to open a position and such a position does not exist, display a message in the journal about the signal and open the position.
- If the position is open, reset the position open flag.
Stage 3:
- If there is a signal to close a position and such a position exists, print a message about the position close signal in the journal and close the position.
- If there is no position, reset the position close flag.
Step 4:
- If there is a signal to close a position after the lifetime has expired and such a position exists, close the position with the expired lifetime.
- If there is no position, reset the flag.
List of functions
Let's look at the list of EA functions and their brief description:
CheckState() — check the environment state:
- If the pattern is not found, return false.
- If an error is received when confirming the pattern with the indicator, return false.
- If the pattern is not confirmed by the indicator signal, the position open flag is reset.
- If we want to set closing after the position lifetime has expired, we need to set the corresponding flag.
PositionOpen() — opening a position:
- Trading environment data is updated.
- Depending on a signal and, accordingly, a position type, the StopLoss and TakeProfit installation prices are adjusted to acceptable values relative to the open price and server restrictions.
- A position is opened.
- If the position is not opened, report an error in the journal and return false.
- Return true upon successful opening.
CloseBySignal() — close a position by signal:
- If there is no close signal, return from the function.
- A type of position to be closed is determined by a signal direction.
- All EA-opened positions with the type determined by the signal direction are closed.
CloseByTime() — close positions with expired lifetime:
- If there are no EA-opened positions, return from the function.
- All EA-opened positions with expired lifetime are closed.
PositionExist() — return the flag of a position in the signal direction:
- A position type corresponding to the signal direction is determined.
- The flag of an EA-opened position with a type determined by the signal direction is returned.
PositionExpiredByTimeExist() — return the flag of a position with expired lifetime:
- The number of bars of the position lifetime is defined.
- The flag of the position is returned if its lifetime exceeds the number of bars specified in the settings.
BarsHold() — return the number of position lifetime bars:
- Determine and return the number of bars between the position open time and the current server time.
Open(), Close(), Low(), High() — return the corresponding bar price by index:
- The corresponding prices are requested from the specified bar.
- If prices are not received, the error flag is set.
- The obtained prices are returned.
MidPoint(), MidOpenClose() and AvgBody() return calculated average prices.
CheckPattern() — check if a pattern exists:
- The pattern search algorithm is executed in the Short direction.
- If the pattern is found, the flag of the found pattern is set and true is returned.
- The pattern search algorithm is executed in the Long direction.
- If the pattern is found, the flag of the found pattern is set and true is returned.
- If no patterns are found, an error flag is returned, which can be set to false in the functions for obtaining prices.
CheckConfirmation() — check and return the flag of the pattern signal being confirmed by the indicator signal.
CheckCloseSignal() — check conditions for the position close signal by indicator values. If the signal is present, set the position close flag.
Conclusion
All 28 EAs in the Experts\Free Robots folder adhere to the same logic. The only difference between them lies in the algorithms for searching candlestick patterns and in receiving data from four indicators to confirm pattern signals. Accordingly, any of these EAs can be used as a template for creating other EAs working on other candlestick patterns and receiving pattern confirmations from other indicators. All we need to do for that is change the logic of searching for patterns in Long and Short directions in the CheckPattern() function called from the CheckState() function, which is accessed at the first step of the EA operation:
//+------------------------------------------------------------------+
//| Returns true in case of successful pattern check                 |
//+------------------------------------------------------------------+
bool CheckPattern()
  {
   ExtPatternDetected=false;
//--- check if there is a pattern
   ExtSignalOpen=SIGNAL_NOT;
   ExtPatternInfo="\r\nPattern not detected";
   ExtDirection="";

//--- check 3 Black Crows
   if((Open(3)-Close(3)>AvgBody(1)) && // long black
      (Open(2)-Close(2)>AvgBody(1)) &&
      (Open(1)-Close(1)>AvgBody(1)) &&
      (MidPoint(2)<MidPoint(3))     && // lower midpoints
      (MidPoint(1)<MidPoint(2)))
     {
      ExtPatternDetected=true;
      ExtSignalOpen=SIGNAL_SELL;
      ExtPatternInfo="\r\n3 Black Crows detected";
      ExtDirection="Sell";
      return(true);
     }

//--- check 3 White Soldiers
   if((Close(3)-Open(3)>AvgBody(1)) && // long white
      (Close(2)-Open(2)>AvgBody(1)) &&
      (Close(1)-Open(1)>AvgBody(1)) &&
      (MidPoint(2)>MidPoint(3))     && // higher midpoints
      (MidPoint(1)>MidPoint(2)))
     {
      ExtPatternDetected=true;
      ExtSignalOpen=SIGNAL_BUY;
      ExtPatternInfo="\r\n3 White Soldiers detected";
      ExtDirection="Buy";
      return(true);
     }

//--- result of checking
   return(ExtCheckPassed);
  }
In order to change the confirmation indicator, we simply need to replace the indicator properties specified for, say, CCI with the necessary ones in the inputs:
//--- Input parameters
input int  InpAverBodyPeriod=12;    // period for calculating average candlestick size
input int  InpPeriodCCI     =37;    // CCI period
input ENUM_APPLIED_PRICE InpPrice=PRICE_CLOSE; // price type
In the OnInit() handler, replace the block of creating, say, CCI with the one for creating another indicator:
//+------------------------------------------------------------------+
//| Expert initialization function                                   |
//+------------------------------------------------------------------+
int OnInit()
  {
   Print("InpSL=", InpSL);
   Print("InpTP=", InpTP);
//--- set parameters for trading operations
   ExtTrade.SetDeviationInPoints(InpSlippage);    // slippage
   ExtTrade.SetExpertMagicNumber(InpMagicNumber); // Expert Advisor ID
   ExtTrade.LogLevel(LOG_LEVEL_ERRORS);           // logging level

   ExtAvgBodyPeriod=InpAverBodyPeriod;
//--- indicator initialization
   ExtIndicatorHandle=iCCI(_Symbol, _Period, InpPeriodCCI, InpPrice);
   if(ExtIndicatorHandle==INVALID_HANDLE)
     {
      Print("Error creating CCI indicator");
      return(INIT_FAILED);
     }
//--- OK
   return(INIT_SUCCEEDED);
  }
Next, in the CheckConfirmation() function of confirming signals and in the CheckCloseSignal() function of closing positions by indicator signals, use the data of a new indicator with the required values for confirming pattern Long and Short directions:
//+------------------------------------------------------------------+
//| Returns true in case of successful confirmation check            |
//+------------------------------------------------------------------+
bool CheckConfirmation()
  {
   ExtConfirmed=false;
//--- if there is no pattern, do not search for confirmation
   if(!ExtPatternDetected)
      return(true);

//--- get the value of the stochastic indicator to confirm the signal
   double signal=CCI(1);
   if(signal==EMPTY_VALUE)
     {
      //--- failed to get indicator value, check failed
      return(false);
     }

//--- check the Buy signal
   if(ExtSignalOpen==SIGNAL_BUY && (signal<-50))
     {
      ExtConfirmed=true;
      ExtPatternInfo+="\r\n   Confirmed: CCI<-50";
     }

//--- check the Sell signal
   if(ExtSignalOpen==SIGNAL_SELL && (signal>50))
     {
      ExtConfirmed=true;
      ExtPatternInfo+="\r\n   Confirmed: CCI>50";
     }

//--- successful completion of the check
   return(true);
  }
//+------------------------------------------------------------------+
//| Check if there is a signal to close                              |
//+------------------------------------------------------------------+
bool CheckCloseSignal()
  {
   ExtSignalClose=false;
//--- if there is a signal to enter the market, do not check the signal to close
   if(ExtSignalOpen!=SIGNAL_NOT)
      return(true);

//--- check if there is a signal to close a long position
   if(((CCI(1)<80) && (CCI(2)>80)) || ((CCI(1)<-80) && (CCI(2)>-80)))
     {
      //--- there is a signal to close a long position
      ExtSignalClose=CLOSE_LONG;
      ExtDirection="Long";
     }

//--- check if there is a signal to close a short position
   if(((CCI(1)>-80) && (CCI(2)<-80)) || ((CCI(1)>80) && (CCI(2)<80)))
     {
      //--- there is a signal to close a short position
      ExtSignalClose=CLOSE_SHORT;
      ExtDirection="Short";
     }

//--- successful completion of the check
   return(true);
  }
Thus, these EAs represent a good template for creating and testing custom algorithms for checking various candle patterns with confirmation from almost any suitable indicator.
Translated from Russian by MetaQuotes Ltd.
Original article: https://www.mql5.com/ru/articles/15479
- Free trading apps
- Over 8,000 signals for copying
- Economic news for exploring financial markets
You agree to website policy and terms of use
Compared, hence the question:
I didn't make these codes. That's why I wrote: If you notice any inconsistency, just add it in your code.
I understand that this is a part of MT5 update. I will add it to my code - it will be erased during the next terminal update.
I understand that this is a part of MT5 update. I will add it for myself - it will be erased during the next terminal update.
What prevents you from copying the Expert Advisor to a separate folder and changing everything there as you need?
They are training, just examples.
They are tutorials, just examples.
We learn from mistakes ... to make mistakes ;)
check Piercing Line
You are right - the conditions are not written symmetrically. I checked the original source (the book "Strategies of the World's Best Traders") - it says the same thing.
So, it is not our mistake, but it is necessary to make corrections. I will look in other sources, as it is written there. It seems that the author forgot to add a condition