
Building a Keltner Channel Indicator with Custom Canvas Graphics in MQL5
Introduction
In this article, we build a custom Keltner Channel indicator with advanced canvas graphics in MetaQuotes Language 5 (MQL5). The Keltner Channel calculates dynamic support and resistance levels using Moving Average (MA) and Average True Range (ATR) indicators, helping traders spot trend directions and potential breakouts. The topics we'll cover in this article include:
- Understanding the Keltner Channel Indicator
- Blueprint: Breaking Down the Indicator’s Architecture
- Implementation in MQL5
- Integrating Custom Canvas Graphics
- Backtesting the Keltner Channel Indicator
- Conclusion
Understanding the Keltner Channel Indicator
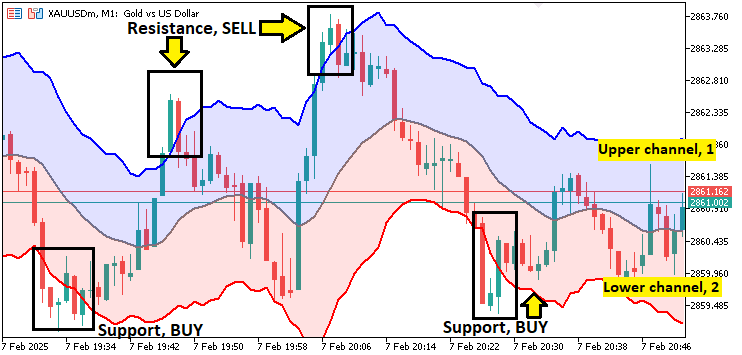
The Keltner Channel indicator is a volatility-based tool traders use that uses a Moving Average (MA) indicator to smooth out price data and the Average True Range (ATR) indicator to set dynamic support and resistance levels. It has 3 lines that form a channel. The middle line of the channel is a moving average, typically chosen to reflect the prevailing trend. At the same time, the upper and lower bands are generated by adding and subtracting a multiple of the ATR. This method allows the indicator to adjust to market volatility, making it easier to spot potential breakout points or areas where price action might reverse.
In practice, the indicator helps us identify key levels in the market where momentum may shift. When prices move outside the upper or lower bands, it signals an overextended market or a potential reversal, providing actionable insights for both trend-following and mean-reversion strategies. Its dynamic nature means that the indicator adapts to changes in volatility, ensuring that the support and resistance levels remain relevant as market conditions evolve. Here is a visual example.
Blueprint: Breaking Down the Indicator’s Architecture
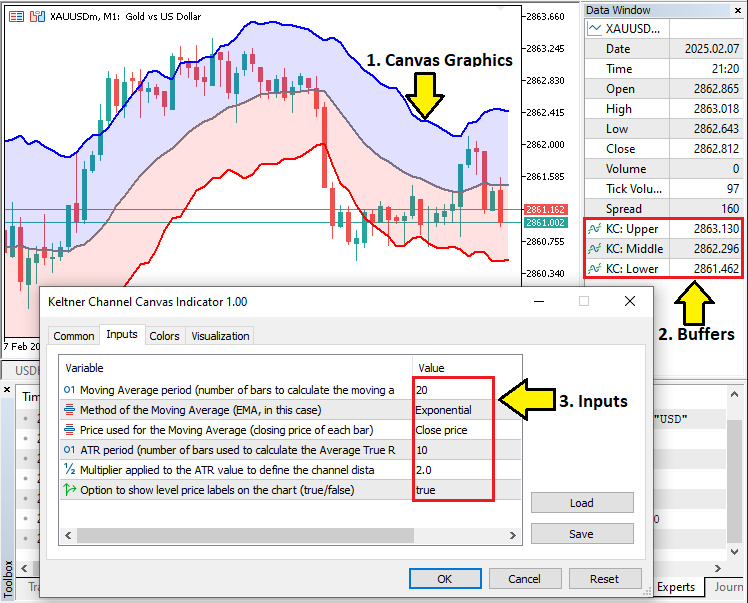
We will build the indicator’s architecture on a clear separation of responsibilities: input parameters, indicator buffers, and graphical properties. We will begin by defining the key inputs such as the moving average period, ATR period, and ATR multiplier, which will dictate the behavior of the indicator. We will then allocate three buffers to store the values for the upper channel, the middle line, and the lower channel. These buffers will be linked to graphical plots, with properties such as color, line width, and draw shift configured using MQL5’s built-in functions. Additionally, we will use the built-in functions to make the calculations, ensuring that the indicator adapts dynamically to market volatility.
Furthermore, we will incorporate error handling to ensure that both indicator handles are created successfully, providing a reliable foundation for the indicator’s calculations. Beyond the core indicator logic, we will integrate custom canvas graphics to enhance the visual presentation, including the creation of a bitmap label that overlays the chart. This modular design will not only simplify debugging and future modifications but also ensure that each component—from data calculation to visual output—operates in harmony, delivering a robust and visually appealing trading tool. In a nutshell, here are the three things we will achieve.
Implementation in MQL5
To create the indicator in MQL5, just open the MetaEditor, go to the Navigator, locate the Indicators folder, click on the "New" tab, and follow the prompts to create the file. Once it is created, in the coding environment, we will define the indicator properties and settings such as number of buffers, plots and individual line properties such as the color, width and label.
//+------------------------------------------------------------------+
//|                             Keltner Channel Canvas Indicator.mq5 |
//|                        Copyright 2025, Forex Algo-Trader, Allan. |
//|                                 "https://t.me/Forex_Algo_Trader" |
//+------------------------------------------------------------------+
#property copyright "Forex Algo-Trader, Allan"
#property link      "https://t.me/Forex_Algo_Trader"
#property version   "1.00"
#property description "Description: Keltner Channel Indicator"
#property indicator_chart_window

//+------------------------------------------------------------------+
//| Indicator properties and settings                                |
//+------------------------------------------------------------------+

// Define the number of buffers used for plotting data on the chart
#property indicator_buffers 3  // We will use 3 buffers: Upper Channel, Middle (MA) line, and Lower Channel

// Define the number of plots on the chart
#property indicator_plots   3  // We will plot 3 lines (Upper, Middle, and Lower)

//--- Plot settings for the Upper Keltner Channel line
#property indicator_type1   DRAW_LINE        // Draw the Upper Channel as a line
#property indicator_color1  clrBlue           // Set the color of the Upper Channel to Blue
#property indicator_label1  "Upper Keltner"   // Label of the Upper Channel line in the Data Window
#property indicator_width1  2                 // Set the line width of the Upper Channel to 2 pixels

//--- Plot settings for the Middle Keltner Channel line (the moving average)
#property indicator_type2   DRAW_LINE        // Draw the Middle (MA) Channel as a line
#property indicator_color2  clrGray           // Set the color of the Middle (MA) Channel to Gray
#property indicator_label2  "Middle Keltner"  // Label of the Middle (MA) line in the Data Window
#property indicator_width2  2                 // Set the line width of the Middle (MA) to 2 pixels

//--- Plot settings for the Lower Keltner Channel line
#property indicator_type3   DRAW_LINE        // Draw the Lower Channel as a line
#property indicator_color3  clrRed            // Set the color of the Lower Channel to Red
#property indicator_label3  "Lower Keltner"   // Label of the Lower Channel line in the Data Window
#property indicator_width3  2                 // Set the line width of the Lower Channel to 2 pixels
We begin by setting the indicator metadata, such as version, using the keyword #property. Next, we allocate three indicator buffers using the property indicator_buffers, which will store and manage the calculated values for the "Upper Channel", "Middle Moving Average (MA)", and "Lower Channel". We also set the "indicator_plots" to 3, defining that three separate graphical plots will be drawn on the chart. For each of these, we configure specific visualization properties:
- Upper Keltner Channel: We assign DRAW_LINE macro as its "indicator type", meaning it will be drawn as a continuous line. The color is set to "Blue" using clrBlue, and the label "Upper Keltner" helps identify it in the Data Window. We set the line width to 2 pixels for better visibility.
- Middle Keltner Channel (Moving Average): Similarly, we set its type to "DRAW_LINE", use a "Gray" color, and assign the label "Middle Keltner". This line represents the central moving average, which serves as the core reference for the upper and lower bands.
- Lower Keltner Channel: This line is also defined as DRAW_LINE, with a "Red" color to differentiate it from the others. The label "Lower Keltner" is assigned, and the line width is set to 2 pixels.
With the properties, we can then move on to defining the input parameters.
//+------------------------------------------------------------------+
//| Input parameters for the indicator                               |
//+------------------------------------------------------------------+

//--- Moving Average parameters
input int    maPeriod=20;                 // Moving Average period (number of bars to calculate the moving average)
input ENUM_MA_METHOD maMethod=MODE_EMA;   // Method of the Moving Average (EMA, in this case)
input ENUM_APPLIED_PRICE maPrice=PRICE_CLOSE; // Price used for the Moving Average (closing price of each bar)

//--- ATR parameters
input int    atrPeriod=10;                // ATR period (number of bars used to calculate the Average True Range)
input double atrMultiplier=2.0;           // Multiplier applied to the ATR value to define the channel distance (upper and lower limits)
input bool   showPriceLabel=true;         // Option to show level price labels on the chart (true/false)
Here, we define the input properties. For the moving average, we set "maPeriod" (default 20) to define the number of bars used. The "maMethod", of data type ENUM_MA_METHOD is set to "MODE_EMA", specifying an exponential moving average, and "maPrice", of data type ENUM_APPLIED_PRICE, is set to "PRICE_CLOSE", meaning calculations are based on closing prices.
For "ATR", "atrPeriod" (default 10) determines how many bars are used to compute volatility, while "atrMultiplier" (default 2.0) sets the distance of the upper and lower bands from the moving average. Lastly, "showPriceLabel" (default true) controls whether price labels appear on the chart. These settings will ensure flexibility in adapting the indicator to different market conditions. Finally, we need to define the indicator handles that we will be using.
//+------------------------------------------------------------------+
//| Indicator handle declarations                                    |
//+------------------------------------------------------------------+

//--- Indicator handles for the Moving Average and ATR
int    maHandle = INVALID_HANDLE;   // Handle for Moving Average (used to store the result of iMA)
int    atrHandle = INVALID_HANDLE;  // Handle for ATR (used to store the result of iATR)

//+------------------------------------------------------------------+
//| Indicator buffers (arrays for storing calculated values)         |
//+------------------------------------------------------------------+

//--- Buffers for storing the calculated indicator values
double upperChannelBuffer[];  // Buffer to store the Upper Channel values (Moving Average + ATR * Multiplier)
double movingAverageBuffer[]; // Buffer to store the Moving Average values (middle of the channel)
double lowerChannelBuffer[];  // Buffer to store the Lower Channel values (Moving Average - ATR * Multiplier)

//+------------------------------------------------------------------+
//| Global variables for the parameter values                        |
//+------------------------------------------------------------------+

//--- These variables store the actual input parameter values, if necessary for any further use or calculations
int    maPeriodValue;      // Store the Moving Average period value
int    atrPeriodValue;     // Store the ATR period value
double atrMultiplierValue; // Store the ATR multiplier value

//+------------------------------------------------------------------+
Here, we declare the indicator handles, buffers, and some global variables that we will require for the Keltner Channel calculations. The handles store references to the indicators, allowing us to retrieve their values dynamically. We initialize "maHandle" and "atrHandle" to INVALID_HANDLE, ensuring proper handle management before assignment.
Next, we define the indicator buffers, which are arrays used to store calculated values for plotting. "upperChannelBuffer" holds the upper boundary values, "movingAverageBuffer" stores the middle MA line, and "lowerChannelBuffer" contains the lower boundary. These buffers will enable smooth visualization of the Keltner Channel on the chart. Finally, we introduce the global variables to store input parameters for further use. "maPeriodValue" and "atrPeriodValue" hold the user-defined periods for "MA" and "ATR", while "atrMultiplierValue" stores the multiplier used to determine the channel width. We can now graduate to the initialization event handler, where we do all the necessary indicator plots and mapping as well as the initialization of indicator handles.
//+------------------------------------------------------------------+
//| Custom indicator initialization function                         |
//+------------------------------------------------------------------+
int OnInit()
{
   //--- Indicator buffers mapping
   // Indicator buffers are used to store calculated indicator values.
   // We link each buffer to a graphical plot for visual representation.
   SetIndexBuffer(0, upperChannelBuffer, INDICATOR_DATA);  // Buffer for the upper channel line
   SetIndexBuffer(1, movingAverageBuffer, INDICATOR_DATA); // Buffer for the middle (moving average) line
   SetIndexBuffer(2, lowerChannelBuffer, INDICATOR_DATA);  // Buffer for the lower channel line

   //--- Set the starting position for drawing each plot
   // The drawing for each line will only begin after a certain number of bars have passed
   // This is to avoid showing incomplete calculations at the start
   PlotIndexSetInteger(0, PLOT_DRAW_BEGIN, maPeriod + 1); // Start drawing Upper Channel after 'maPeriod + 1' bars
   PlotIndexSetInteger(1, PLOT_DRAW_BEGIN, maPeriod + 1); // Start drawing Middle (MA) after 'maPeriod + 1' bars
   PlotIndexSetInteger(2, PLOT_DRAW_BEGIN, maPeriod + 1); // Start drawing Lower Channel after 'maPeriod + 1' bars

   //--- Set an offset for the plots
   // This shifts the plotted lines by 1 bar to the right, ensuring that the values are aligned properly
   PlotIndexSetInteger(0, PLOT_SHIFT, 1); // Shift the Upper Channel by 1 bar to the right
   PlotIndexSetInteger(1, PLOT_SHIFT, 1); // Shift the Middle (MA) by 1 bar to the right
   PlotIndexSetInteger(2, PLOT_SHIFT, 1); // Shift the Lower Channel by 1 bar to the right

   //--- Define an "empty value" for each plot
   // Any buffer value set to this value will not be drawn on the chart
   // This is useful for gaps where there are no valid indicator values
   PlotIndexSetDouble(0, PLOT_EMPTY_VALUE, 0.0); // Empty value for Upper Channel
   PlotIndexSetDouble(1, PLOT_EMPTY_VALUE, 0.0); // Empty value for Middle (MA)
   PlotIndexSetDouble(2, PLOT_EMPTY_VALUE, 0.0); // Empty value for Lower Channel

   //--- Set the short name of the indicator (displayed in the chart and Data Window)
   // This sets the name of the indicator that appears on the chart
   IndicatorSetString(INDICATOR_SHORTNAME, "Keltner Channel");

   //--- Customize the label for each buffer in the Data Window
   // This allows for better identification of the individual plots in the Data Window
   string short_name = "KC:"; // Shortened name of the indicator
   PlotIndexSetString(0, PLOT_LABEL, short_name + " Upper");  // Label for the Upper Channel
   PlotIndexSetString(1, PLOT_LABEL, short_name + " Middle"); // Label for the Middle (MA)
   PlotIndexSetString(2, PLOT_LABEL, short_name + " Lower");  // Label for the Lower Channel

   //--- Set the number of decimal places for the indicator values
   // _Digits is the number of decimal places used in the current chart symbol
   IndicatorSetInteger(INDICATOR_DIGITS, _Digits); // Ensures indicator values match the chart's price format

   //--- Create indicators (Moving Average and ATR)
   // These are handles (IDs) for the built-in indicators used to calculate the Keltner Channel
   // iMA = Moving Average (EMA in this case), iATR = Average True Range
   maHandle = iMA(NULL, 0, maPeriod, 0, maMethod, maPrice); // Create MA handle (NULL = current chart, 0 = current timeframe)
   atrHandle = iATR(NULL, 0, atrPeriod); // Create ATR handle (NULL = current chart, 0 = current timeframe)

   //--- Error handling for indicator creation
   // Check if the handle for the Moving Average (MA) is valid
   if(maHandle == INVALID_HANDLE)
     {
      // If the handle is invalid, print an error message and return failure code
      Print("UNABLE TO CREATE THE MA HANDLE REVERTING NOW!");
      return (INIT_FAILED); // Initialization failed
     }

   // Check if the handle for the ATR is valid
   if(atrHandle == INVALID_HANDLE)
     {
      // If the handle is invalid, print an error message and return failure code
      Print("UNABLE TO CREATE THE ATR HANDLE REVERTING NOW!");
      return (INIT_FAILED); // Initialization failed
     }

   //--- Return success code
   // If everything works correctly, we return INIT_SUCCEEDED to signal successful initialization
   return(INIT_SUCCEEDED);
}
//+------------------------------------------------------------------+
Here, we initialize the Keltner Channel indicator on the OnInit event handler by configuring buffers, plots, offsets, and handles to ensure correct visualization and calculation. We start by linking each indicator buffer to its corresponding graphical plot using the SetIndexBuffer function, ensuring that the "Upper Channel", "Middle Moving Average (MA) Line", and "Lower Channel" are properly displayed.
Next, we define the drawing behavior using the PlotIndexSetInteger function. We set the drawing to begin only after "maPeriod + 1" bars to prevent incomplete calculations from appearing. Additionally, we apply a rightward shift using PLOT_SHIFT to align the plotted values correctly. To handle missing data, we assign an empty value of "0.0" to each buffer using the PlotIndexSetDouble function.
We then configure the display settings. The indicator's name is set using the IndicatorSetString function, while PlotIndexSetString assigns labels for each line in the "Data Window". The decimal precision of indicator values is synchronized with the chart’s price format using the "IndicatorSetInteger" function. Finally, we create the indicator handles using the iMA and iATR functions. If the creation of any handle fails, we handle errors by printing an error message using the Print function and returning INIT_FAILED. If everything is successful, INIT_SUCCEEDED is returned, completing the initialization process. We then can move on to the core event handler, which handles the indicator calculations.
//+------------------------------------------------------------------+
//| Custom indicator iteration function                              |
//+------------------------------------------------------------------+
int OnCalculate(const int rates_total,             // Total number of bars in the price series
                const int prev_calculated,        // Number of previously calculated bars
                const datetime &time[],           // Array of time values for each bar
                const double &open[],             // Array of open prices for each bar
                const double &high[],             // Array of high prices for each bar
                const double &low[],              // Array of low prices for each bar
                const double &close[],            // Array of close prices for each bar
                const long &tick_volume[],        // Array of tick volumes for each bar
                const long &volume[],             // Array of trade volumes for each bar
                const int &spread[])              // Array of spreads for each bar
{
   //--- Check if this is the first time the indicator is being calculated
   if(prev_calculated == 0) // If no previous bars were calculated, it means this is the first calculation
     {
      //--- Initialize indicator buffers (upper, middle, and lower) with zeros
      ArrayFill(upperChannelBuffer, 0, rates_total, 0);   // Fill the entire upper channel buffer with 0s
      ArrayFill(movingAverageBuffer, 0, rates_total, 0);  // Fill the moving average buffer with 0s
      ArrayFill(lowerChannelBuffer, 0, rates_total, 0);   // Fill the lower channel buffer with 0s

      //--- Copy Exponential Moving Average (EMA) values into the moving average buffer
      // This function requests 'rates_total' values from the MA indicator (maHandle) and copies them into movingAverageBuffer
      if(CopyBuffer(maHandle, 0, 0, rates_total, movingAverageBuffer) < 0)
         return(0); // If unable to copy data, stop execution and return 0

      //--- Copy Average True Range (ATR) values into a temporary array called atrValues
      double atrValues[];
      if(CopyBuffer(atrHandle, 0, 0, rates_total, atrValues) < 0)
         return(0); // If unable to copy ATR data, stop execution and return 0

      //--- Define the starting bar for calculations
      // We need to make sure we have enough data to calculate both the MA and ATR, so we start after the longest required period.
      int startBar = MathMax(maPeriod, atrPeriod) + 1; // Ensure sufficient bars for both EMA and ATR calculations

      //--- Loop from startBar to the total number of bars (rates_total)
      for(int i = startBar; i < rates_total; i++)
        {
         // Calculate the upper and lower channel boundaries for each bar
         upperChannelBuffer[i] = movingAverageBuffer[i] + atrMultiplier * atrValues[i]; // Upper channel = EMA + ATR * Multiplier
         lowerChannelBuffer[i] = movingAverageBuffer[i] - atrMultiplier * atrValues[i]; // Lower channel = EMA - ATR * Multiplier
        }

      //--- Calculation is complete, so we return the total number of rates (bars) calculated
      return(rates_total);
     }
}
Here, we implement the core calculation logic of the Keltner Channel indicator within the OnCalculate event handler, a function that iterates over price data to compute and update the indicator buffers. First, we check if this is the first calculation by evaluating "prev_calculated". If it's "0", we initialize the "Upper Channel", "Middle Moving Average (MA)", and "Lower Channel" buffers using the ArrayFill function, ensuring all values start at zero. Next, we populate the "movingAverageBuffer" with the MA values using the CopyBuffer function. If copying fails, we stop execution by returning "0". Similarly, we retrieve the ATR values into the temporary "atrValues" array.
To ensure we have enough data for both MA and ATR, we determine the starting bar using the MathMax function, which returns the maximum value between the indicator periods, and add 1 bar to prevent considering the current incomplete bar. We then use a for loop to iterate through each bar from "startBar" to "rates_total", computing the "Upper" and "Lower" channel boundaries using the formula:
- "UpperChannel = Moving Average + (ATR * Multiplier)"
- "LowerChannel = Moving Average - (ATR * Multiplier)"
Finally, we return "rates_total", indicating the number of calculated bars. If it is not the first indicator run, we simply update the values of the recent bars via recalculation.
//--- If this is NOT the first calculation, update only the most recent bars
// This prevents re-calculating all bars, which improves performance
int startBar = prev_calculated - 2; // Start 2 bars back to ensure smooth updating

//--- Loop through the last few bars that need to be updated
for(int i = startBar; i < rates_total; i++)
  {
   //--- Calculate reverse index to access recent bars from the end
   int reverseIndex = rates_total - i; // Reverse indexing ensures we are looking at the most recent bars first

   //--- Copy the latest Exponential Moving Average (EMA) value for this specific bar
   double emaValue[];
   if(CopyBuffer(maHandle, 0, reverseIndex, 1, emaValue) < 0)
      return(prev_calculated); // If unable to copy, return the previous calculated value to avoid recalculation

   //--- Copy the latest Average True Range (ATR) value for this specific bar
   double atrValue[];
   if(CopyBuffer(atrHandle, 0, reverseIndex, 1, atrValue) < 0)
      return(prev_calculated); // If unable to copy, return the previous calculated value to avoid recalculation

   //--- Update the indicator buffers with new values for the current bar
   movingAverageBuffer[i] = emaValue[0]; // Update the moving average buffer for this bar
   upperChannelBuffer[i] = emaValue[0] + atrMultiplier * atrValue[0]; // Calculate the upper channel boundary
   lowerChannelBuffer[i] = emaValue[0] - atrMultiplier * atrValue[0]; // Calculate the lower channel boundary
  }

//--- Return the total number of calculated rates (bars)
return(rates_total); // This informs MQL5 that all rates up to 'rates_total' have been successfully calculated
Here, we optimize performance by updating only the most recent bars instead of recalculating the entire indicator on every tick. If this is not the first calculation, we define "startBar" as "prev_calculated - 2", ensuring we update the last few bars while maintaining continuity. This minimizes unnecessary computations, as we already have the data for the previous bars on the chart.
We then iterate from "startBar" to "rates_total" using a for loop. To prioritize recent bars, we compute "reverseIndex = rates_total - i", allowing us to fetch the latest data first. For each bar, we copy the most recent MA value into "emaValue" using the CopyBuffer function. If data retrieval fails, we return "prev_calculated", avoiding redundant calculations. The same logic applies to ATR, storing its value in "atrValue". Once retrieved, we update the buffers:
- "movingAverageBuffer[i] = emaValue[0];" assigns the EMA to the middle line.
- "upperChannelBuffer[i] = emaValue[0] + atrMultiplier * atrValue[0];" calculates the upper boundary.
- "lowerChannelBuffer[i] = emaValue[0] - atrMultiplier * atrValue[0];" calculates the lower boundary.
Finally, we return "rates_total", signaling that all necessary bars have been processed. Upon running the program, we have the following output.
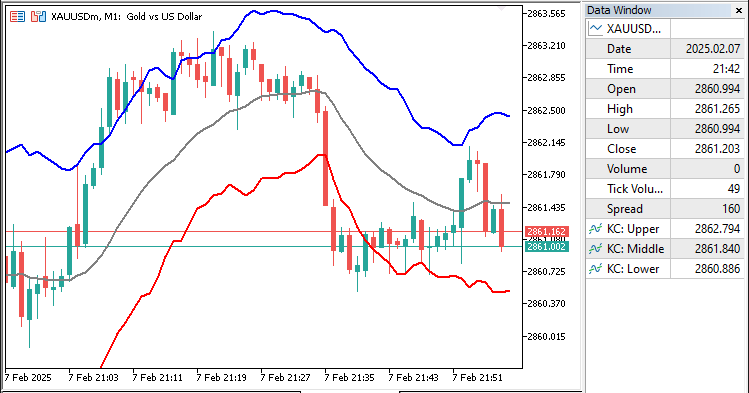
From the image, we can see that we have the indicator lines mapped onto the chart correctly. What now remains is plotting the channels, and for that, we will need the canvas feature. This is handled in the next section.
Integrating Custom Canvas Graphics
To integrate the canvas feature for graphics, we will need to include the necessary canvas class files so we can use the already existing in-built structure. We achieve this via the following logic.
#include <Canvas/Canvas.mqh>
CCanvas obj_Canvas;
We include the "Canvas.mqh" library using the #include keyword, which provides functionalities for graphical rendering on the chart. This library will enable us to draw custom elements, such as indicator visuals and annotations, directly on the chart window. We then declare "obj_Canvas" as an instance of the CCanvas class. This object will be used to interact with the canvas, allowing us to create, modify, and manage graphical elements dynamically. The CCanvas class will provide methods for drawing shapes, lines, and text, enhancing the visual representation of the indicator. Next, we will need to get the chart properties such as scale since we will be pointing the chart with dynamic shapes. We do this on the global scope.
int chart_width         = (int)ChartGetInteger(0, CHART_WIDTH_IN_PIXELS);
int chart_height        = (int)ChartGetInteger(0, CHART_HEIGHT_IN_PIXELS);
int chart_scale         = (int)ChartGetInteger(0, CHART_SCALE);
int chart_first_vis_bar = (int)ChartGetInteger(0, CHART_FIRST_VISIBLE_BAR);
int chart_vis_bars      = (int)ChartGetInteger(0, CHART_VISIBLE_BARS);
double chart_prcmin     = ChartGetDouble(0, CHART_PRICE_MIN, 0);
double chart_prcmax     = ChartGetDouble(0, CHART_PRICE_MAX, 0);
We use various ChartGetInteger and ChartGetDouble functions to retrieve different properties of the current chart window for further calculations or graphical placement of elements. First, we retrieve the chart's width using "ChartGetInteger", with the parameter CHART_WIDTH_IN_PIXELS, which returns the width of the chart in pixels. We store this value in the "chart_width" variable. Similarly, we retrieve the height of the chart with "ChartGetInteger" and CHART_HEIGHT_IN_PIXELS, storing it in the "chart_height" variable.
Next, we use the "CHART_SCALE" parameter to retrieve the scale of the chart, storing this value in "chart_scale". This represents the zoom level of the chart. We also retrieve the index of the first visible bar using "CHART_FIRST_VISIBLE_BAR", storing this in "chart_first_vis_bar", which is useful for calculations based on the visible chart area. To calculate how many bars are visible in the chart window, we use the CHART_VISIBLE_BARS parameter, storing the result in "chart_vis_bars". We "typecast" all the values into integers.
Finally, we use the "ChartGetDouble" function to obtain the minimum and maximum price values visible on the chart with "CHART_PRICE_MIN" and CHART_PRICE_MAX, respectively. These values are stored in the "chart_prcmin" and "chart_prcmax" variables, which provide the price range currently displayed on the chart. Armed with these variables, we will need to create a bitmap label on the chart on initialization, so we can have our plot area ready.
// Create a obj_Canvas bitmap label for custom graphics on the chart
obj_Canvas.CreateBitmapLabel(0, 0, short_name, 0, 0, chart_width, chart_height, COLOR_FORMAT_ARGB_NORMALIZE);
Here, we use the "obj_Canvas.CreateBitmapLabel" function to create a custom bitmap label on the chart. It takes parameters for positioning ("0", "0"), content ("short_name"), size ("0", "0" for auto-sizing), and chart dimensions ("chart_width", "chart_height"). The color format is set to COLOR_FORMAT_ARGB_NORMALIZE, enabling customized transparency and color. With the label, we can now draw the shapes. However, we will need some helper functions that will convert the chart and candle coordinates to price and bar indices.
//+------------------------------------------------------------------+
//| Converts the chart scale property to bar width/spacing           |
//+------------------------------------------------------------------+
int GetBarWidth(int chartScale)
{
   // The width of each bar in pixels is determined using 2^chartScale.
   // This calculation is based on the MQL5 chart scale property, where larger chartScale values mean wider bars.
   return (int)pow(2, chartScale); // Example: chartScale = 3 -> bar width = 2^3 = 8 pixels
}
//+------------------------------------------------------------------+
//| Converts the bar index (as series) to x-coordinate in pixels     |
//+------------------------------------------------------------------+
int GetXCoordinateFromBarIndex(int barIndex)
{
   // The chart starts from the first visible bar, and each bar has a fixed width.
   // To calculate the x-coordinate, we calculate the distance from the first visible bar to the given barIndex.
   // Each bar is shifted by 'bar width' pixels, and we subtract 1 to account for pixel alignment.
   return (chart_first_vis_bar - barIndex) * GetBarWidth(chart_scale) - 1;
}
//+------------------------------------------------------------------+
//| Converts the price to y-coordinate in pixels                     |
//+------------------------------------------------------------------+
int GetYCoordinateFromPrice(double price)
{
   // To avoid division by zero, we check if chart_prcmax equals chart_prcmin.
   // If so, it means that all prices on the chart are the same, so we avoid dividing by zero.
   if(chart_prcmax - chart_prcmin == 0.0)
      return 0; // Return 0 to avoid undefined behavior

   // Calculate the relative position of the price in relation to the minimum and maximum price on the chart.
   // We then convert this to pixel coordinates based on the total height of the chart.
   return (int)round(chart_height * (chart_prcmax - price) / (chart_prcmax - chart_prcmin) - 1);
}
//+------------------------------------------------------------------+
//| Converts x-coordinate in pixels to bar index (as series)         |
//+------------------------------------------------------------------+
int GetBarIndexFromXCoordinate(int xCoordinate)
{
   // Get the width of one bar in pixels
   int barWidth = GetBarWidth(chart_scale);

   // Check to avoid division by zero in case barWidth somehow equals 0
   if(barWidth == 0)
      return 0; // Return 0 to prevent errors

   // Calculate the bar index using the x-coordinate position
   // This determines how many bar widths fit into the x-coordinate and converts it to a bar index
   return chart_first_vis_bar - (xCoordinate + barWidth / 2) / barWidth;
}
//+------------------------------------------------------------------+
//| Converts y-coordinate in pixels to price                         |
//+------------------------------------------------------------------+
double GetPriceFromYCoordinate(int yCoordinate)
{
   // If the chart height is 0, division by zero would occur, so we avoid it.
   if(chart_height == 0)
      return 0; // Return 0 to prevent errors

   // Calculate the price corresponding to the y-coordinate
   // The y-coordinate is converted relative to the total height of the chart
   return chart_prcmax - yCoordinate * (chart_prcmax - chart_prcmin) / chart_height;
}
We create functions to map between chart data and pixel-based coordinates. First, in the "GetBarWidth" function, we calculate the width of each bar in pixels by using the chart's scale and applying the formula 2 raised to the power of the chart scale. This will help us adjust the bar width based on the scale of the chart. To do this, we use the pow function to compute powers of 2.
Next, in the "GetXCoordinateFromBarIndex" function, we convert a bar index into an x-coordinate in pixels. This is done by calculating the distance between the first visible bar and the specified bar index. We multiply this by the bar width and subtract 1 to account for pixel alignment. For the y-coordinate, in the "GetYCoordinateFromPrice" function, we calculate the relative position of a price on the chart. We determine where the price lies between the minimum and maximum chart prices ("chart_prcmin" and "chart_prcmax"), then scale this relative value to fit within the height of the chart. We take care to prevent division by zero if the price range is zero.
Similarly, the "GetBarIndexFromXCoordinate" function works in reverse. We take an x-coordinate and convert it back into a bar index by calculating how many bar widths fit into the x-coordinate. This allows us to identify the bar corresponding to a given position on the chart. Lastly, in the "GetPriceFromYCoordinate" function, we convert a y-coordinate back to a price by using the relative position of the y-coordinate within the chart's price range. We ensure that division by zero is avoided if the chart height is zero.
Together, these functions provide us with the ability to translate between chart pixel coordinates and data values, enabling us to place custom graphics on the chart with precise alignment to the price and bars. Thus, we can now use the functions to create a common function, which we will use to draw the necessary shapes between two given lines of a channel.
//+------------------------------------------------------------------+
//| Fill the area between two indicator lines                        |
//+------------------------------------------------------------------+
void DrawFilledArea(double &upperSeries[], double &lowerSeries[], color upperColor, color lowerColor, uchar transparency = 255, int shift = 0)
{
   int startBar  = chart_first_vis_bar;      // The first bar that is visible on the chart
   int totalBars = chart_vis_bars + shift;   // The total number of visible bars plus the shift
   uint upperARGB = ColorToARGB(upperColor, transparency); // Convert the color to ARGB with transparency
   uint lowerARGB = ColorToARGB(lowerColor, transparency); // Convert the color to ARGB with transparency
   int seriesLimit = fmin(ArraySize(upperSeries), ArraySize(lowerSeries)); // Ensure series limits do not exceed array size
   int prevX = 0, prevYUpper = 0, prevYLower = 0; // Variables to store the previous bar's x, upper y, and lower y coordinates

   for(int i = 0; i < totalBars; i++)
     {
      int barPosition = startBar - i;             // Current bar position relative to start bar
      int shiftedBarPosition = startBar - i + shift; // Apply the shift to the bar position
      int barIndex = seriesLimit - 1 - shiftedBarPosition; // Calculate the series index for the bar

      // Ensure the bar index is within the valid range of the array
      if(barIndex < 0 || barIndex >= seriesLimit || barIndex - 1 < 0)
         continue; // Skip this bar if the index is out of bounds

      // Check if the series contains valid data (not EMPTY_VALUE)
      if(upperSeries[barIndex] == EMPTY_VALUE || lowerSeries[barIndex] == EMPTY_VALUE || shiftedBarPosition >= seriesLimit)
         continue; // Skip this bar if the values are invalid or if the position exceeds the series limit

      int xCoordinate  = GetXCoordinateFromBarIndex(barPosition); // Calculate x-coordinate of this bar
      int yUpper = GetYCoordinateFromPrice(upperSeries[barIndex]); // Calculate y-coordinate for upper line
      int yLower = GetYCoordinateFromPrice(lowerSeries[barIndex]); // Calculate y-coordinate for lower line
      uint currentARGB = upperSeries[barIndex] < lowerSeries[barIndex] ? lowerARGB : upperARGB; // Determine fill color based on which line is higher

      // If previous values are valid, draw triangles between the previous bar and the current bar
      if(i > 0 && upperSeries[barIndex - 1] != EMPTY_VALUE && lowerSeries[barIndex - 1] != EMPTY_VALUE)
        {
         if(prevYUpper != prevYLower) // Draw first triangle between the upper and lower parts of the two consecutive bars
            obj_Canvas.FillTriangle(prevX, prevYUpper, prevX, prevYLower, xCoordinate, yUpper, currentARGB);
         if(yUpper != yLower) // Draw the second triangle to complete the fill area
            obj_Canvas.FillTriangle(prevX, prevYLower, xCoordinate, yUpper, xCoordinate, yLower, currentARGB);
        }

      prevX  = xCoordinate; // Store the x-coordinate for the next iteration
      prevYUpper = yUpper;  // Store the y-coordinate of the upper series
      prevYLower = yLower;  // Store the y-coordinate of the lower series
     }
}
We declare a void function "DrawFilledArea", that will allow filling the area between two indicator lines on the chart. First, we define the visible bars on the chart with an optional shift ("shift") to adjust the starting point. We also convert the colors ("upperColor" and "lowerColor") to ARGB format, including transparency, using the ColorToARGB function. We then determine the limit of the series using the fmin function to avoid exceeding the array sizes of the upper and lower indicator data series ("upperSeries" and "lowerSeries"). We initialize variables to store the previous bar's coordinates for the upper and lower lines, which are used to draw the area.
Next, we loop through the visible bars and calculate the position of each bar on the x-axis using the "GetXCoordinateFromBarIndex" function. The y-coordinates of the upper and lower lines are calculated using the "GetYCoordinateFromPrice" function, based on the values in "upperSeries" and "lowerSeries". We check which line is higher and assign the appropriate color for the fill.
If the previous bar contains valid data, we use "obj_Canvas.FillTriangle" to fill the area between the two lines. We draw two triangles for each pair of bars: one triangle between the upper and lower lines, and another to complete the filled area. The triangles are drawn with the color determined earlier. We use triangles because they precisely connect irregular points between lines, especially when the lines are not perfectly aligned with the grid. This method ensures smoother fills and better rendering efficiency compared to rectangles. Here is an illustration.
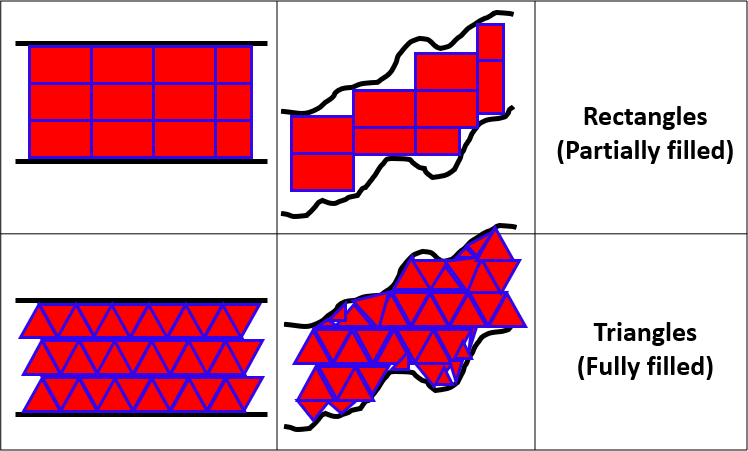
Finally, we update the previous x and y coordinates for the next iteration, ensuring that the area is continuously filled between the lines for each visible bar. Armed with the function, we graduate to using the function to draw the number of the necessary channels on the chart, with the respective colors as requested.
//+------------------------------------------------------------------+
//| Custom indicator redraw function                                 |
//+------------------------------------------------------------------+
void RedrawChart(void)
{
   uint defaultColor = 0; // Default color used to clear the canvas
   color colorUp = (color)PlotIndexGetInteger(0, PLOT_LINE_COLOR, 0); // Color of the upper indicator line
   color colorMid = (color)PlotIndexGetInteger(1, PLOT_LINE_COLOR, 0); // Color of the mid indicator line
   color colorDown = (color)PlotIndexGetInteger(2, PLOT_LINE_COLOR, 0); // Color of the lower indicator line

   //--- Clear the canvas by filling it with the default color
   obj_Canvas.Erase(defaultColor);

   //--- Draw the area between the upper channel and the moving average
   // This fills the area between the upper channel (upperChannelBuffer) and the moving average (movingAverageBuffer)
   DrawFilledArea(upperChannelBuffer, movingAverageBuffer, colorUp, colorMid, 128, 1);

   //--- Draw the area between the moving average and the lower channel
   // This fills the area between the moving average (movingAverageBuffer) and the lower channel (lowerChannelBuffer)
   DrawFilledArea(movingAverageBuffer, lowerChannelBuffer, colorDown, colorMid, 128, 1);

   //--- Update the canvas to reflect the new drawing
   obj_Canvas.Update();
}
We declare the "RedrawChart" function, and we first define default colors and then retrieve the line colors for the upper, middle, and lower channels from the indicator's properties. We clear the canvas with the default color and use the "DrawFilledArea" function to fill the areas between the upper channel and moving average, and between the moving average and lower channel, using the respective colors. Finally, we update the canvas to reflect the changes, ensuring the chart is redrawn with the new fills. We can now call the function on the OnCalculate event handler to draw the canvas.
RedrawChart(); // This function clears and re-draws the filled areas between the indicator lines
Since we have an indicator channel object, we need to delete it once we get rid of the indicator.
//+------------------------------------------------------------------+
//| Custom indicator deinitialization function                       |
//+------------------------------------------------------------------+
void OnDeinit(const int reason){
   obj_Canvas.Destroy();
   ChartRedraw();
}
In the OnDeinit event handler, we use the "obj_Canvas.Destroy" method to clean up and remove any custom drawing objects on the chart when the indicator is removed. Finally, we call the ChartRedraw function to refresh and redraw the chart, ensuring the custom graphics are cleared from the display. Once we run the program, we have the following outcome.
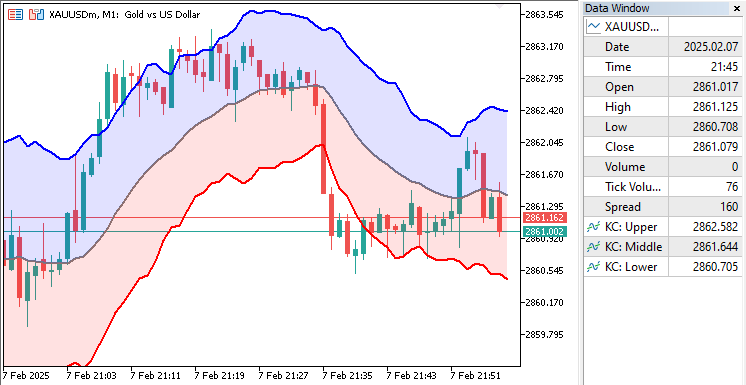
From the visualization, we can see that we achieved our objective, of creating the advanced Keltner channel indicator with the canvas graphics. We now need to backtest the indicator to ensure it is working correctly. This is done in the next section.
Backtesting the Keltner Channel Indicator
During backtesting, we observed that when the chart dimensions were changed, the channel display would hang and not update to the recent chart ordinates. Here is what we mean.
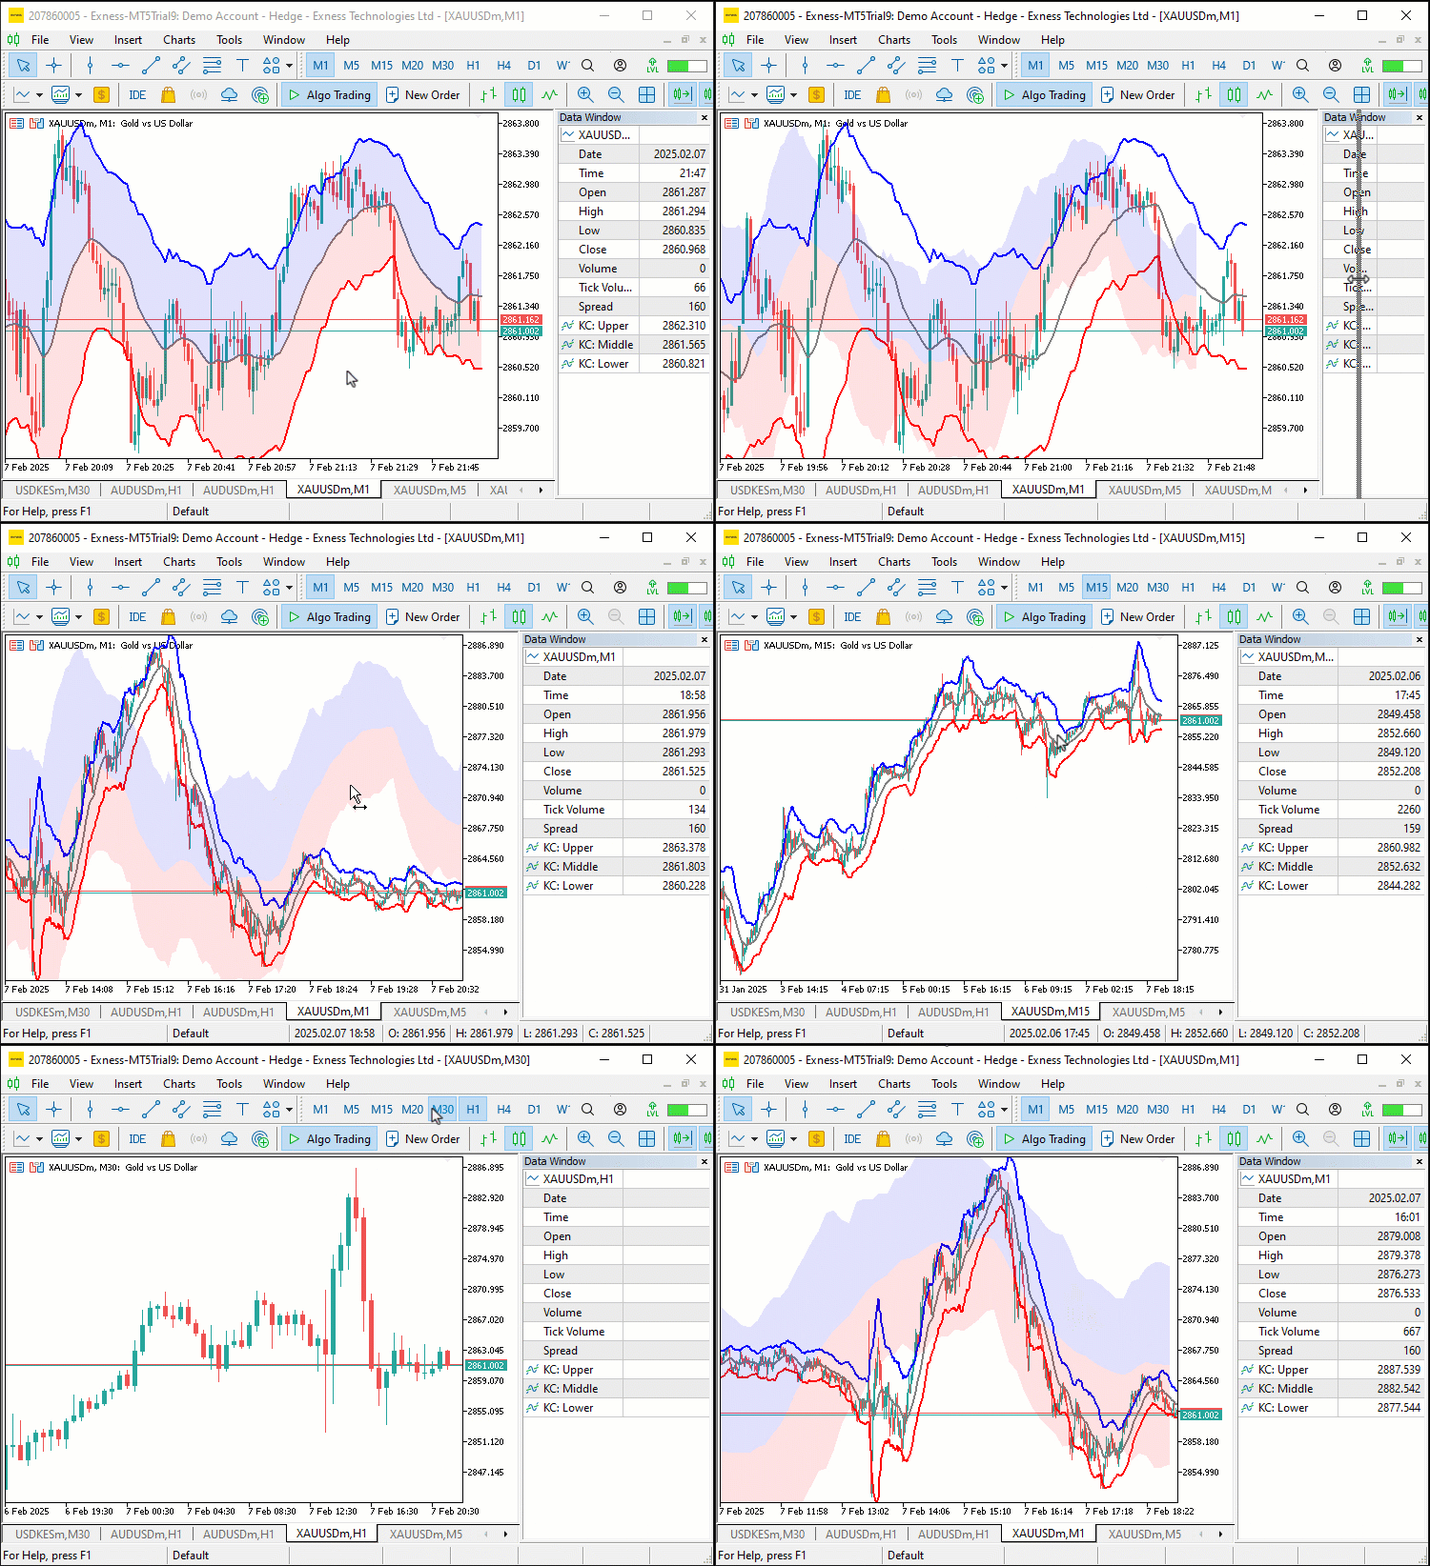
To address this, we implemented a logic to update it on the OnChartEvent event handler.
//+------------------------------------------------------------------+
//| Custom indicator chart event handler function                    |
//+------------------------------------------------------------------+
void OnChartEvent(const int id, const long& lparam, const double& dparam, const string& sparam){
   if(id != CHARTEVENT_CHART_CHANGE)
      return;
   chart_width          = (int)ChartGetInteger(0, CHART_WIDTH_IN_PIXELS);
   chart_height         = (int)ChartGetInteger(0, CHART_HEIGHT_IN_PIXELS);
   chart_scale          = (int)ChartGetInteger(0, CHART_SCALE);
   chart_first_vis_bar  = (int)ChartGetInteger(0, CHART_FIRST_VISIBLE_BAR);
   chart_vis_bars       = (int)ChartGetInteger(0, CHART_VISIBLE_BARS);
   chart_prcmin         = ChartGetDouble(0, CHART_PRICE_MIN, 0);
   chart_prcmax         = ChartGetDouble(0, CHART_PRICE_MAX, 0);
   if(chart_width != obj_Canvas.Width() || chart_height != obj_Canvas.Height())
      obj_Canvas.Resize(chart_width, chart_height);
//---
   RedrawChart();
}
Here, we handle the OnChartEvent function, which listens for the CHARTEVENT_CHART_CHANGE event. When the chart dimensions change (such as when the chart is resized), we first retrieve the updated chart properties, such as width ("CHART_WIDTH_IN_PIXELS"). We then check if the new width and height of the chart differ from the current canvas size using "obj_Canvas.Width" and "obj_Canvas.Height". If they do differ, we resize the canvas with "obj_Canvas.Resize". Finally, we call the "RedrawChart" function to update the chart and ensure that all visual elements are rendered correctly with the new dimensions. The outcome is as below.
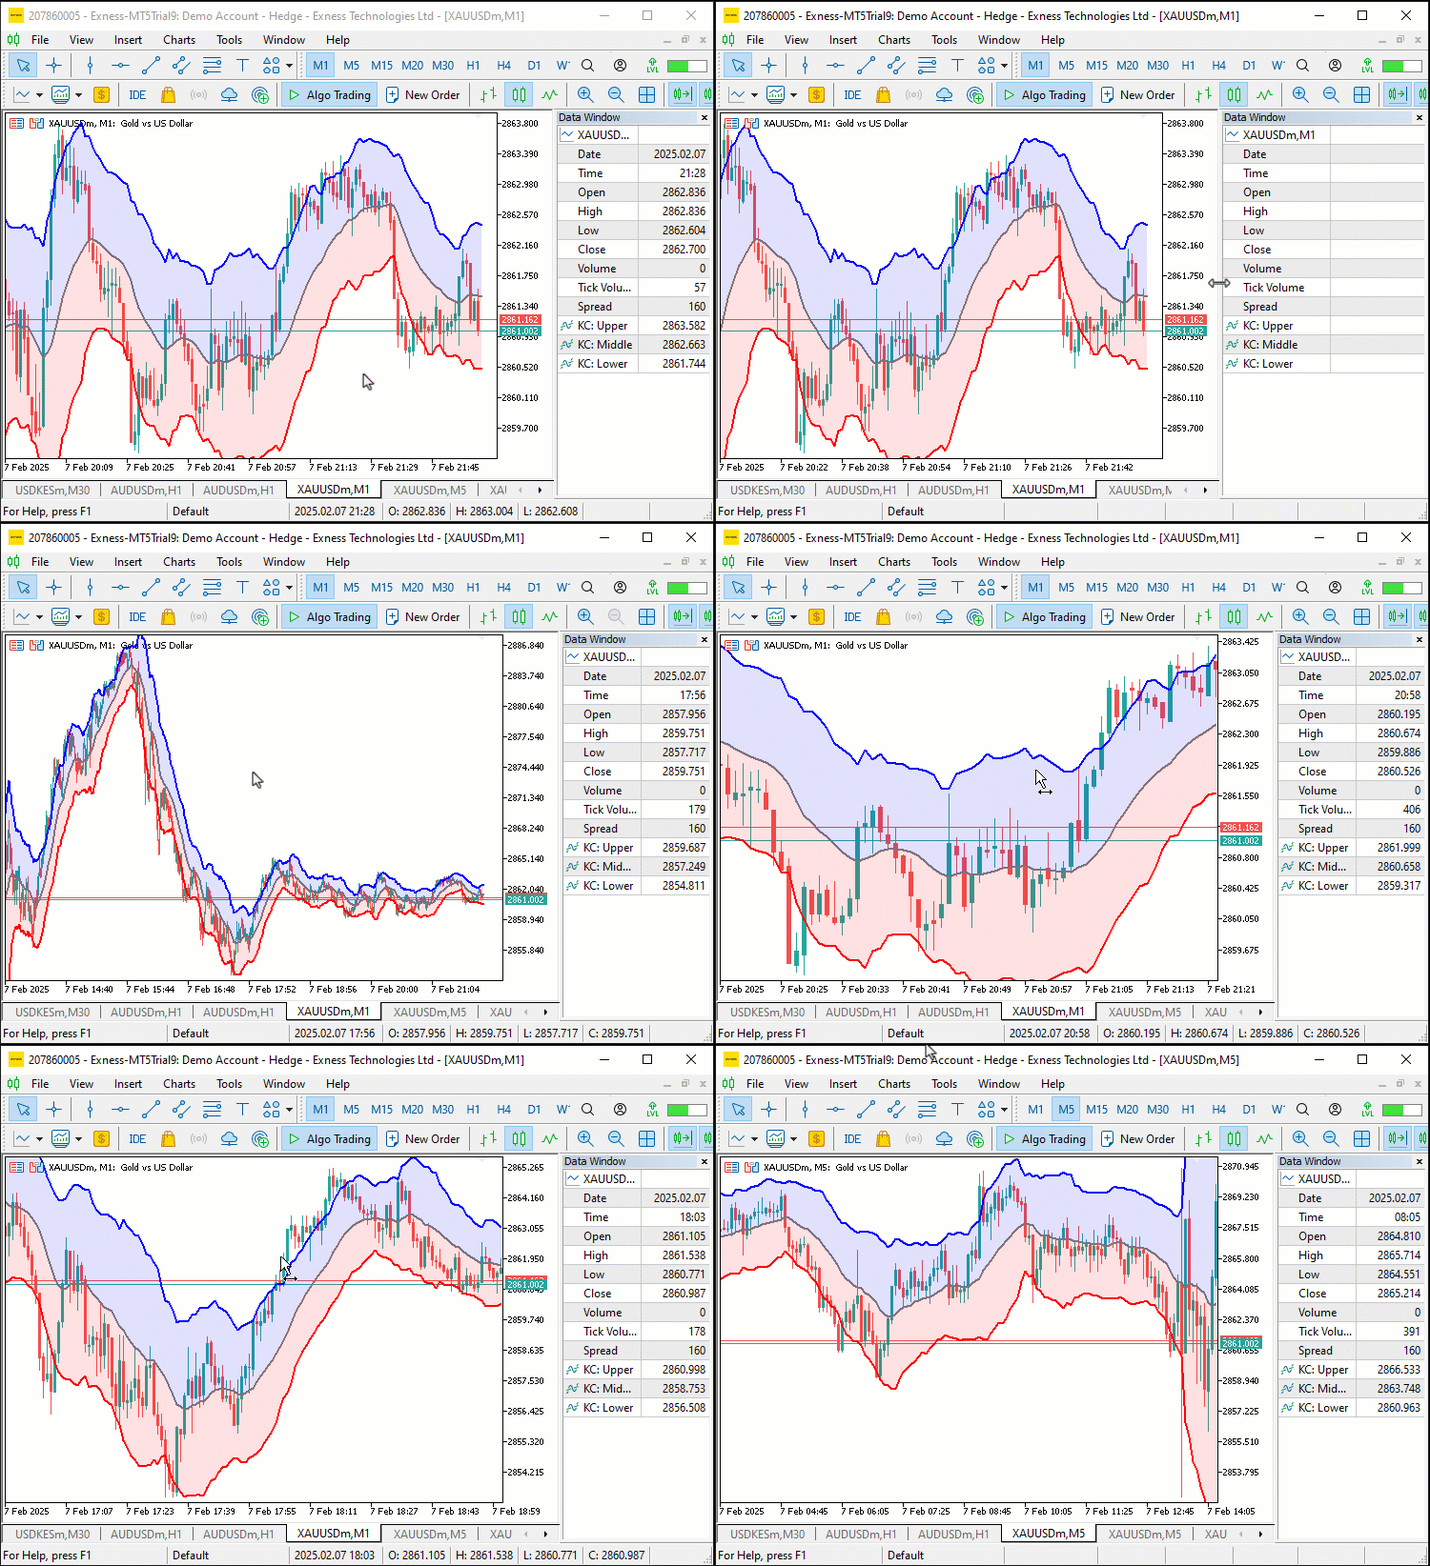
From the visualization, we can see that changes are taking effect dynamically when we resize the chart, hence achieveing our objective.
Conclusion
In conclusion, this article covered building a custom MQL5 indicator using moving averages and average true range tool to create dynamic channels. We focused on calculating and displaying these channels with a filling mechanism, while also addressing performance improvements for chart resizing and backtesting, ensuring efficiency and accuracy for traders.
Warning: All rights to these materials are reserved by MetaQuotes Ltd. Copying or reprinting of these materials in whole or in part is prohibited.
This article was written by a user of the site and reflects their personal views. MetaQuotes Ltd is not responsible for the accuracy of the information presented, nor for any consequences resulting from the use of the solutions, strategies or recommendations described.
 MQL5 Wizard Techniques you should know (Part 54): Reinforcement Learning with hybrid SAC and Tensors
 Mastering JSON: Create Your Own JSON Reader from Scratch in MQL5
 Deconstructing examples of trading strategies in the client terminal
 Neural Networks in Trading: Using Language Models for Time Series Forecasting
- Free trading apps
- Over 8,000 signals for copying
- Economic news for exploring financial markets
You agree to website policy and terms of use