
Building A Candlestick Trend Constraint Model (Part 7): Refining our model for EA development
Sections of Interest:
- Introduction
- Identifying limitations of the current system
- Revisiting the Chart
- Revisiting the Code
- Incorporating Moving Average Crossover
- Draw Profit and Risk Rectangles
- Introducing Exit Points
- Testing and Validation
- Conclusion
Introduction
It is possible to develop an Expert Advisor based on the available indicators. There are two ways that I will mention in this article:
- Coding the indicator conditions into the Expert Advisor algorithm is efficient and very fast, even in the Strategy Tester. With this method, the EA operates without the need for an indicator to be used separately.
- Preparing an Expert Advisor algorithm that pays attention to the buffers of the indicator is another approach. If the buffer is True or False, the EA is programmed to respond in a certain way. There are two files necessary for the system to function on the MetaTrader 5 platform: both the EA and the indicator must exist in specific directories within the platform path. It is challenging to publish an EA that runs on a custom indicator, as the validation system will not find your indicator when attempting to publish on the MQL5 community. I certainly tried it and encountered errors, so I could only run it on my computer without publishing.
Before going further, we need to prepare our indicator for the EA job. This involves ensuring our indicator buffers are well organized and understanding their operations, so it becomes easier to develop the concept into an EA. Both approaches mentioned above work well, each with its own pros and cons, which we will discuss in future writings. The main advantage of using an indicator alongside the EA is that it reduces the complexity of writing the EA algorithm. The developer can focus on a few specific parts of the algorithm since the conditions are already coded into the indicator program.
In Part 6, Trend Constraint V1.08 was our final advancement, combining two major integrations into one program. We are pleased with this progress, as we can now easily access the signals on Telegram and WhatsApp. However, there are a few questions to ask:
- Yes, we are now receiving the signals, but are they the best?
- We can execute trades, but when should we exit?
These questions can only be addressed by revisiting the chart to see how the indicator is performing historically, and by re-coding the source code to add new features or enhance the current system. In refining the current system for Expert Advisors, I propose to:
- Understand the purpose of each buffer as thoroughly as possible.
- Reintroduce moving average crossovers for entry signals.
- Use risk-reward ratios to draw rectangles: green for illustrating the profit target range and red for the loss range.
Where;
RRR is Risk-Reward Ratio;
Potential Loss is the amount you stand to lose if the trade or investment moves against you;
Potential Gain is the amount you expect to gain if the trade or investment moves in your favor.
Let me give an example:
Assume you are considering buying a stock at $50. You set your stop-loss at $48 (indicating a potential loss of $2 per share) and set a target price of $56 (indicating a potential gain of $6 per share). Calculate the Risk-Reward Ratio for the stock.
- Potential Loss: $50 (entry price) - $48 (stop-loss) = $2
- Potential Gain: $56 (target price) - $50 (entry price) = $6
Substituting the values into the formula: Risk-Reward Ratio = 1/3
In detail, this means for every $1 you risk, you expect to gain $3. A lower ratio (e.g., 1:1 or less) indicates more risk relative to the potential reward, while a higher ratio suggests a more favorable risk-reward scenario.
Based on the above example, here's an illustration using rectangles: a red rectangle for risk and a green rectangle for reward.
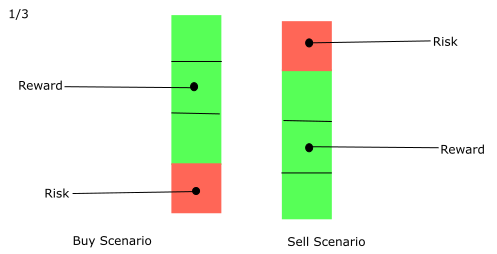
Let's discuss this further in the next sections of the article. By the end of this discussion, we aim to focus on:
- Understanding the importance of risk management in algorithm trading.
- Implementing risk-reward ratios and their mathematical foundations.
- Developing dynamic exit strategies for optimal trade management.
- Enhancing visual indicators for better trade decision-making.
- Testing and validating the indicator for real-world application.
Identifying limitations of the current system
To advance an indicator system with new features, it is important to revisit crucial parts to identify areas where the current system lags. To accomplish this, I have considered two techniques according to my approach, which will guide me in identifying and solving problems. These are: - Revisiting the Chart: This involves reviewing the indicator chart window history, taking note of its presentation, and identifying any anomalies.
- Revisiting the Code: This is the second stage: after completing step 1, we will examine the code areas related to the identified problems to fix them.
Revisiting the Chart
Here is an image of the Boom 500 Index chart. I will outline the problems as I perceive them on the chart: 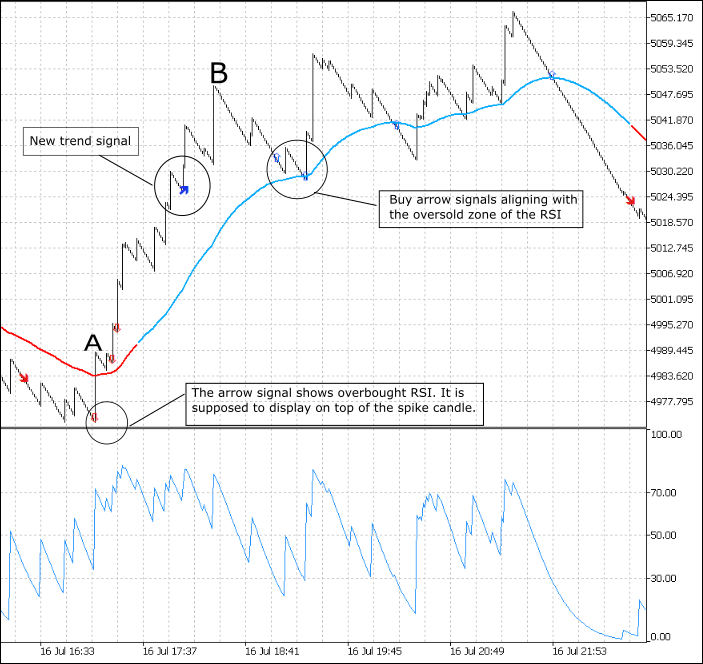
- From the diagram, (A) represents a spike candlestick. In this case, the arrow is displayed below the candle when it should be above the candle. This issue arises because the arrow is representing the RSI overbought zone, which only occurs after the candle has closed.
- The DRAW_LINE display feature is working well, allowing us to identify new trends by observing color changes in the line. We want it to signal a swing trade because, typically, when the market changes direction, it often moves significantly.
- Blue buy arrow signals represent a potential trend continuation and currently indicate the Oversold zone of RSI in a prevailing uptrend. Remember that our theme is constraining our signals to the D1 candle, market sentiment. While extreme levels of the Relative Strength Index (RSI) can be good for entries, they usually indicate the market zone rather than a guaranteed reversal. The market might continue prevailing in the trend regardless of the RSI levels. I suggest reintroducing the moving average crossover for other entries to maximize gains, as this usually aligns well with price action.
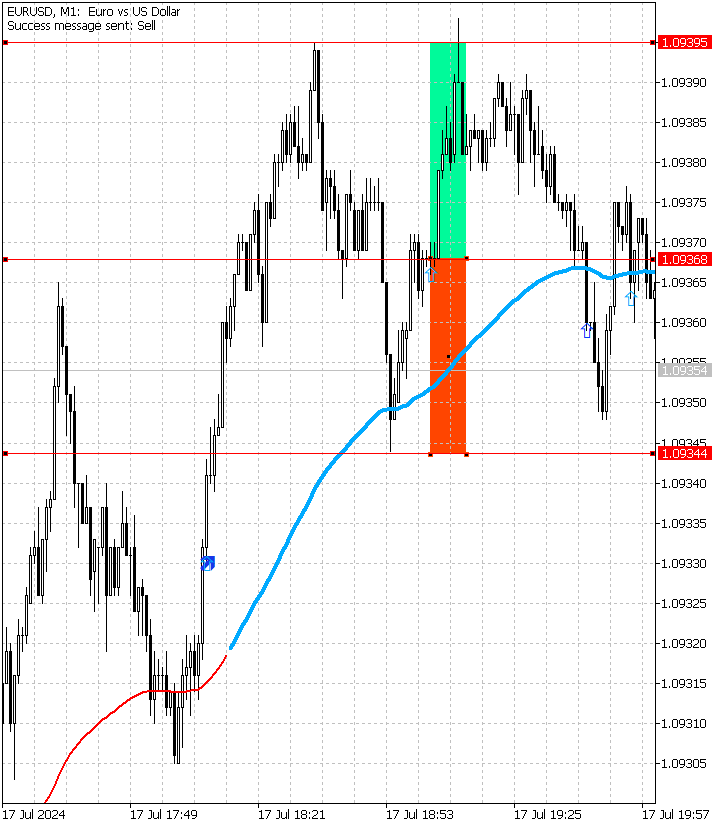
- I also envision the benefit of featuring rectangles for risk-reward ratios to be drawn when the indicator sends entry signals, as mentioned during the introduction. This new version must accurately outline the rectangles to present the risk and rewards correctly. See the idea conveyed in the chart shots below: the first is EURUSD, and the second is Boom 500, consecutively.
EURUSD, M1: Euro vs US Dollar
Boom 500 Index, M1:
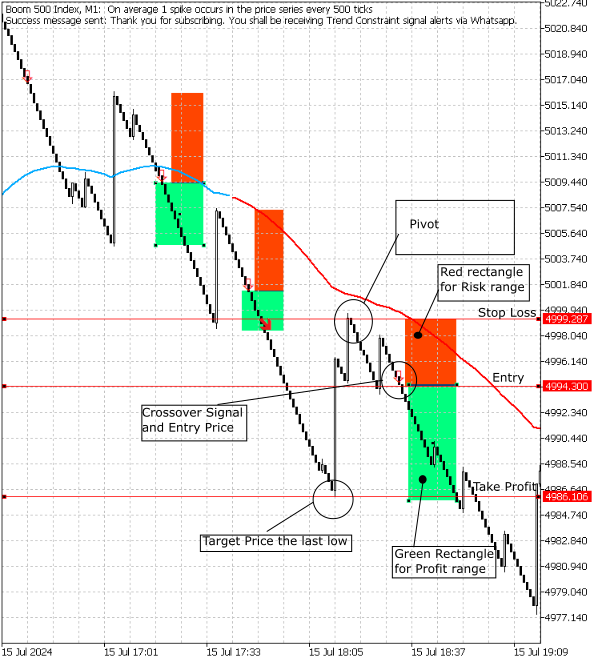
From these diagrams, we can clearly observe the new approach. We want to prepare our indicator code to reflect exactly what was demonstrated manually. According to several technical analysts and traders, pivots have conventionally been respected as targets for take profit and stop loss. Therefore, the idea of a 1:3 risk-reward ratio may become inapplicable in scenarios like those shown in the chart, where sometimes the risk is much larger than the potential profit.
In summary, from the illustrations above:
- Pivots are used as reference points for setting exit points, including stop loss and take profit.
- Prices for the entry and exit levels can be used later in the logic.
In the next section, we will examine the critical areas in the code and address them.
Revisiting the Code:
Here's a snippet where we can make changes: #property indicator_type1 DRAW_ARROW #property indicator_width1 5 #property indicator_color1 0xFF3C00 #property indicator_label1 "Buy" // We are going to change it to "Buy Zone" #property indicator_type2 DRAW_ARROW #property indicator_width2 5 #property indicator_color2 0x0000FF #property indicator_label2 "Sell"// We are going to change it to "Sell Zone"
This section of the program is where we fix the position of the arrow on the candlestick. It involves the iteration function of Buffer 2. The indicator must display at the candlestick high, so we will change from Low[i] to High[i];
//Indicator Buffer 2 // We are going to set the indicator to display at candlestick high by changing the highlighted text to High[i]
      if(RSI[i] > Overbought
      && RSI[i+1] < Overbought //Relative Strength Index crosses above fixed value
      && Open[barshift_M1[i]] <= Close[1+barshift_D1[i]] //Candlestick Open <= Candlestick Close
      && MA[i] < MA2[i] //Moving Average < Moving Average
      && MA3[i] < MA4[i] //Moving Average < Moving Average
      )

        {
         Buffer2[i] = Low[i]; //Set indicator value at Candlestick Low // change to High[i]
         if(i == 1 && Time[1] != time_alert) myAlert("indicator", "Sell Zone"); //Alert on next bar open
         time_alert = Time[1];
        }
      else
        {
         Buffer2[i] = EMPTY_VALUE;
        }
Incorporating Moving Average crossover:
Let's discuss the code snippets below to uncover the process of adding a new feature to our program. In addition to the existing buffers, we will add two new ones, which will be Buffer 6 and Buffer 7.
According to the logic of our smart program, we will begin by defining its properties. Since we recently adopted 'Sell Zone' and 'Buy Zone' for the RSI indicator, these will be the new 'Sell' and 'Buy' signals for the indicator.
#property indicator_type6 DRAW_ARROW
#property indicator_width6 1
#property indicator_color6 0x0000FF
#property indicator_label6 "Sell"

#property indicator_type7 DRAW_ARROW
#property indicator_width7 1
#property indicator_color7 0xFFAA00
#property indicator_label7 "Buy"
We need to set inputs for customization to optimize for the best signals. We will use a moving average of 7 and a moving average of 21.
input int Entry_MA_fast = 7 ;
input int Entry_MA_slow = 21 ;
The OnCalculate function for the new features is shown here. It details how the program will display the results when the conditions are met.
SetIndexBuffer(5, Buffer6);
   PlotIndexSetDouble(5, PLOT_EMPTY_VALUE, EMPTY_VALUE);
   PlotIndexSetInteger(5, PLOT_DRAW_BEGIN, MathMax(Bars(Symbol(), PERIOD_CURRENT)-PLOT_MAXIMUM_BARS_BACK+1, OMIT_OLDEST_BARS+1));
   PlotIndexSetInteger(5, PLOT_ARROW, 242);
   SetIndexBuffer(6, Buffer7);
   PlotIndexSetDouble(6, PLOT_EMPTY_VALUE, EMPTY_VALUE);
   PlotIndexSetInteger(6, PLOT_DRAW_BEGIN, MathMax(Bars(Symbol(), PERIOD_CURRENT)-PLOT_MAXIMUM_BARS_BACK+1, OMIT_OLDEST_BARS+1));
   PlotIndexSetInteger(6, PLOT_ARROW, 241);
This stage incorporates the conditions for the moving average crossover. In this scenario, the conditions for Buffer 7 mirror those of Buffer 6. Essentially, the process is the same but reversed for each buffer.
//Indicator Buffer 6
      if(MA8[i] < MA9[i]
      && MA8[i+1] > MA9[i+1] //Moving Average crosses below Moving Average
      && Open2[i] <= Close[1+barshift_D1[i]] //Candlestick Open <= Candlestick Close
      )
        {
         Buffer6[i] = High[i]; //Set indicator value at Candlestick High
         if(i == 1 && Time[1] != time_alert) myAlert("indicator", "Sell"); //Alert on next bar open
         time_alert = Time[1];
        }
      else
        {
         Buffer6[i] = EMPTY_VALUE;
        }
      //Indicator Buffer 7
      if(MA8[i] > MA9[i]
      && MA8[i+1] < MA9[i+1] //Moving Average crosses above Moving Average
      && Open2[i] >= Close[1+barshift_D1[i]] //Candlestick Open >= Candlestick Close
      )
        {
         Buffer7[i] = Low[i]; //Set indicator value at Candlestick Low
         if(i == 1 && Time[1] != time_alert) myAlert("indicator", "Buy"); //Alert on next bar open
         time_alert = Time[1];
        }
      else
        {
         Buffer7[i] = EMPTY_VALUE;
        }
Draw Rectangles
I've had a good time working with the code. I considered building on the existing program by modifying the recently incorporated buffers to include functionality for placing rectangles that mark the risk and profit zones. Furthermore, I started by outlining the logic on paper for how the objects will be placed and which buffers will be associated with them, specifically Buffer 6 and Buffer 7.
Here’s the paper logic before the actual implementation:
On a fast-moving average, crossover below a slow-moving average:
When conditions of Buffer7 are true we want a rectangle to be placed below the low of the current candle.- The width of the rectangle be 5 bars or more.
- The height of the rectangle be, X pips downwards; where, X is the number of pips.
- The rectangle must be green.
- On top of the green rectangle when the conditions of Buffer7 are true place a red rectangle which is 1/3 height of the green rectangle.
- All the parameters must be customizable.
On fast-Moving Average crossover above slow-Moving Average, when the conditions of Buffer 6 are true, we want to place a rectangle above the high of the current candle.
Here are the specifications are as follows:
- The width of the rectangle should be 5 bars or more.
- The height of the rectangle should be X pips upwards, where X is the number of pips.
- The rectangle must be green.
- Below the green rectangle, when the conditions of Buffer 6 are true, place a red rectangle that is 1/3 the height of the green rectangle.
- All parameters must be customizable.
Firstly, we need the ability to input parameters for customization. Here is the code snippet showing the incorporation:
//--- new inputs for rectangles
input int RectWidth = 5;                 // Width of the rectangle in bars
input int RectHeightPointsBuy = 50;      // Height of the profit rectangle in points for Buy
input int RectHeightPointsSell = 50;     // Height of the profit rectangle in points for Sell
input color ProfitRectColor = clrGreen;  // Color of the profit rectangle
input color RiskRectColor = clrRed;      // Color of the risk rectangle
By default, I have set the points to 50, but these can be adjusted to suit your needs and profit targets. I have also included a feature that automatically adjusts the height of the risk rectangle as a ratio to the profit target. This is important because it allows the indicator to adapt to any background color changes. For example, if you use a green chart background, the green rectangle might blend in and become invisible, while a yellow background would provide better contrast. Customization is crucial to ensure full control over our tools.
Now, let's examine the OnCalculate function to see how the iteration is working.
if(RSI[i] > Overbought) {
        if(close[i] > MA[i])
            Buffer6[i] = close[i] - pips * myPoint;
    }

    if(RSI[i] < Oversold) {
        if(close[i] < MA[i])
            Buffer7[i] = close[i] + pips * myPoint;
    }

    if(Buffer6[i] > 0) {
        Buffer1[i] = close[i] - pips * myPoint;
        Buffer3[i] = close[i] - pips * myPoint;
        if (Buffer6[i - 1] < 0) {
            myAlert("indicator", "Sell Signal Detected!");
            if (Audible_Alerts)
                Alert(Symbol(), " ", Period(), ": Sell Signal Detected!");

            // Create profit rectangle for Sell
            double highProfitRect = close[i];
            double lowProfitRect = close[i] - RectHeightPointsSell * myPoint;
            string profitRectName = "SellProfitRect" + IntegerToString(i);
            if (ObjectFind(0, profitRectName) != 0) {
                ObjectCreate(0, profitRectName, OBJ_RECTANGLE, 0, time[i], highProfitRect, time[i + RectWidth], lowProfitRect);
                ObjectSetInteger(0, profitRectName, OBJPROP_COLOR, ProfitRectColor);
                ObjectSetInteger(0, profitRectName, OBJPROP_STYLE, STYLE_SOLID);
                ObjectSetInteger(0, profitRectName, OBJPROP_WIDTH, 2);
            }

            // Create risk rectangle for Sell
            double highRiskRect = close[i];
            double lowRiskRect = close[i] + (RectHeightPointsSell / 3) * myPoint;
            string riskRectName = "SellRiskRect" + IntegerToString(i);
            if (ObjectFind(0, riskRectName) != 0) {
                ObjectCreate(0, riskRectName, OBJ_RECTANGLE, 0, time[i], highRiskRect, time[i + RectWidth], lowRiskRect);
                ObjectSetInteger(0, riskRectName, OBJPROP_COLOR, RiskRectColor);
                ObjectSetInteger(0, riskRectName, OBJPROP_STYLE, STYLE_SOLID);
                ObjectSetInteger(0, riskRectName, OBJPROP_WIDTH, 2);
            }
        }
    }

    if(Buffer7[i] > 0) {
        Buffer2[i] = close[i] + pips * myPoint;
        Buffer4[i] = close[i] + pips * myPoint;
        if (Buffer7[i - 1] < 0) {
            myAlert("indicator", "Buy Signal Detected!");
            if (Audible_Alerts)
                Alert(Symbol(), " ", Period(), ": Buy Signal Detected!");

            // Create profit rectangle for Buy
            double highProfitRect = close[i] + RectHeightPointsBuy * myPoint;
            double lowProfitRect = close[i];
            string profitRectName = "BuyProfitRect" + IntegerToString(i);
            if (ObjectFind(0, profitRectName) != 0) {
                ObjectCreate(0, profitRectName, OBJ_RECTANGLE, 0, time[i], highProfitRect, time[i + RectWidth], lowProfitRect);
                ObjectSetInteger(0, profitRectName, OBJPROP_COLOR, ProfitRectColor);
                ObjectSetInteger(0, profitRectName, OBJPROP_STYLE, STYLE_SOLID);
                ObjectSetInteger(0, profitRectName, OBJPROP_WIDTH, 2);
            }

            // Create risk rectangle for Buy
            double highRiskRect = close[i] - (RectHeightPointsBuy / 3) * myPoint;
            double lowRiskRect = close[i];
            string riskRectName = "BuyRiskRect" + IntegerToString(i);
            if (ObjectFind(0, riskRectName) != 0) {
                ObjectCreate(0, riskRectName, OBJ_RECTANGLE, 0, time[i], highRiskRect, time[i + RectWidth], lowRiskRect);
                ObjectSetInteger(0, riskRectName, OBJPROP_COLOR, RiskRectColor);
                ObjectSetInteger(0, riskRectName, OBJPROP_STYLE, STYLE_SOLID);
                ObjectSetInteger(0, riskRectName, OBJPROP_WIDTH, 2);
            }
        }
This where the creation of rectangles is going on:
Profit Rectangles:
- For, sell signals, a green rectangle extends downward from the close price.
- For, buy signals, a green rectangle extends upward from the close price.
Risk Rectangles:
- For, sell signals, a red rectangle extends upward from the close price, with a height of 1/3 of the profit rectangle.
- For, buy signals, a red rectangle extends downward from the close price, with a height of 1/3 of the profit rectangle.
Now let's briefly explain the new functions being introduced;
- ObjectFind: Function used to check if an object with a specific name already exists on the chart.
int ObjectFind(
   long   chart_id,   // Chart ID (0 means the current chart)
   string name        // Name of the object to search for
);
- ObjectCreate: Function used to create a new graphical object on the chart. The type of object can be specified (e.g., rectangle, trend line, etc.).
bool ObjectCreate(
   long    chart_id,   // Chart ID (0 means the current chart)
   string  name,       // Name of the object to create
   ENUM_OBJECT type,   // Type of the object (e.g., OBJ_RECTANGLE, OBJ_TREND, etc.)
   int     sub_window, // Number of the subwindow (0 means the main chart window)
   datetime time1,     // First coordinate time
   double  price1,     // First coordinate price
   ...                 // Additional coordinates depending on the object type
);
- ObjectSetInteger: Function used to set integer properties of a graphical object, such as color, style, and width.
bool ObjectSetInteger(
   long   chart_id,     // Chart ID (0 means the current chart)
   string name,         // Name of the object
   int    prop_id,      // ID of the property to set (e.g., OBJPROP_COLOR, OBJPROP_STYLE, etc.)
   long   value         // Value of the property
);
This function returns a boolean value;
- true: If the property is successfully set.
- false: If setting the property fails.
Please for more in depth explanation of the these functions, always feel free to check MQL5 documentation which rich with all about MQL5 language.
Introducing Exit Points
Introducing exit points is a pivotal enhancement for Trend Constraint V1.08. An effective exit strategy not only protects profits and minimizes losses. We propose integrating predefined exit points based on key support and resistance levels, which are crucial for identifying potential reversal zones. The previous signal logic only involved the name of the pair, but the new refinement will provide all relevant prices, including Entry, Stop Loss, and Take Profit. By using these levels, traders can determine exit points where the price is likely to reverse or encounter significant resistance, thereby optimizing their exit strategy. Here's the approach:
To modify the program to insert price lines along rectangles, we'll add three lines at specific price levels:
- the signal price (close price of the signal),
- the profit target,
- and the risk target.
These lines will be placed immediately after the signal is detected. We will also set up alerts to notify the user of these specific price levels.
First, we define profit points and risk points as inputs to make them customizable.
input double profitPoints = 60; // Points for profit target
input double riskPoints = 20;   // Points for risk target
At this point, let me introduce custom functions for placing lines. The snippet below shows the definition of these functions. If you are new to MQL5, note that void is used to indicate that a function does not return a value.
void CreatePriceLine(string name, color lineColor, double price, datetime time) {
    if (ObjectFind(0, name) == -1) {
        ObjectCreate(0, name, OBJ_HLINE, 0, time, price);
        ObjectSetInteger(0, name, OBJPROP_COLOR, lineColor);
        ObjectSetInteger(0, name, OBJPROP_WIDTH, 2);
    } else {
        ObjectMove(0, name, 0, time, price);
    }
}

void PlaceSignalLines(double signalPrice, double profitTarget, double riskTarget, datetime time) {
    CreatePriceLine("SignalPriceLine", clrBlue, signalPrice, time);
    CreatePriceLine("ProfitTargetLine", clrGreen, profitTarget, time);
    CreatePriceLine("RiskTargetLine", clrRed, riskTarget, time);
}
Finally, here is the logic for signal detection. As you can see, we have alerts to indicate crucial price levels, which will aid the trader when manually executing the program.
void CheckSignalAndPlaceLines() {
    for (int i = rates_total - 2; i >= 0; i--) {
        if (Buffer6[i] != 0.0) { // Buy Signal Detected
            double signalPrice = Close[i];
            double profitTarget = signalPrice + profitPoints * Point;
            double riskTarget = signalPrice - riskPoints * Point;
            PlaceSignalLines(signalPrice, profitTarget, riskTarget, Time[i]);
            Alert("Buy Signal: Signal Price = ", signalPrice, " Profit Target = ", profitTarget, " Risk Target = ", riskTarget);
        }
        if (Buffer7[i] != 0.0) { // Sell Signal Detected
            double signalPrice = Close[i];
            double profitTarget = signalPrice - profitPoints * Point;
            double riskTarget = signalPrice + riskPoints * Point;
            PlaceSignalLines(signalPrice, profitTarget, riskTarget, Time[i]);
            Alert("Sell Signal: Signal Price = ", signalPrice, " Profit Target = ", profitTarget, " Risk Target = ", riskTarget);
        }
    }
}
In summary, we made three major changes to our program, which I will outline below:
- We refined the Trend Constraint V1.08 and featured in a moving average crossover for entry signals.
- We discussed incorporation of rectangles to represent risk and profit zones.
- Furthermore, we discussed the importance of exit points in our program.
From the summary, the possibility of three versions of our program emerges as we continue refining it. We now have Trend Constraint V1.09, V1.10, and V1.11. Next, we will proceed to discuss the test performance and outcomes.
Testing and Validation
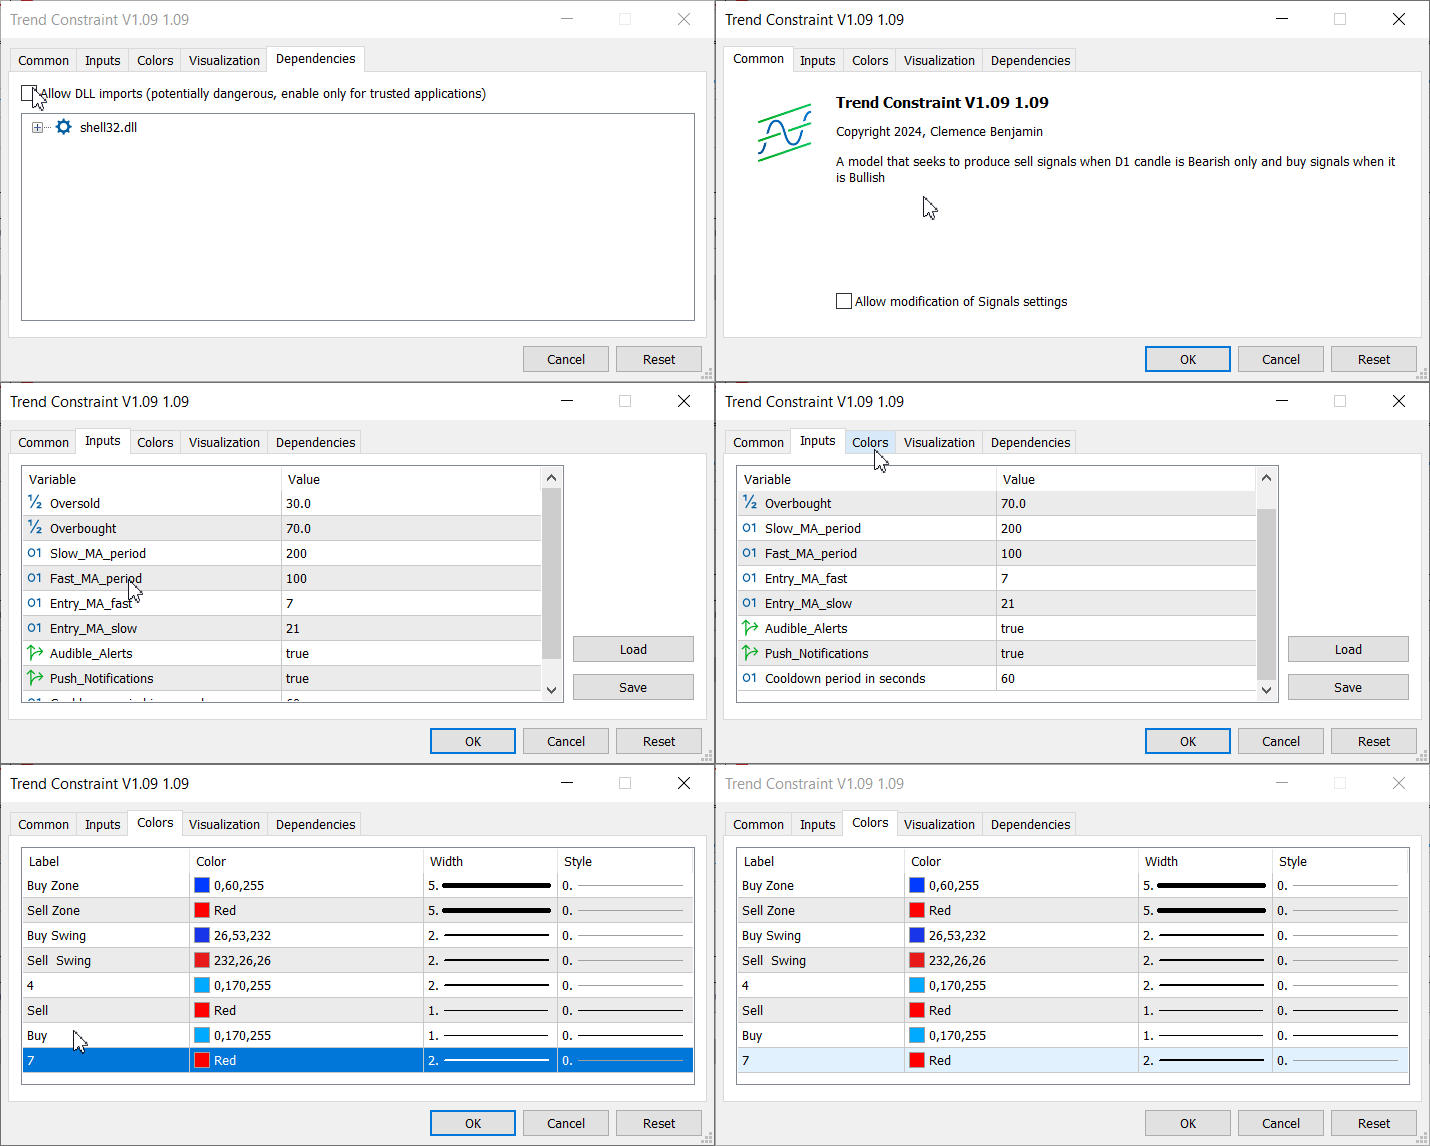
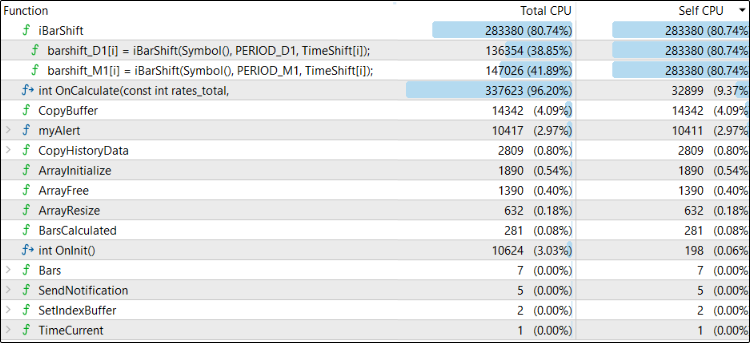
Testing and compiling version V1.09 was a success, although some issues were encountered and fully resolved. Here are some images showing a panel with a successful launch, as well as a profiler summary detailing the function performance on the CPU.
The profiling result of the tester:
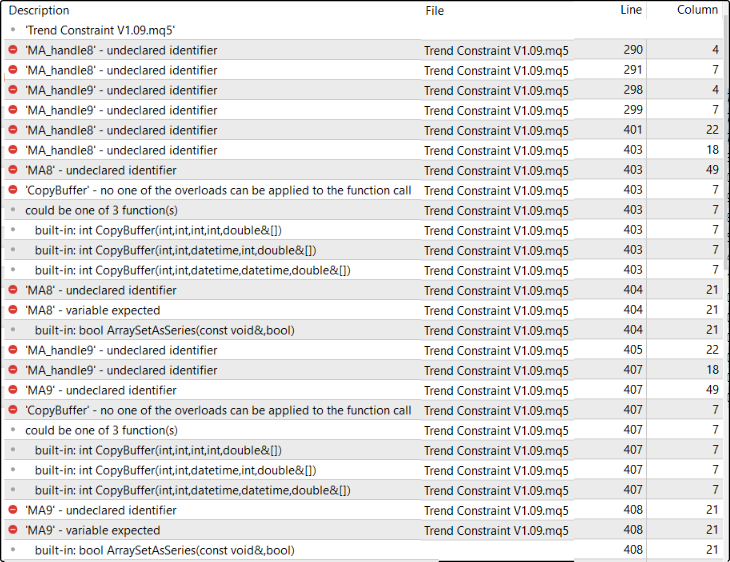
After reading the error log, it became easier to review the program and identify what was missing. Upon adding the Moving Average crossover, we also needed to declare the MA8, MA9, MA_handle8, and MA_handle9 for the new buffers alongside the existing ones. The code below shows the declarations made. The highlighted lines indicate the ones that caused the errors.
int RSI_handle;
double RSI[];
double Open[];
double Close[];
int MA_handle;
double MA[];
int MA_handle2;
double MA2[];
int MA_handle3;
double MA3[];
int MA_handle4;
double MA4[];
double Low[];
double High[];
int MA_handle5;
double MA5[];
int MA_handle6;
double MA6[];
int MA_handle7;
double MA7[];
int MA_handle8;
double MA8[];
int MA_handle9;
double MA9[];
double Open2[];
After adding the highlighted declarations, the program compiled successfully.
Moving on to V1.10, the program compiled successfully after incorporating rectangles, but nothing appears on the chart. It is difficult to determine where we missed something, so we will continue debugging line by line until the issue is resolved and share the findings in the next writings.
V1.11 encountered compilation errors, and I will share the entire resolution process in the next writing.
A summary of the buffers in the program is important for EA development, as it helps us understand which buffer performs the necessary conditions. See the table below.
| Buffer | Description |
|---|---|
| Buffer1. | This buffer is used to identify if RSI crosses above a fixed value (Overbought), the current open price is greater than or equal to the close price of a specific bar, two moving averages (MA and MA3) are both greater than their respective comparison moving averages (MA2 and MA4), and mark a "Buy Zone" on the chart. |
| Buffer2. | This buffer is used to identify if RSI crosses above a fixed value (Overbought), the current open price is less than or equal to the close price of a specific bar, two moving averages (MA and MA3) are both less than their respective comparison moving averages (MA2 and MA4), and mark a "Sell Zone" on the chart. |
| Buffer3. | This buffer is used to identify if MA5 crosses above MA6 and mark a "Buy Swing" on the chart. |
| Buffer4. | This buffer is used to identify if MA5 crosses below MA6 and mark a "Sell Swing" on the chart. |
| Buffer5. | This buffer tracks if MA3 is greater than MA7. |
| Buffer6. | This buffer is used to identify if MA8 crosses below MA9 and mark a "Sell" on the chart. |
| Buffer7. | This buffer is used to identify if MA8 crosses above MA9 and mark a "Buy" on the chart. |
| Buffer8. | This buffer tracks if MA3 is less than MA7. |
Conclusion
In conclusion, the development and refinement of Trend Constraint represent a significant advancement in algorithm trading. By addressing the limitations of the current system and introducing strategic exit points, we aim to create a more robust and effective indicator. The incorporation of stop-loss and take-profit levels, along with enhanced visual representations, ensures that the indicator is user-friendly and adaptable to changing market conditions. These features now provide a clear visual representation of potential trading outcomes, aiding in better decision-making.
Through rigorous testing and validation, we have demonstrated the indicator's reliability and effectiveness. Although we encountered errors, we remained persistent, and through thorough research, we resolved them. We will use the documentation and collaborate with the developer community to address any remaining issues.
Overall, the enhanced Trend Constraint offers a comprehensive solution for traders seeking to navigate the complexities of the financial markets with confidence and precision. Its advanced features and strategic approach to risk management and profit optimization make it a valuable addition to any trader's toolkit.
Attached below are the files for further development in your projects. Happy developing!
| File name | Description |
|---|---|
| Trend Constraint V1.09 | Refined program with MA crossover signals. |
| Trend Constraint V1.10 | Advanced program featuring object draw functions. Still at the debugging stage. |
 MQL5 Wizard Techniques you should know (Part 29): Continuation on Learning Rates with MLPs
 Developing a Replay System (Part 42): Chart Trader Project (I)
 Twitter Sentiment Analysis with Sockets
 Population optimization algorithms: Whale Optimization Algorithm (WOA)
- Free trading apps
- Over 8,000 signals for copying
- Economic news for exploring financial markets
You agree to website policy and terms of use