
How to create a custom True Strength Index indicator using MQL5
Introduction
Technical indicators can be very useful if we use them properly as they may provide additional insights, which are hard to detect by only looking at the price action. There are many ready technical indicators that we can use, but sometimes we may find that we need to customize them to indicate or give us specific insight or we need to create a new one based on our winning ideas. There is a way to create such customized indicators in MQL5 and use them in the MetaTrader 5 trading platform. In this article, I will share with you how you can create the True Strength Index Indicator from scratch. We will learn the specifics of this indicator and see how to calculate it in our code. Not that only, but we will learn how we can use this customized indicator in a trading system based on a trading strategy by creating an Expert Advisor. We will cover all of that through the following topics:
- True Strength Index (TSI) definition
- A custom Simple TSI indicator
- A custom TSI EA
- TSI System EA
- Conclusion
After understanding the previously mentioned topics, we will be able to well understand how to use and interpret the True Strength Index indicator, we will be able to calculate it and to code this indicator as a custom indicator in the MQL5 language to be used in the MetaTrader 5. You will also be able to implement the indicator in other trading systems or EAs. If you want to develop your coding skills, I advise you to try to code the content here by yourself as this practice is a very important step in any learning process or roadmap. We will use the MetaTrader 5 to write our MQL5 code in its IDE which is built into the MetaTrader 5 trading terminal. If you do not have the platform or you do not know how to download and use it, you can read the 'Writing MQL5 code in MetaEditor' topic in my earlier articles.
True Strength Index (TSI) definition
In this part, we will identify the True Strength Index (TSI) technical indicator to properly understand it. It was developed by William Blau as a technical indicator that measures the momentum of the price action, i.e. it measures the strength of the instrument, if it is strong or weak. It oscillates around the zero line so it is a momentum oscillator indicator. A signal line can be used with it to get additional buying or selling signals based on the crossover between these line. However, we can get signals based on the TSI line only, based on its crossover with the zero level. If it is above the zero line, it means a bullish momentum and if it is below zero, it means a bearish momentum. It can be used to detect overbought and oversold areas and to detect bullish and bearish divergences. Since we know that we need to confirm its signals in order to increase the weight of evidence, it is better to use it accompanied by other technical tools, which we should use in the same context of the price action to get better insights.
Now let us see how to calculate this indicator. The calculation is performed in several steps, which are:
Calculate the double-smoothed momentum:
- Calculating the momentum (price change) by subtracting the previous price from the current price
- Calculating the first smoothing by getting the 25-period EMA of the calculated momentum
- Calculating the second smoothing by getting the 13-period EMA of the first smooth (25-period EMA of the calculated momentum)
Calculate the double-smoothed absolute momentum:
- Calculating the absolute momentum by subtracting the absolute previous price from the absolute current price
- Calculating the first smoothing by getting the 25-period EMA of the calculated absolute momentum
- Calculating the second smoothing by getting the 13-period EMA of the first smooth (25-period EMA of the calculated absolute momentum)
Calculate TSI = 100*( Double-smoothed momentum / Double-smoothed absolute momentum)
This calculation will result in an oscillating line around zero measuring the momentum of the price action and detecting overbought and oversold areas as we mentioned and others.
A Custom Simple TSI indicator
The MQL5 programming language has a lot of predefined technical indicators and we can use them in our systems by using the predefined function. We already talked about a lot of such indicators in previous articles in this series, discussing how we can design a trading system based on these popular technical indicators. You can check the previous articles and maybe find something useful. The question now is how we can create an indicator if it does not exist as in the standard platform delivery package or even if it exists how we can create a customized indicator to get the desired signals or triggers. The short answer is to create a custom indicator by using the main programming language and this is what we will do in this part.
We will learn how to create our custom True Strength Index indicator using MQL5. Then we will use its features in other systems or EAs. The following steps are for creating this custom indicator.
Creating additional parameters by using the #property and next to it we will specify the identifier value and the following are these parameters that we need to specify:
- (indicator_separate_window) — to show the indicator in a separate window.
- (indicator_buffers) — to specify the number of buffers of the indicator, we will specify (8).
- (indicator_plots) — to specify the number of graphic series in the indicator, we will specify (1).
- (indicator_label1) — to set the label for the number of the graphic series, we will specify (TSI).
- (indicator_type1) — to specify the type of graphical plotting by specifying a value from the ENUM_DRAW_TYPE values, we will specify (DRAW_LINE).
- (indicator_color1) — to specify the color of the indicator's line that is displayed, we will specify (clrBlue).
- (indicator_style1) — to specify the style of the line of the indicator, we will specify (STYLE_SOLID).
- (indicator_width1) — to specify the thickness of the line of the indicator, we will specify (3).
#property indicator_separate_window
#property indicator_buffers 8
#property indicator_plots   1
#property indicator_label1  "TSI"
#property indicator_type1   DRAW_LINE
#property indicator_color1  clrBlue
#property indicator_style1  STYLE_SOLID
#property indicator_width1  3
We need to include the MovingAverage.mqh file to use its component in our calculation and this file is existing in the Include file by using the #include command. Make sure that you write the name of the file the same as the name of the file.
#include <MovingAverages.mqh> We need to set two inputs of smoothing periods that we will use in the calculation of the indicator by using the input class to enter these values by the user if he needs to update the default values that are specified in the program. After that, we will determine the data type of the variables (InpSmPeriod1, InpSmPeriod2) that we need to declare by using uint which is the unsigned integer. Then we will assign (25) to InpSmPeriod1 and (13) to InpSmPeriod2 as default values.
input uint     InpSmPeriod1   =  25;    // Smoothing period 1
input uint     InpSmPeriod2   =  13;   // Smoothing period 2
Creating two integer variables for smoothing periods (smperiod1,smperiod2).
int            smperiod1;
int            smperiod2;
Creating seven arrays for the indicator buffers
double         indBuff[];
double         momBuff[];
double         momSmBuff1[];
double         momSmBuff2[];
double         absMomBuff[];
double         absMomSmBuff1[];
double         absMomSmBuff2[];
Inside the OnInit () function we will do the following steps:
Declaring variables of (smperiod1,smperiod2) by returning the value of 2 if the user input of InpSmPeriod1 and InpSmPeriod2 is less than 2 or returning the InpSmPeriod1 and InpSmPeriod2 values if there is something else.
   smperiod1=int(InpSmPeriod1<2 ? 2 : InpSmPeriod1);
   smperiod2=int(InpSmPeriod2<2 ? 2 : InpSmPeriod2);
Binding the indicator buffers with arrays by using the (SetIndexBuffer) function. Its parameters are:
index: to set the number of the indicator buffer and numbers starting with 0 to 7 in our program.
buffer[]: to specify the array declared in the custom indicator.
data_type: to specify the type of data stored in the indicator array.
   SetIndexBuffer(0,indBuff,INDICATOR_DATA);
   SetIndexBuffer(2,momBuff,INDICATOR_CALCULATIONS);
   SetIndexBuffer(3,momSmBuff1,INDICATOR_CALCULATIONS);
   SetIndexBuffer(4,momSmBuff2,INDICATOR_CALCULATIONS);
   SetIndexBuffer(5,absMomBuff,INDICATOR_CALCULATIONS);
   SetIndexBuffer(6,absMomSmBuff1,INDICATOR_CALCULATIONS);
   SetIndexBuffer(7,absMomSmBuff2,INDICATOR_CALCULATIONS);
Setting the value of the corresponding indicator property, this indicator property (prop value) must be of a string type by using the (IndicatorSetString) function with the variant of calling with specifying the property identifier only. This step is for setting a short name for the indicator and determining periods to show in the top left part of the indicator window. Its parameters:
- prop_id: to specify the identifier of the indicator property which will be one of the (ENUM_CUSTOMIND_PROPERTY_STRING) enumeration. It will be (INDICATOR_SHORTNAME) in our program.
- prop_value: to specify the value of the property which will be a string data type. It will be "True Strength Index ("+(string)smperiod1+","+(string)smperiod2+")".
IndicatorSetString(INDICATOR_SHORTNAME,"True Strength Index ("+(string)smperiod1+","+(string)smperiod2+")");
Setting another value of the indicator property in an integer data type to normalize the value of the indicator as per digits by using the (IndicatorSetInteger) with the variant of calling with specifying the property identifier only. Its parameters
- prop_id: to specify the identifier of the indicator property which will be one of the (ENUM_CUSTOMIND_PROPERTY_INTEGER) enumeration. It will be (INDICATOR_DIGITS) in our program.
- prop_value: to specify the value of the property which will be an integer data type. It will be Digits().
IndicatorSetInteger(INDICATOR_DIGITS,Digits());
Setting the AS_SERIES flag to the array by using the (ArraySetAsSeries).
   ArraySetAsSeries(indBuff,true);
   ArraySetAsSeries(momBuff,true);
   ArraySetAsSeries(momSmBuff1,true);
   ArraySetAsSeries(momSmBuff2,true);
   ArraySetAsSeries(absMomBuff,true);
   ArraySetAsSeries(absMomSmBuff1,true);
   ArraySetAsSeries(absMomSmBuff2,true);
After the OnCalculate function,
- We will set the AS_SERIES flag to the close array from the OnCalculate part then checking if rates_total is less than 2 to return 0.
- Creating an integer variable (limit) to be equal to (rates_total-prev_calculated).
- Checking if the limit variable is greater than 1, in which case we need to do the following steps:
- Updating the limit variable with the result of (rates_total - 2).
- Initializing numeric arrays of double type by a preset value by using the (ArrayInitialize) function. Its parameters are array[] to specify the numeric array that should be initialized and the other parameter is value to specify the new value that should be set.
   ArraySetAsSeries(close,true);
   if(rates_total<2)
      return 0;

   int limit=rates_total-prev_calculated;
   if(limit>1)
     {
      limit=rates_total-2;
      ArrayInitialize(indBuff,EMPTY_VALUE);
      ArrayInitialize(momBuff,0);
      ArrayInitialize(momSmBuff1,0);
      ArrayInitialize(momSmBuff2,0);
      ArrayInitialize(absMomBuff,0);
      ArrayInitialize(absMomSmBuff1,0);
      ArrayInitialize(absMomSmBuff2,0);
     }
Creating a loop to update the momBuff[i], absMomBuff[i]. New functions that were used in this step are:
- (for) loop operation with its three expressions and an executable operator.
- IsStopped() to check if there is a forced shutdown of the mql5 program.
- MathAbs to return the absolute value(modulus) and we can use febs() function for the same result.
   for(int i=limit; i>=0 && !IsStopped(); i--)
     {
      momBuff[i]=close[i]-close[i+1];
      absMomBuff[i]=MathAbs(momBuff[i]);
     }
Checking the following using the ExponentialMAOnBuffer function from the (MovingAverage) Include file.
   if(ExponentialMAOnBuffer(rates_total,prev_calculated,0,smperiod1,momBuff,momSmBuff1)==0)
      return 0;
   if(ExponentialMAOnBuffer(rates_total,prev_calculated,0,smperiod1,absMomBuff,absMomSmBuff1)==0)
      return 0;
   if(ExponentialMAOnBuffer(rates_total,prev_calculated,smperiod1,smperiod2,momSmBuff1,momSmBuff2)==0)
      return 0;
   if(ExponentialMAOnBuffer(rates_total,prev_calculated,smperiod1,smperiod2,absMomSmBuff1,absMomSmBuff2)==0)
      return 0;
Creating another loop to update the indBuff[i] variable by using the for function
   for(int i=limit; i>=0 && !IsStopped(); i--)
      indBuff[i]=(absMomSmBuff2[i]!=0 ? 100.0*momSmBuff2[i]/absMomSmBuff2[i] : 0);
At the end of the program, there is the return (rates_total) function
return(rates_total); So now we finished the code to create our TSI custom indicator and you can also edit your preferences to your code for more customizations. The following is for the full code in one block of this created indicator:
//+------------------------------------------------------------------+
//|                                                   simple TSI.mq5 |
//|                                  Copyright 2023, MetaQuotes Ltd. |
//|                                             https://www.mql5.com |
//+------------------------------------------------------------------+
#property copyright "Copyright 2023, MetaQuotes Ltd."
#property link      "https://www.mql5.com"
#property version   "1.00"
#property indicator_separate_window
#property indicator_buffers 8
#property indicator_plots   1
#property indicator_label1  "TSI"
#property indicator_type1   DRAW_LINE
#property indicator_color1  clrBlue
#property indicator_style1  STYLE_SOLID
#property indicator_width1  3
#include <MovingAverages.mqh>
input uint     InpSmPeriod1   =  25;    // Smoothing period 1
input uint     InpSmPeriod2   =  13;   // Smoothing period 2
int            smperiod1;
int            smperiod2;
double         indBuff[];
double         momBuff[];
double         momSmBuff1[];
double         momSmBuff2[];
double         absMomBuff[];
double         absMomSmBuff1[];
double         absMomSmBuff2[];
int OnInit()
  {
   smperiod1=int(InpSmPeriod1<2 ? 2 : InpSmPeriod1);
   smperiod2=int(InpSmPeriod2<2 ? 2 : InpSmPeriod2);
   SetIndexBuffer(0,indBuff,INDICATOR_DATA);
   SetIndexBuffer(2,momBuff,INDICATOR_CALCULATIONS);
   SetIndexBuffer(3,momSmBuff1,INDICATOR_CALCULATIONS);
   SetIndexBuffer(4,momSmBuff2,INDICATOR_CALCULATIONS);
   SetIndexBuffer(5,absMomBuff,INDICATOR_CALCULATIONS);
   SetIndexBuffer(6,absMomSmBuff1,INDICATOR_CALCULATIONS);
   SetIndexBuffer(7,absMomSmBuff2,INDICATOR_CALCULATIONS);
   IndicatorSetString(INDICATOR_SHORTNAME,"True Strength Index ("+(string)smperiod1+","+(string)smperiod2+")");
   IndicatorSetInteger(INDICATOR_DIGITS,Digits());
   ArraySetAsSeries(indBuff,true);
   ArraySetAsSeries(momBuff,true);
   ArraySetAsSeries(momSmBuff1,true);
   ArraySetAsSeries(momSmBuff2,true);
   ArraySetAsSeries(absMomBuff,true);
   ArraySetAsSeries(absMomSmBuff1,true);
   ArraySetAsSeries(absMomSmBuff2,true);
   return(INIT_SUCCEEDED);
  }
int OnCalculate(const int rates_total,
                const int prev_calculated,
                const datetime &time[],
                const double &open[],
                const double &high[],
                const double &low[],
                const double &close[],
                const long &tick_volume[],
                const long &volume[],
                const int &spread[])
  {
   ArraySetAsSeries(close,true);
   if(rates_total<2)
      return 0;

   int limit=rates_total-prev_calculated;
   if(limit>1)
     {
      limit=rates_total-2;
      ArrayInitialize(indBuff,EMPTY_VALUE);
      ArrayInitialize(momBuff,0);
      ArrayInitialize(momSmBuff1,0);
      ArrayInitialize(momSmBuff2,0);
      ArrayInitialize(absMomBuff,0);
      ArrayInitialize(absMomSmBuff1,0);
      ArrayInitialize(absMomSmBuff2,0);
     }
   for(int i=limit; i>=0 && !IsStopped(); i--)
     {
      momBuff[i]=close[i]-close[i+1];
      absMomBuff[i]=MathAbs(momBuff[i]);
     }
   if(ExponentialMAOnBuffer(rates_total,prev_calculated,0,smperiod1,momBuff,momSmBuff1)==0)
      return 0;
   if(ExponentialMAOnBuffer(rates_total,prev_calculated,0,smperiod1,absMomBuff,absMomSmBuff1)==0)
      return 0;
   if(ExponentialMAOnBuffer(rates_total,prev_calculated,smperiod1,smperiod2,momSmBuff1,momSmBuff2)==0)
      return 0;
   if(ExponentialMAOnBuffer(rates_total,prev_calculated,smperiod1,smperiod2,absMomSmBuff1,absMomSmBuff2)==0)
      return 0;
   for(int i=limit; i>=0 && !IsStopped(); i--)
      indBuff[i]=(absMomSmBuff2[i]!=0 ? 100.0*momSmBuff2[i]/absMomSmBuff2[i] : 0);
   return(rates_total);
  }
After compiling this code without errors, we will be find the indicator among available ones in the Indicators folder in your navigator by dragging it and dropping on the desired chart, we will find the window of the indicator and the inputs the same as the following:
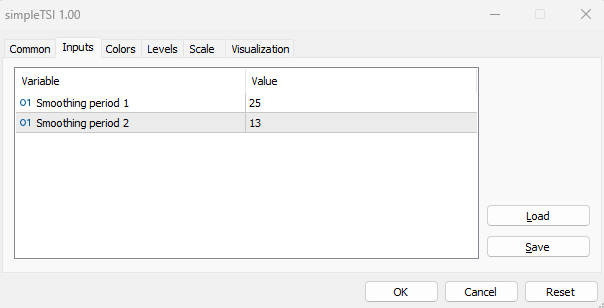
So, we have two inputs that the user can determine and the default values are 25 for the smoothing period 1 and 13 for the smoothing period 2. But still, the user can edit them as per his preferences as we mentioned.
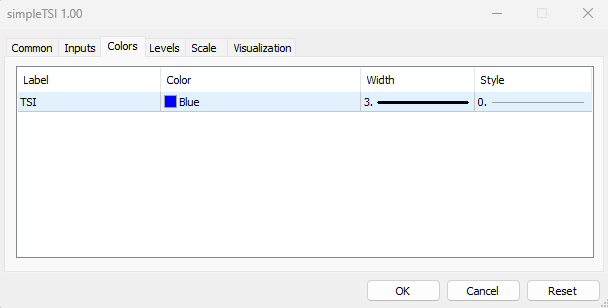
We can see in the previous picture in the colors tab that the user can choose the color, width, and style of the TSI line. After determining our preferences inputs and style of the indicator the same as we mentioned we can find the indicator on the chart the same as the following:
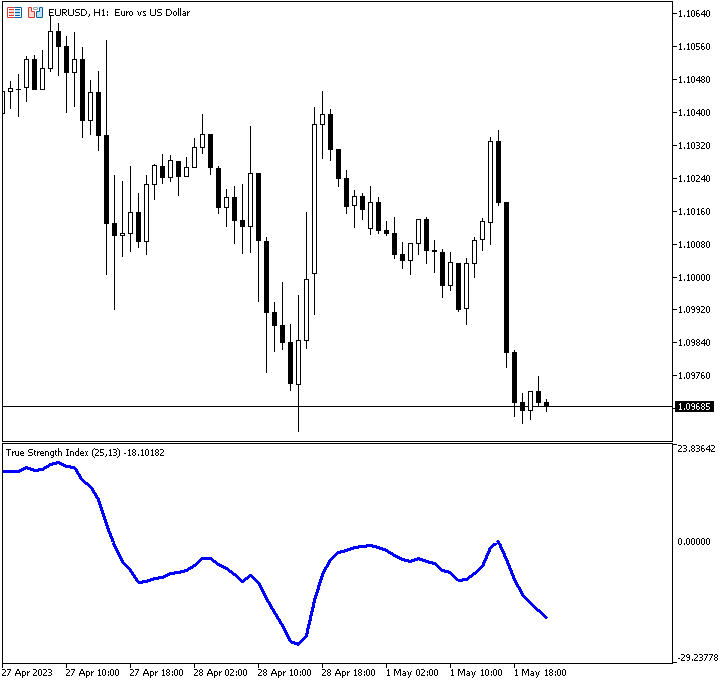
As we can see in the previous chart that we have the TSI indicator line in a separate window below prices and this line oscillates around zero. And we have the label of the indicator, its smoothing periods, and the value of the indicator.
A Custom TSI EA
In this part, we will learn in a very simple way how to use our custom indicator in an automated system so that it can generate a specific signal or action once a specific condition is triggered. We will start by creating a very simple system by creating an Expert Advisor, which will generate a comment on the chart with the TSI current value, before developing an EA that executes more complex instructions.
So, below are the steps required to create our Expert Advisor:
- Creating an integer variable of (TSI).
- Defining the TSI by using the iCustom function to return the handle of the indicator and its parameters are:
- symbol: to specify the symbol name, we will use _Symbol to be applied for the current symbol.
- period: to specify the timeframe, we will use _period to be applied for the current timeframe.
- name: to specify the path of the custom indicator.
- Printing the text of "TSI System Removed" in the OnDeinit(const int reason) part once the EA is removed.
- Create an array of tsiVal[]
- Getting the data of the buffer of the TSI indicator by using the CopyBuffer function with the variant of calling by the first position and the number of required elements. Its parameters are:
- indicator_handle: to specify the indicator handle returned by the indicator, we will use (TSI).
- buffer_num: to specify the indicator buffer number, we will use (0).
- start_pos: to specify the starting position to copy, we will use (0).
- count: to specify the data count to copy, we will use (1).
- buffer[]: to specify the array to copy, we will use (tsiVal).
- Using the Comment function to show the current TSI value converted to a string by using the (DoubleToString) function with parameters of value to specify the current TSI value and digits to specify the number of digits, we will use (_Digits) for the current one.
The full code will be the same as the following:
//+------------------------------------------------------------------+
//|                                           customSimpleTSI-EA.mq5 |
//|                                  Copyright 2023, MetaQuotes Ltd. |
//|                                             https://www.mql5.com |
//+------------------------------------------------------------------+
#property copyright "Copyright 2023, MetaQuotes Ltd."
#property link      "https://www.mql5.com"
#property version   "1.00"
int TSI;
int OnInit()
  {
   TSI=iCustom(_Symbol,_Period,"My Files\\TSI\\simpleTSI");
   return(INIT_SUCCEEDED);
  }
void OnDeinit(const int reason)
  {
   Print("TSI System Removed");
  }
void OnTick()
  {
   double tsiVal[];
   CopyBuffer(TSI,0,0,1,tsiVal);
   Comment("TSI Value ",DoubleToString(tsiVal[0],_Digits));
  }
After compiling this code with errors and executing it, it will be attached to the chart. The following is an example of its signal from testing:
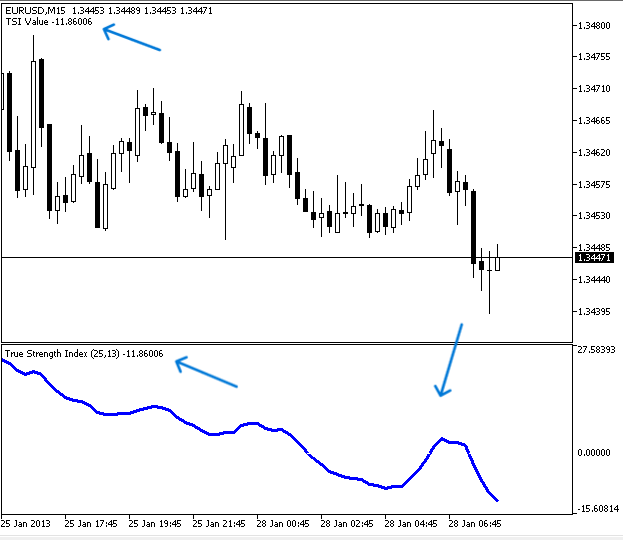
As we can see that we have a comment in the top left chart with the current TSI value. If we want to make sure that the signal is the same that we have based on the indicator we can attach the EA and inset the indicator at the same time to be values. The following is for that to make sure of our work:
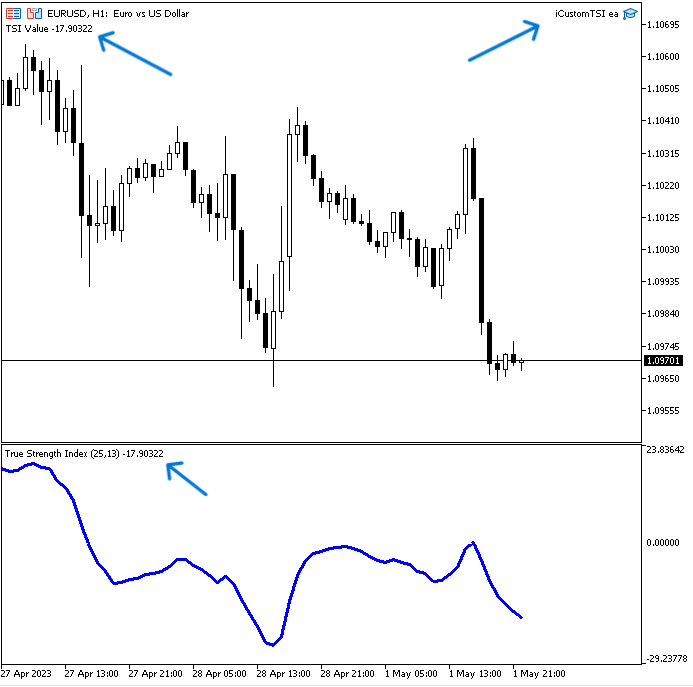
As we can see in the top right we have the EA attached and its signal appears in the top left corner with the current TSI value at the same time we have the TSI indicator inserted into the chart as a separate window below prices and its value above its line in the left corner is the same as the EA signal.
TSI System EA
In this part, we will develop an EA based on the created custom TSI indicator to get signals based on a specific strategy. Please note that the strategy we are going to discuss is intended for educational purposes only. It will in any case need optimizations, just like any other strategy. So you must test it before using it for a real account to make sure it is useful for you.
We will use the custom TSI indicator combined with the two moving averages to get buy and sell signals based on a specific strategy and it is the same as the following:
We will use two simple moving averages one is fast with a period of 10 and the other is slow with a period of 20 in addition to our custom TSI indicator. If the previous fast MA value is less than the previous slow MA and at the same time the current fast MA is greater than the current slow MA, this means that we have a bullish MA crossover then we will check if the current TSI value is greater than zero we need to get a buy signal as a comment on the chart. If the previous fast MA value is greater than the previous slow MA and at the same time the current fast MA is less than the current slow MA, this means that we have a bearish MA crossover then we will check if the current TSI value is less than zero we need to get a sell signal as a comment on the chart.
Simply,
If the fastMA[1]>slowMA[1] && fastMA[0]<slowMA[0] && tsiVal[0]<0 ==> Sell Signal
The following is the full code to create this type of system:
//+------------------------------------------------------------------+
//|                                                TSI System EA.mq5 |
//|                                  Copyright 2023, MetaQuotes Ltd. |
//|                                             https://www.mql5.com |
//+------------------------------------------------------------------+
#property copyright "Copyright 2023, MetaQuotes Ltd."
#property link      "https://www.mql5.com"
#property version   "1.00"
input ENUM_MA_METHOD inpMAType = MODE_SMA; //Moving Average Type
input ENUM_APPLIED_PRICE inpPriceType = PRICE_CLOSE; //Price type
input int inpFastMAPeriod = 10; // Fast moving average period
input int inpSlowMAPeriod = 20; //Slow moving average period
int tsi;
double fastMAarray[], slowMAarray[];
int OnInit()
  {
   tsi=iCustom(_Symbol,_Period,"My Files\\TSI\\simpleTSI");
   return(INIT_SUCCEEDED);
  }
void OnDeinit(const int reason)
  {
   Print("TSI System Removed");
  }
void OnTick()
  {
   double tsiVal[];
   CopyBuffer(tsi,0,0,1,tsiVal);
   int fastMA =iMA(_Symbol,_Period,inpFastMAPeriod,0,inpMAType,inpPriceType);
   int slowMA =iMA(_Symbol,_Period,inpSlowMAPeriod,0,inpMAType,inpPriceType);
   ArraySetAsSeries(fastMAarray,true);
   ArraySetAsSeries(slowMAarray,true);
   CopyBuffer(fastMA,0,0,3,fastMAarray);
   CopyBuffer(slowMA,0,0,3,slowMAarray);
   if(fastMAarray[1]<slowMAarray[1]&&fastMAarray[0]>slowMAarray[0])
     {
      if(tsiVal[0]>0)
        {

         Comment("Buy Signal",
                 "\nTSI Value ",DoubleToString(tsiVal[0],_Digits),
                 "\nfastMA ",DoubleToString(fastMAarray[0],_Digits),
                 "\nslowMA ",DoubleToString(slowMAarray[0],_Digits));
        }
     }
   if(fastMAarray[1]>slowMAarray[1]&&fastMAarray[0]<slowMAarray[0]&&tsiVal[0]<0)
     {
      if(tsiVal[0]<0)
        {
         Comment("Sell Signal",
                 "\nTSI Value ",DoubleToString(tsiVal[0],_Digits),
                 "\nfastMA ",DoubleToString(fastMAarray[0],_Digits),
                 "\nslowMA ",DoubleToString(slowMAarray[0],_Digits));
        }
     }
  }
Differences in this code are the same as the following:
Create four inputs by the user for the moving average type, for applied price type, the fast MA period, and the slow MA period, and assign default values for them.
input ENUM_MA_METHOD inpMAType = MODE_SMA; //Moving Average Type
input ENUM_APPLIED_PRICE inpPriceType = PRICE_CLOSE; //Price type
input int inpFastMAPeriod = 10; // Fast moving average period
input int inpSlowMAPeriod = 20; //Slow moving average period
Creating two arrays for fast MA array, and slow MA.
double fastMAarray[], slowMAarray[]; Defining the two moving averages by using the predefined iMA function to return the handle of the moving average and its parameters are:
- symbol: we will use _Symbol to be applied to the current one.
- period: we will use _period to be applied for the current time frame.
- ma_period: we will use the input by the user for the fast and the slow MAs.
- ma_shift: we will use (0) as there is no need for shifting.
- ma_method: we will use the input by the user for the MA type.
- applied _price: we will use the input by the user for the price type.
   int fastMA =iMA(_Symbol,_Period,inpFastMAPeriod,0,inpMAType,inpPriceType);
   int slowMA =iMA(_Symbol,_Period,inpSlowMAPeriod,0,inpMAType,inpPriceType);
Setting the AS_SERIES flag by using the ArraySetAsSeries function for the slow and fast MAs
   ArraySetAsSeries(fastMAarray,true);
   ArraySetAsSeries(slowMAarray,true);
Getting data from the buffer of the two moving averages by using the CopyBuffer function
   CopyBuffer(fastMA,0,0,3,fastMAarray);
   CopyBuffer(slowMA,0,0,3,slowMAarray);
Defining the strategy conditions,
In case of buy signal:
If the previous fastMA is less than the previous slowMA and the current fastMA is greater than the current slowMA and at the same time the current tsiVal is greater than zero, we need the EA to return the buy signal as a comment on the chart the same as the following order:
- Buy Signal
- TSI Value
- The fastMA value
- The slowMA value
   if(fastMAarray[1]<slowMAarray[1]&&fastMAarray[0]>slowMAarray[0])
     {
      if(tsiVal[0]>0)
        {

         Comment("Buy Signal",
                 "\nTSI Value ",DoubleToString(tsiVal[0],_Digits),
                 "\nfastMA ",DoubleToString(fastMAarray[0],_Digits),
                 "\nslowMA ",DoubleToString(slowMAarray[0],_Digits));
        }
     }
In case of sell signal:
If the previous fastMA is greater than the previous slowMA and the current fastMA is less than the current slowMA and at the same time the current tsiVal is less than zero, we need the EA to return the sell signal as a comment on the chart the same as the following order:
- Sell Signal
- TSI Value
- The fastMA value
- The slowMA value
   if(fastMAarray[1]>slowMAarray[1]&&fastMAarray[0]<slowMAarray[0]&&tsiVal[0]<0)
     {
      if(tsiVal[0]<0)
        {
         Comment("Sell Signal",
                 "\nTSI Value ",DoubleToString(tsiVal[0],_Digits),
                 "\nfastMA ",DoubleToString(fastMAarray[0],_Digits),
                 "\nslowMA ",DoubleToString(slowMAarray[0],_Digits));
        }
     }
After compiling this code without errors and dragging and dropping it to be executed to get its signals we can find its window the same as the following for the Inputs tab:
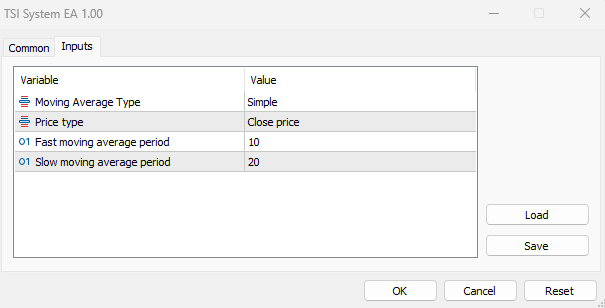
As we can see as we have the four inputs of the MA type, price type, the fast MA period, and the slow MA period. After setting our preferences and pressing OK we can find that the EA is attached to the chart and its signals will be the same as the following:
In case of buy signal
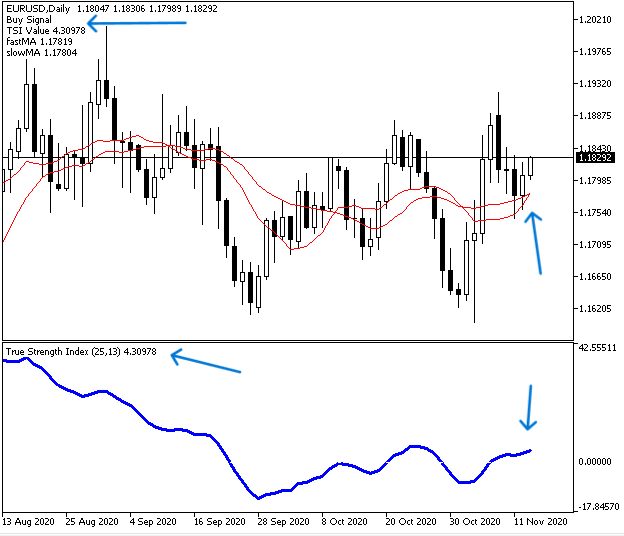
As we can see in the previous chart we have a buy signal as a comment in the top left corner as per our strategy conditions the same as the following:
- Buy Signal
- TSI Value
- The fastMA value
- The slowMA value
In case of sell signal:
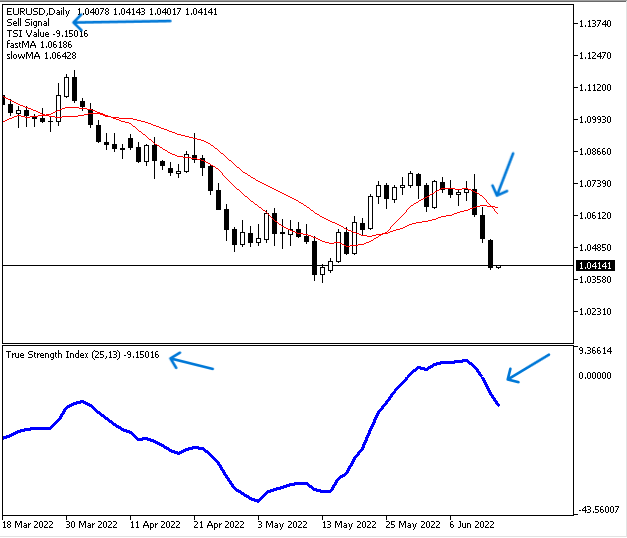
As we can see in the previous chart we have a sell signal as a comment in the top left corner as per our strategy conditions. the same as the following:
- Sell Signal
- TSI Value
- The fastMA value
- The slowMA value
Conclusion
In this article, we learned how you can create your own True Strength Index technical indicator to implement your specific settings and preferences. We have seen which information and insights this indicator provides, which can be very helpful in trading. We learned also how we can use this customized indicator in a simple trading system to generate the current value of the TSI indicator as a comment on the chart. We have also seen how to use the indicator in an automated trading system by creating the EA which utilizes the TSI data combined with another technical tool, which in our case is the moving average. This combination of the custom TSI and two moving averages generated buy and sell signals based on a specific strategy, which we considered in detail in the topic of TSI System EA.
I hope that this article will be useful for your trading and programming learning. If you want to read other articles about indicators and to learn how to create trading systems based on the most popular technical indicator, please see my previous articles, in which I cover popular indicators such as the moving average, Bollinger Bands, RSI, MACD, Stochastics, parabolic SAR, ATR, and others.
- Free trading apps
- Over 8,000 signals for copying
- Economic news for exploring financial markets
You agree to website policy and terms of use
First, thanks for the article.
Though please correct if I am wrong, I could see only 7 indicator buffers being created, but there are 8 declared
Did you mis-calculate?
Hi great paper,
why do you fill in smperiod 1 in the bottom 2 functions and not 0.