MetaTrader 5용 새 기술 지표 - 9

The Smart Liquidity Profile is color-coded based on the importance of the traded activity at specific price levels, allowing traders to identify significant price levels such as support and resistance levels, supply and demand zones, liquidity gaps, consolidation zones, Buy-Side/Sell-Side Liquidity and so on. Smart Liquidity Profile allows users to choose from a number of different time periods including 'Auto,' 'Fixed Range,' 'Swing High,' 'Swing Low,' 'Session,' 'Day,' 'Week,' 'Month,' 'Quart

BUY INDICATOR AND GET EA FOR FREE AS A BONUS + SOME OTHER GIFTS! ITALO LEVELS INDICATOR is the best levels indicator ever created, and why is that? Using high volume zones on the market and Fibonacci the Indicator works on all time-frames and assets, indicator built after 7 years of experience on forex and many other markets. You know many levels indicators around the internet are not complete, does not help, and it's difficult to trade, but the Italo Levels Indicator is different , the Ital

TREND HARMONY MT5 – Multi Timeframe Trend and Phase and Pullback Level Visualizer indicator for Metatrader5 The TREND HARMONY indicator automates deep trend analysis and generates visualizations for you. Take control of your trades by eliminating uncertainty! Revolutionize your trading experience with precision and insight through the TREND HARMONY Multi Timeframe indicator – your ultimate MT5 trend visualization indicator. [ Features and Manual | MT4 version | All Products ]
Are you t

The GGP Chandelier Exit Alert MT5 Indicator is a volatility-based indicator that identifies stop loss exit points for long and short trading positions. Chandelier Exit is based on the Average True Range (ATR) indicator. It is designed to keep traders in the trend until a defined trend reversal happens. Traders use CE to maximize their returns in a trade and make stop loss exit decisions. It is based on the principle that a trend reversal is highly probable when the price of an asset moves agains

Exclusive Limited Time Offer! Grab this useful indicator for a lifetime at just $49. Volatility indicator dashboard designed to revolutionize how traders perceive and navigate market volatility. Track volatile for multiple currency pairs one at time for multiple timeframes. Works best with Forex Market, Gold, Silver, Oil. Available in MT4, MT5. Indicator Features: Multi-Symbol, Multi-Timeframe Dashboard: Gain a strategic advantage by simultaneously monitoring volatility across various currenc

Are you tired of trading without a clear direction ? Do market fluctuations and noise leave you feeling overwhelmed ?
Here is the solution you've been searching for! Imagine an indicator that simplifies trading, cuts through market noise, and provides crystal-clear signals. The Heiken Ashi OHLC Indicator does just that!
What does the Heiken Ashi OHLC Indicator do? It transforms traditional candlestick charts into a trader's dream. Instead of dealing with erratic price movements, you'll wi
FREE

"If you're using it, give it a rating."
MBFX Timing is a (MetaTrader 5) indicator and it can be used with any forex trading systems / strategies for additional confirmation of trading entries or exits. The MBFX Timing Indicator is a momentum oscillator that tells about the overbought and oversold levels. Like many other oscillators, the Indicator fluctuates between certain levels. These levels are 0 and 100. When the price is near 100, it’s an overbought level, while near 0 signifies an overs
FREE
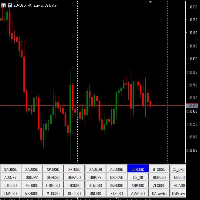
"Symbol Changer" is an indicator created for the Metatrader 5 (MT5) platform, providing the ability to change symbols. To perform all operations with this indicator, use the following characteristics:
Characteristics: Installation: To install the indicator on the MT5 platform, place your .mq5 code in the Indicators folder and restart MT5. Visualization: On the chart, the "Symbol Changer" indicator places special buttons to change symbols. Initial Settings: There are no additional settings for
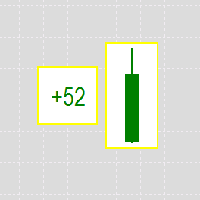
This Indicator shows the trend of movement. If the candle is red, you need to look for Buy signals. If the candle is Red, then look for a Sell signal.
The indicator is especially suitable for scalping.
When trading, take into account risk management.
For trading, I recommend the timeframe M5 M30
Good luck to all ))
If you have any questions, please contact us at +77767238899
Email dilshodaka25@gmail.com

To get access to MT4 version click here . This is the exact conversion from TradingView: "Trendlines with Breaks" by LuxAlgo
This is a REPAINT indicator. Buffers are available for processing. However there are objects on chart to process also. All input fields are available. Alerts are generated based on bars closure. You can message in private chat for further changes you need. Thanks for downloading

The GGP Trendlines with Breaks Alert MT5 Indicator is a technical analysis tool that can assist investors in identifying market trends. The indicator returns pivot point based trendlines with highlighted breakouts. Users can control the steepness of the trendlines as well as their slope calculation method. This indicator is MT5 conversion of the Trendlines with Breaks Indicator by “ LuxAlgo “ in Trading View website and some alert methods are added to provide real-time alerts when a trading sign

The "Angel Algo" indicator, designed for the TradingView platform, is a powerful technical analysis tool that assists traders in identifying dynamic support and resistance levels in real-time. It provides valuable insights into potential breakout points and market regimes.
At its core, the "Angel Algo" indicator utilizes a rolling window of price data to calculate maximum and minimum price levels. It then dynamically identifies support and resistance levels by examining specific conditions re

GIVE A LOOK TO MY OTHER PRODUCTS ! 100 % PER MONTH PROFIT---- MY NEW SIGNAL HERE -------> https://www.mql5.com/en/signals/2162238?source=Site+Signals+My# Smoothed MA cross alert,is a cool indicator that notificate you directly on your telephone or email when 2 Smoothed Moving average ( you choose the parameters ) crosses. This is very important when you want to know a change of trend and you can't stay in front of your pc! The indicator give you the alert just when the next bar opens ,so give

Introducing our groundbreaking indicator designed to elevate your trading strategy! Unlock the power of precise volume analysis with Buy, Sell, and Neutral indicators. Tailor your approach with customizable levels based on timeframes and moving average methods.
Key Features: Dynamic Volume Insights Instantly identify Buy, Sell, and Neutral volumes for informed trading decisions. Gain clarity on market sentiment like never before. Adaptable Level Configuration Customize and adapt levels to matc

Introducing our cutting-edge product, an innovative MACD Oscillator with a dynamic level enhanced by a decimal point Moving Average (MA) also with the versatility of multiple moving average modes. This advanced trading tool brings precision and flexibility to your technical analysis, offering a seamless experience for traders seeking a competitive edge in the financial markets.
Key Features: Dynamic Level Precision Our MACD Oscillator is equipped with a dynamic level feature, providing traders

Introducing our revolutionary intra-day trading indicator, meticulously crafted to optimize your trading insights within the 24-hour market cycle. Immerse yourself in historical data with precision using two distinctive modes - "All History" and "Last X Hours."
Key Features: All History Mode Uncover a comprehensive view of the day's dynamics. Instantly analyze the preceding day's high and low, 50% mid-point, and the open versus close price for the current day. Decode critical patterns to infor

안녕하세요, 이것은 빙입니다. ICT 개념을 거래하기 위한 신뢰할 수 있는 지표를 찾고 있다면, ICT Market Structure는 보다 고급 전략을 사용하는 트레이더들을 위한 사용자 매뉴얼을 제공합니다. 이 올인원 지표는 ICT 개념(스마트 머니 개념)에 초점을 맞추고 있습니다. ICT Market Structure는 기관들이 어떻게 거래하는지 이해하려고 하며, 그들의 움직임을 예측하는 데 도움이 됩니다. 이 전략을 이해하고 활용함으로써, 트레이더들은 시장 움직임에 대한 귀중한 통찰력을 얻고 가격 행동에 기반한 더 실용적인 진입 및 청산 포인트를 찾을 수 있습니다. 다음은 일부 기능에 대한 간단한 소개입니다: 비재페인팅, 비리드로잉, 비래깅 지표 오더 블록(상승 및 하락), 볼륨 메트릭스와 얼럿이 있는 오더 블록 실시간 시장 구조와 스윙 구조 고점과 저점(HH, HL, LL, LH)과 얼럿이 있는 구조 붕괴(BOS), 성격 변화(CHoCH)/ 모멘텀 변화(MS) 브레이커 블록

모모포인트는 차트에 롱, 숏 진입/추가 포인트를 표시하는 지표입니다.
모멘텀과 추세 강도를 바탕으로 모모포인트는 위험 대비 보상 비율이 좋은 항목/추가를 보여줍니다.
설정
----------------------------------
디자인: 신호의 색상, 크기 및 날개(그래픽 기호)를 조정할 수 있습니다.
신호 설정: 이동 평균 기간, 추세 강도, 이동 평균에서 가격까지의 거리 및 RSI 기간을 설정할 수 있습니다.
자산에 대한 올바른 값을 설정하기 위해 신호 값을 설명으로 표시할 수 있습니다. 또한 지표는 모든 거래 쌍이나 자산에 적합할 수 있습니다.
좋은 항목을 표시하려면 모든 자산에 고유한 설정이 필요합니다. 특정 쌍에 대한 설정이 필요하고 스스로 찾을 수 없는 경우, 제가 도와드릴 수 있습니다.
알람: 푸시 알림 및 사운드 음성 알림을 활성화할 수 있습니다.
신호는 다시 칠할 필요 없이 실시간으로 발생합니다.
추가 정
FREE
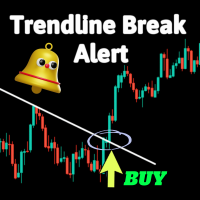
이것은 트렌드 라인 브레이크에 대한 경고를 제공하는 간단한 지표입니다.
거래에서 트렌드 라인을 사용하는 데 익숙한 경우 유용할 수 있습니다. 조정 가능한 매개 변수에는 다음이 포함됩니다.
캔들 식별기 : 브레이크 후 어느 캔들에 신호를 보낼지 그리고 3 종류의 경고 : 이메일 보내기 들을 수있는 경고음 푸시 알림
테스트 목적으로 MetaTrader 5의 전략 테스터가 트렌드 라인을 그릴 수 없으므로 MetaTrader 4를 사용하는 것을 권장합니다.
MT4 버전 : https://www.mql5.com/en/market/product/111112?source=Site+Market+My+Products+Page
전화에서 알림 경고를 설정하는 방법을 배우려면이 비디오를 시청하십시오 :
https://www.youtube.com/watch?v=4oO-3fMQ4QA
설치 가이드 :
https://www.mql5.com/en/blogs/post/739828

AI 지원 저항 지지선과 저항선을 검색하는 지표입니다. 검색은 수치 분석 및 데이터 처리를 위한 알고리즘을 사용하여 수행됩니다. 세 가지 검색 옵션을 사용할 수 있습니다("모드 #1", "모드 #2" 및 "모드 #3"). 이러한 각 옵션은 내부 알고리즘이 다릅니다(현재는 완전히 내부 설정이므로 사용자가 사용할 수 없습니다). 이러한 옵션은 검색 심각도에 따라 다르다고 말할 수 있습니다. 제한사항 : 현재 표시기에는 특정 최소 막대 수가 필요합니다. 막대가 충분하지 않으면 표시기를 찾으십시오. 자원 절약: 너무 자주 다시 계산하지 않고 컴퓨터의 계산 기능에 과부하가 걸리지 않도록 표시기는 30바마다 한 번씩 검색합니다. 라인 이름: 줄 이름에는 "sup_" 또는 "res_"가 있습니다. 기간과 내부 회선 번호도 있습니다.

Gold Levels MTF - this is a fine stock technical indicator. The indicator algorithm analyzes the movement of the asset price, displays price levels of support and resistance from all time frames (TF) using the Murray method based on the Gann theory. The indicator indicates overbought and oversold fields, giving an idea of possible reversal points and at the same time giving some idea of the strength of the current trend.
Description of levels: (Extreme Overshoot) - these levels are the ultimat

The new update makes this indicator a complete tool for studying, analyzing and operating probabilistic patterns. It includes: On-chart Multi-asset percentage monitor. Configurable martingales. Twenty-one pre-configured patterns, including Mhi patterns and C3. An advanced pattern editor to store up to 5 custom patterns. Backtest mode to test results with loss reports. Trend filter. Hit operational filter. Martingale Cycles option. Various types of strategies and alerts. Confluence between patter

The MasterOBV indicator is a powerful technical analysis tool that utilizes volume, positive correlation, and a Moving Average (MA) to enhance trend identification in financial markets. By incorporating assets with positive correlation through the indicator menu, MasterOBV provides a refined approach to assessing the strength and direction of trends. The inclusion of the Moving Average adds additional smoothing to price movements, aiding in a more accurate tracking of the underlying trend over
FREE

The MasterOBV indicator is a powerful technical analysis tool that utilizes volume, positive correlation, and a Moving Average (MA) to enhance trend identification in financial markets. By incorporating assets with positive correlation through the indicator menu, MasterOBV provides a refined approach to assessing the strength and direction of trends. The inclusion of the Moving Average adds additional smoothing to price movements, aiding in a more accurate tracking of the underlying trend over

It makes it easier for you to trade by providing trend charts in all frames from bottom to top. If it touches the upward trend, it is a good opportunity to sell, and the target is the downward trend, and vice versa. If it touches the downward trend, it is a good opportunity to buy, and the target is the upward trend. It can automatically redraw the trend. You can monitor higher frames and trade on lower frames for speculation .

Transform your financial chart analysis with our innovative Candle Coloring Indicator. This powerful tool allows you to instantly visualize market trends based on closing prices relative to a customized average. Customized Coloring: Choose colors that best suit your analysis style. Highlight candles above the average in a vibrant color of your choice and candles below the average in another distinctive color. Adjustable Average: Tailor the indicator to your trading strategies by setting the aver
FREE
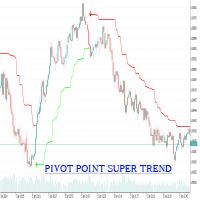
Introducing the Pivot Point SuperTrend MT5 version of the Trading View indicator by LonesomeTheBlue.
A revolutionary script designed to optimize your trading strategies by combining the power of Pivot Points with the precision of SuperTrend indicators. This unique algorithm offers an enhanced approach to identifying and staying within trends, delivering unparalleled performance in today's dynamic markets.
Key Features: Enhanced Trend Identification: By integrating Pivot Points and calculat

The BS Vwap 5 Bands indicator is an advanced tool that integrates price and volume data, providing a comprehensive view of market dynamics. Designed with a focus on performance and tested under real trading conditions, this indicator aims to deliver valuable insights to traders. Its innovative approach combines VWAP with five distinct bands, revealing whether the price is aligned with the "fair price" and indicating overbought or oversold conditions. Additionally, the indicator offers visual cus
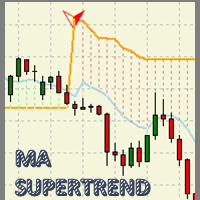
MA Super Trend MT5 An indicator based on the average maximum and minimum of a candle period, and next to the average true range (ATR) result in a powerful visual work tool to optimize the trend zones and potential areas of market entry. With great adaptability in any type of financial asset and with a potential for visual simplification in the graph, which will make the graph a simple work table. An indicator created to measure: - For MT5 desktop platform. - Great for Day trading, Swing Trading

Elevate Your Trading Experience with the famous UT Bot Alert Indicator!
Summary: The UT Bot Alert Indicator by Quant Nomad has a proven track record and is your gateway to a more profitable trading journey. It's a meticulously crafted tool designed to provide precision, real-time insights, and a user-friendly experience.
Key Features: 1. Precision Analysis: Powered by advanced algorithms for accurate trend identification, pinpointing critical support and resistance levels. 2. Real-time Ale

Trade Assistant MetaTrader System — a multi-timeframe system that is based on three standard indicators: Stochastic oscillator , RSI (Relative Strength Index), and CCI (Commodity Channel Index). It displays current trend directions for M1, M5, M15, M30, H1, H4, D1, W1, and MN1 timeframes. When you follow such an indicator you have a clear picture of the trends across all important timeframes. It doesn't matter which timeframe you attach this indicator to.
Input parameters CheckCandl

MP Price Change Indicator is a tool to calculate the price movement by percentage. The Value of this indicator can be adjusted to look back of the percent of price change within certain timeframes. This is a powerful tool when used by other indicators as well, such as ATR and ADR, for understanding price fluctuations and tolerance in different strategies. ___________________________________________________________________________________ Disclaimer:
Do NOT trade or invest based upon the analys
FREE

The Buyside & Sellside Liquidity indicator aims to detect & highlight the first and arguably most important concept within the ICT trading methodology, Liquidity levels. SETTINGS
Liquidity Levels
Detection Length: Lookback period
Margin: Sets margin/sensitivity for a liquidity level detection
Liquidity Zones
Buyside Liquidity Zones: Enables display of the buyside liquidity zones.
Margin: Sets margin/sensitivity for the liquidity zone boundaries.
Color: Color option

Индикатор PivotPointSuperTrend отлично показывает данные Тренд на основе мат данных от Pivot и ATR и очень удобен для входа в сделку и выставления стопов. Если кто то сможет добавить в код мултитаймфрем, я и многие пользователи будут очень Благодарны, то есть чтобы ондикатор показывал значение старшего таймафрема на графике младшего таймфрема, Заранее Спасибо!
FREE

Traders Dynamic Index (TDI) MetaTrader indicator — a comprehensive but helpful indicator that uses RSI (Relative Strength Index), its moving averages, and volatility bands (based on Bollinger Bands) to offer traders a full picture of the current Forex market situation. Here is single timeframe product. Once puscharse this indicator, you free to use MTF scanner (free at here ) The Traders Dynamic index TDI indicator is the next generation of the popular Trader Dynamic index indicator dev

Murrey Math Line X MetaTrader SYSTEM — a pivot line system that will definitely help every trader who knows how to trade with support, resistance, and pivot lines. It displays 8 primary lines (with 5 more additional ones) on the main chart, helping you to find the best points to sell, buy, and exit your positions. You can download this indicator for MT4 and MT5 platform. Input parameters Period (default = 64) — a period in bars or in other upper timeframe periods (set via the UpperTimeFrame

Market Profile MetaTrader System — is a classic Market Profile implementation that can show the price density over time, outlining the most important price levels, value area, and control value of a given trading session. This indicator can be attached to timeframes between M1 and D1 and will show the Market Profile for daily, weekly, monthly, or even intraday sessions. Lower timeframes offer higher precision. Higher timeframes are recommended for better visibility. It is also possible to use a
The Donchian Channel Indicator helps to identyfy the market trend and the breakouts of the channel. Breaking above means the momentum of the market is highly bullish. Breaking below means the momentum of the market is highly bearish.
SETTINGS: PERIOD - default value 20. The number of last candles beeing taken into account when generating the line. OFFSET - default value 0. The percentage number that makes the channel bigger or smaller. LINE_COLOR - default color is set Blue. Here you can set w

El indicador Global Average es una media móvil que difiere significativamente de las medias móviles tradicionales. Su función principal es proporcionar un precio objetivo de take profit que sirve como referencia para la estrategia de regresión a la media. Este manual detallará la estrategia de Venta/Compra basada en este indicador, que implica medir el primer impulso del precio despues de romper la media del indicador, luego avanzar con el nivel de Global Average , y vender/comprar cuando el pre

기본 캔들 패턴 인디케이터를 사용하면 주요 캔들 패턴을 그 어느 때보다 쉽게 식별할 수 있습니다. 해머, 이브닝 스타, 삼백수형 등 다양한 패턴을 차트에서 한 눈에 확인할 수 있습니다. 직관적인 인터페이스와 명확한 시각적 신호를 통해 빠르고 정확하게 거래 기회를 식별할 수 있습니다 / MT4 버전
이 보조지표용 대시보드 스캐너: ( Basic Candlestick Patterns Dashboard )
특징 정확성 : 주요 캔들 패턴을 자동으로 식별하여 수동 검색이 필요 없습니다. 사용자 지정 : 사용자 지정: 트레이딩 스타일에 맞게 트레이딩 선호도에 따라 매개변수를 조정할 수 있습니다.
하모닉 패턴 포함 상승 패턴 Hammer Inverse hammer Bullish engulfing Morning star 3 White soldiers 약세 패턴 Hanging man Shooting star Bearish engulfing Evening star 3 Black
FREE

혁신적인 기본 캔들 패턴 대시보드는 차트에서 수익성 있는 캔들 패턴을 자동으로 식별하도록 특별히 설계되었습니다. 이 대시보드는 고급 알고리즘을 사용해 실시간으로 가격 차트를 스캔하고 클래식부터 복잡한 패턴까지 다양한 캔들 패턴을 감지합니다. 또한 감지된 패턴을 다양한 시간대에 시각화할 수 있는 사용하기 쉬운 인터페이스가 있어 정보에 입각한 결정을 쉽게 내릴 수 있습니다 / MT4 버전
무료 보조지표: Basic Candlestick Patterns
하모닉 패턴 포함 상승 패턴 Hammer Inverse hammer Bullish engulfing Morning star 3 White soldiers 약세 패턴 Hanging man Shooting star Bearish engulfing Evening star 3 Black crows
표시기 열 Symbol: 선택한 기호가 표시됩니다. Pattern: 패턴 유형(해머, 역해머, 강세잉태형..

이것은 MACD를 기반으로 한 추세 추종 지표로, 200 MA를 기준으로 상위에 있을 때 매수 신호를 제공하고 하위에 있을 때 매도 신호를 제공합니다. MACD가 제로 라인을 교차할 때 신호가 생성됩니다. 이 지표는 또한 서포트 및 레지스턴스 레벨을 표시하며 이는 손절로 사용될 수 있습니다. 조절 가능한 매개 변수에는 MA 기간, MACD 빠른 EMA, 느린 EMA 및 서포트-레지스턴스 간격이 포함됩니다. 최근 양봉의 최저점과 최고점에 플로팅됩니다. 기본 설정: SR 간격: 10 MA 기간: 200 빠른 EMA: 24 느린 EMA: 26 알람 기능도 포함되어 있습니다. 이러한 값의 수정은 더 빈번하거나 덜 빈번한 신호로 이어질 수 있으며 가장 효과적인 구성을 결정하기 위해 테스트하는 것이 권장됩니다. 1 또는 4시간 프레임이 권장되지만 어떤 시간 프레임에서도 작동할 수 있습니다. 이 지표는 Forex, 주식, 상품 등을 포함한 모든 거래 도구에서 작동합니다. 다른 제품도 여기에서 확
FREE

Introducing the Quasimodo Genie, a powerful indicator for MetaTrader 5 that automatically identifies the Quasimodo or Over and Under pattern. This indicator is perfect for traders who want to take advantage of this popular chart pattern and make profitable trades. With the Quasimodo Genie, you can easily find the best swing points for the Quasimodo pattern and place virtual trades with stop loss and take profit levels. The Quasimodo Genie is easy to use and comes with a range of customizable set
FREE

The GGP SuperTrend MT5 Indicator is a technical analysis tool that can assist investors in identifying market trends. The indicator is based on ATR and is very useful for capturing the direction of an asset’s momentum and is widely employed when looking at stocks, currencies, and commodities. It plots a line on the price chart, which acts as a dynamic level of support or resistance, helping traders and investors make informed decisions about entry and exit points. This indicator is MT5 conversi

Created by imjesstwoone and mickey1984, this trade model attempts to capture the expansion from the 10:00-14:00 EST 4h candle using just 3 simple steps. All of the information presented in this description has been outlined by its creators, all I did was translate it to MQL5. All core settings of the trade model may be edited so that users can test several variations, however this description will cover its default, intended behavior using NQ 5m as an example. Step 1 is to identify our Price Ra

Overview:
The Custom_Timeframe_MAs indicator for MetaTrader 5 lets you study different timeframes using M1 candles. It offers 12 moving average methods for analyzing trends. Why It's Useful: Versatile Timeframes: Even though MetaTrader has fewer timeframes, this indicator expands options by using M1 candles. Various Moving Averages: Choose from 12 moving average types: SMA, EMA, DEMA,TEMA,WMA, VWMA,SMMA, HullMA, LSMA, ALMA, SSMA, TMA, to understand price movements better. For Automated Tradi

시장 강세 및 심리지표로 매매 결정을 최적화하고 더 이상 추세에 역행하는 트레이딩을 하지 마세요!
정확하고 시기 적절한 정보를 중요시하는 진지한 트레이더를 위해 세심하게 설계된 이 지표는 28개 주요 통화쌍을 매우 간단한 방법으로 한눈에 볼 수 있습니다. 이 도구는 인기도, 강세 또는 약세 추세 강도, 매수자 및 매도자 비율 / MT5 버전을 기준으로 통화쌍의 순위를 매길 수 있습니다.
특징 실시간 추세 강도: 각 통화쌍의 추세 강도를 정확하게 평가하여 거래 기회를 파악할 수 있는 확실한 가이드를 제공합니다. 매수자 및 매도자 분석: 각 통화쌍에 대한 매수 및 매도자 강세 순위를 통해 시장 역학에 대한 즉각적인 통찰력을 얻고 중요한 움직임을 예측할 수 있습니다. 트레이더 관심도: 각 통화쌍에 대한 트레이더 관심도 및 활동 데이터에 액세스하여 새로운 추세와 잠재적 전환점을 더 잘 이해할 수 있습니다. 직관적이고 사용자 지정 가능한 대시보드: 사용하기 쉬운 대시

이 제품은 표시기/신호 도구로부터 정보를 수신하고 특정 조건이 충족되면 화살표 또는 알림을 표시합니다.
예를 들어, MA25와 MA50이 교차할 때, SAR이 반전할 때, MACD가 플러스/마이너스를 변경하거나 종가가 볼린저 밴드를 교차할 때 화살표와 알림이 표시됩니다.
구체적인 구성은 샘플 설정 이미지를 참조하세요.
자세한 매뉴얼 및 구성 파일은 다음을 참조하세요.
https://www.mql5.com/en/blogs/post/755082
무료 버전도 다운로드할 수 있습니다.
화살표는 다양한 구성으로 표시될 수 있으며 조합은 상상만큼 무한합니다.
신호 도구 및 표시기에 대한 연결을 설정하는 데 문제가 있는 경우 당사에 문의하여 도움을 받으십시오.
또한 요청 시 스마트폰, 이메일, Slack, Line, Discord 등에 알림을 푸시하고, 최대 8개의 매개변수를 추가하거나 개별 지표에 연결할 수 있습니다. 신호 도구를 보완하거
FREE

One of the most powerful and important ICT concepts is the Power of 3. It explains the IPDA (Interbank Price Delivery Algorithm) phases. PO3 simply means there are 3 things that the market maker's algorithm do with price:
Accumulation, Manipulation and Distribution
ICT tells us how its important to identify the weekly candle expansion and then try to enter above or below the daily open, in the direction of the weekly expansion.
This handy indicator here helps you keep track of the weekly

Do you believe that financial markets and celestial bodies operate in separate realms? Our indicator begs to differ! Based on the innovative theory of William Gann, which emphasizes the influence of celestial planet movements on financial market dynamics, we present to you the "Gann Planetary Lines Indicator". Features of the Indicator : Precision : Accurate projection of the 360 degrees of planetary orbits onto price charts. Advanced Customization : Ability to display or hide any planet line,
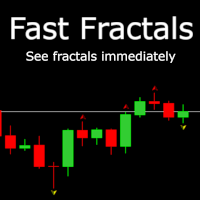
Info: It's like built in Fractals indicator but faster. Usually it shows the signal after 2 bars but FastFractals indicator shows signals immediately and that's is incredible. You can create scalp strategies with it or trade yourself. This indicator uses neural network to analyze price graph and predict. It was trained on 4 hours interval on EURUSD pair, but you can use it with different periods and instruments. There is only one minus in this indicator, it hasn't got 100% accuracy. See pictures

"Moving Ratio Candle" is used to check the distance of a candle to a theoretical pressure point. Furthermore, we have two points of interest, the first for the mean and the second for the median. This indicator uses the shape of bars and the line that crosses the bar from left to right is based on the calculation of the closing price for both sides. The rest follows a more standard calculation. The same could be done as a line, but I want to know the behavior of this indicator in relation to the
FREE

"Introducing Dynamic Supply and demand Pro – Your Ultimate Supply and Demand Trading Companion! Unleash the power of precision with this advanced indicator designed for traders seeking unparalleled market insights. Dynamic Supply and demand Pro dynamically identifies key reversal zones, showcasing the delicate dance between supply and demand forces.
This cutting-edge tool provides a comprehensive view of the market, highlighting potential turning points with pinpoint accuracy. Witness the ebb

The PUA MultiType Pivot indicator is built on the daily chart of the previous day. The PUA MultiType Pivot indicator is one of the most popular tools in technical analysis, used by traders to identify potential reversal points in financial markets. This indicator constructs three types of Pivot points: Classic, Fibonacci, and Camarilla, each offering its unique approach to market analysis. The advantages of this indicator include: Simplicity and Clarity PUA MultiType Pivot provides clearly defi

McS Super Trend -This is one of the most popular classic trend indicators. It has a simple setting, allows you to work not only with the trend, but also displays the stop loss level, which is calculated by this indicator. Benefits:
Instruments: Currency pairs , stocks, commodities, indices, cryptocurrencies. Timeframe: М15 and higher. Trading time: Around the clock. Shows the direction of the current trend. Calculates the stop loss. It can be used when working with trading. Three types of n
FREE
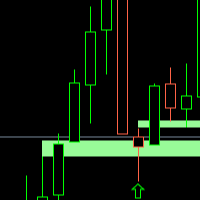
FVG WATCHER is an indicator that helps traders identify fair value gaps in the market. The indicator draws fair value gaps and alerts the user when the fair value gap has been swept. It allows users to specify how it should be swept, what time range to alert, and the size of the fair value gap to alert. It also allows the user to apply a moving average trend filter for better choice of alerts. The indicator also allows push mobile notifications. What makes FVG Watcher special is that it can be
Trend change detector is an indicator for Metatrader 5.It can help you determine the change in a local trend to open a correct position. It has 2 parameters. Period and mistake offset percent. You can change the period parameter to capture little changes in trend. There are two lines: the red one and the green one. You can use them as a local support and resistance level. Arrows show the change in a trend. Up arrow the price will go down and Down arrow the price will go up. Also, by changing m

Tatino Super Signals is Non Repaint Indicator for Binary Option trading and Forex trading. Recommendations:
Timeframe: All timeframes. For best results we recommend using it on M1, M5 and M15 timeframes. Currency pairs: All Pairs Account type: All Type Broker time: Any Brokers : Alls Binary Trading : Expired 1 Candle Buffer Buy=1, Sell=0, Entry Next Candle Recommended Forex trading stop loss : 15 pips Recommended Forex tradingTake profit levels : 15 pips
Specifications:
Does not repaint

RFX5 Bull Bear Powers indicator shows the absolute power of bulls and bears controlling the market. Both powers are shown simultaneously with red and green colors for bear and bull powers respectively. When red line goes over the green line it means that bears are controlling the market. When green line goes over the red line it means that bulls are controlling the market. The green/red horizontal symbol line at the bottom of the indicators shows which party has more strength. Time Frame: M3
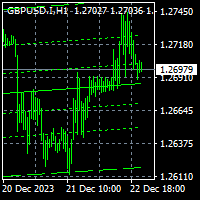
To get access to MT4 version click here . This is the exact conversion from TradingView: "Linear Regression Channel" by "LonesomeTheBlue". This is a repaint indicator. Buffers are not available for processing. You need to parse objects on chart. All input fields are available. You can message in private chat for further changes you need. Thanks for downloading

기본 공급 수요 지표는 시장 분석을 향상시키고 모든 차트에서 주요 기회 영역을 식별하는 데 도움이 되도록 설계된 강력한 도구입니다. 직관적이고 사용하기 쉬운 인터페이스를 갖춘 이 무료 메타트레이더 지표는 공급 및 수요 영역을 명확하게 볼 수 있어 보다 정보에 입각한 정확한 거래 결정을 내릴 수 있습니다 / 무료 MT4 버전 이 지표에 대한 대시보드 스캐너: ( Basic Supply Demand Dashboard )
특징
지표는 차트에서 공급 및 수요 영역을 자동으로 스캔하여 지루한 수동 분석이 필요하지 않습니다. 가장 가까운 공급 및 수요 구역까지의 남은 거리 그래픽 표시 공급 구역은 하나의 고유 한 색상으로 강조 표시되고 수요 구역은 다른 색상으로 표시되어 빠르고 정확한 해석이 용이합니다. 인디케이터는 가장 가까운 공급 또는 수요 구간과 차트상의 현재 가격 사이의 핍 단위 거리를 자동으로 계산하여 명확하고 정량화할 수 있는 기준을 제공합니다. 핍 단위의 거리가 차트에 명
FREE

이 대시보드는 선택한 기호에 대한 거래 전략에 따라 스캘핑 모드와 장기 모드 모두에서 차트의 공급 및 수요 영역을 검색하고 표시합니다. 또한 대시보드의 스캐너 모드를 통해 원하는 모든 기호를 한눈에 확인하고 적합한 위치를 놓치지 않도록 도와줍니다 / MT4 버전 .
무료 보조지표: Basic Supply Demand
특징 여러 통화쌍에 대한 거래 기회를 볼 수 있으며, 공급 및 수요 영역에 대한 근접성에 따라 순위가 매겨진 모든 쌍을 명확하고 간결하게 볼 수 있습니다. 색상부터 감지 매개변수까지 특정 요구에 맞게 사용자 지정 설정 가능
주요 입력 Indicator mode : 표시기 모드 또는 새로운 기능이 포함된 패널 모드 중에서 선택 가능 Symbols : "28개 주요 통화쌍" 또는 "선택한 심볼" 중에서 선택 Selected Symbols : 쉼표로 구분하여 모니터링하려는 원하는 심볼("EURUSD, GBPUSD, XAUUSD")을 선택합

마를리 인디케이터: MT4 및 MT5에서의 정밀 트레이딩 MT4 및 MT5에서 뛰어난 신호 정확성을 제공하는 마를리 인디케이터로 트레이딩을 향상시키세요. 이 다재다능한 도구는 암호화폐와 외환 시장에 최적화되어 있으며, 귀하의 트레이딩 전략에 정밀함과 유연성을 제공합니다. MT4와의 원활한 통합: MT4 플랫폼 사용자를 위해, 마를리 인디케이터는 완벽하게 호환되며 여기 에서 접근할 수 있습니다. 암호화폐 및 외환 시장 최적화: 암호화폐 우수성 : 마를리 인디케이터는 동적인 암호화폐 시장에 맞춰 특별히 조정되어, 암호화폐 트레이딩을 탐색하는 데 필수적인 정확하고 시기적절한 신호를 제공합니다. 외환 친화적 기본 설정 : 외환 시장에서도 마찬가지로 효과적이며, 다양한 시장 조건에서의 다용도성과 신뢰성을 위해 조정되어 있습니다. 주요 기능: 유연한 표시 옵션 : 시각적으로 두드러지는 화살표 또는 정보가 풍부한 텍스트 라벨 중에서 선호하는 신호 표시 방법을 선택하세요. 조절 가능한 감도

Cobra Pivot Points는 DEMO를 다운로드하여 직접 백테스트할 수 있는 가장 최적화된 피벗 포인트를 표시하는 지표입니다.
1. 두 가지 최고의 피벗 모드 선택: Cobra Pivots 또는 Camrilla Pivots
2. D1에 국한되지 않고 원하는 시간대를 사용할 수 있습니다.
3. Shift 매개변수를 사용하면 전일 고저 종가 값으로 플레이할 수 있습니다. 1 = 이전 막대, 2 = 이전 막대 앞의 막대 등. 이 매개변수는 피벗에 대한 연구 및 개발에 도움이 됩니다.
4. 레벨 터치 시 경고, 이메일 또는 푸시 알림을 한 번 누릅니다. 레벨을 터치하면 피벗 레벨이 완화된 것으로 간주되어 다시 경고하지 않습니다. 알림을 다시 받으려면 기간을 변경하여 알림을 재설정해야 합니다.
5. 선 색상, 선 스타일, 선 너비, 텍스트 색상 및 글꼴을 완전히 사용자 정의합니다.
Cobra Pivots는 LZone(스캘핑을 위해 매우 가까운 레벨)

Ai teulendeu seupoteo(D Originals).
oehwan-ui mollag.
ulineun jongjong "beulokeolijiga eotteohge don-eul beonayo?"lago mudgo, jag-eun geolaeeseo seunglihan geos-eul chughahabnida.
hajiman (D Originals)leul sayonghago namyeon "naneun eotteohge haluachim-e bujaga dwaessji?"lago jamunhage doel geos-ibnida.
So Deep, Action-eun mogsoliboda deo keuge malhabnida.
Ai Trend Spotterleul sayonghamyeon da-eum-eul dulyeowohaji maseyo.
*sijang jojag
*sijang banjeon
* jeogyeogsu jin-ib mich

An ICT fair value gap is a trading concept that identifies market imbalances based on a three-candle sequence. The middle candle has a large body while the adjacent candles have upper and lower wicks that do not overlap with the middle candle. This formation suggests that there is an imbalance where buying and selling powers are not equal. Settings Minimum size of FVG (pips) -> FVGs less than the indicated pips will be not be drawn Show touched FVGs Normal FVG color -> color of FVG that hasn't
FREE
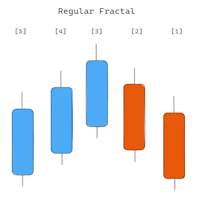
표시기는 더 높은 기간의 프랙탈을 표시합니다. 프랙탈에는 '일반 프랙탈'과 'BW 프랙탈'의 두 가지 유형을 표시할 수 있습니다. 프랙탈 'UP'의 형성을 고려하십시오. '일반 프랙탈'은 이후의 '고가'(중앙 막대의 왼쪽과 오른쪽)가 더 작은 매우 엄격한 프랙탈입니다. 반면 'BW Fractal'에는 단 하나의 조건이 있습니다. 중앙 막대(가격 '높음')가 가장 높아야 합니다. 시각적으로 이 두 모드의 차이점은 다이어그램 1에서 확인할 수 있습니다. '더 높은 기간' 매개변수는 현재 매개변수보다 커야 하며, 이 요구 사항이 충족되지 않으면 오류에 대한 설명이 포함된 경고가 발생하고 표시기가 작동하지 않습니다. 또한 최적화를 위해 새로운 바에서만 검색이 이루어집니다. 또한 '다운로드 기록 강제' 옵션도 무시할 수 없습니다. 이 옵션은 주말에 잘 작동합니다. 높은 시간대 기록을 강제로 다운로드합니다.

This is a simple order block locator. Searched for the existence of order blocks only at extremums. If you want multi criteria order block location check my other indicator which is more powerful here These order blocks are ICT order blocks without any buttering.
The indicator can be a useful tool for detecting reversals, continuations. You can also use the indicator as confluence with your other tools
FREE

Stochastic indicator alerts when EA Available in comments , must have indicator installed buys stochastic main line is above signal line stochastic is below 30 rsi 5 is below 20 sell stochastic main line is below signal line stochastic is above 70 rsi 5 is above 80 ADD to chart Stochastic k 30 - d 9 - slowing 3, levels 30/70 rsi 5 lelels 20.80
Full alerts push, mobile , email ect All input settings variable feel free to contact for more information or alert sugestions
FREE

This is a simple trend strenght indicator that is based on 5 moving averages on five diferente timeframes. As for now, the end user has no access to the SMA configurations but ill implement that on the future.
This indicator has 7 diferents trend indexes they are. Strong bearish, bearish, slighly bearish, normal, slighly bullish, bullish and strong bullish. You can change the gauge colors to better fit your taste and the chart background.
FREE
MetaTrader 마켓은 개발자들이 거래 애플리케이션을 판매할 수 있는 간단하고 편리한 사이트이다.
제품을 게시하고 마켓용 제품 설명을 어떻게 준비하는가를 설명하는 데 도움이 됩니다. 마켓의 모든 애플리케이션은 암호화로 보호되며 구매자의 컴퓨터에서만 실행할 수 있습니다. 불법 복제는 불가능합니다.
트레이딩 기회를 놓치고 있어요:
- 무료 트레이딩 앱
- 복사용 8,000 이상의 시그널
- 금융 시장 개척을 위한 경제 뉴스
등록
로그인
계정이 없으시면, 가입하십시오
MQL5.com 웹사이트에 로그인을 하기 위해 쿠키를 허용하십시오.
브라우저에서 필요한 설정을 활성화하시지 않으면, 로그인할 수 없습니다.