Regardez les tutoriels vidéo de Market sur YouTube
Comment acheter un robot de trading ou un indicateur
Exécutez votre EA sur
hébergement virtuel
hébergement virtuel
Test un indicateur/robot de trading avant d'acheter
Vous voulez gagner de l'argent sur Market ?
Comment présenter un produit pour qu'il se vende bien
Nouveaux indicateurs techniques pour MetaTrader 5 - 7

A tool for creating Bill Williams indicators Our tool provides the ability to set Bill Williams indicators on a chart with a mouse click. - The Awesome Oscillator (AO) indicator helps to assess the driving force of the trend. - Alligator indicator — determines the current state of the trend and possible entry and exit points. - Fractals indicator — helps to identify significant levels - Accelerator Oscillator (AC) indicator — shows the change in trend acceleration. - Market Facilitation Index
FREE

Discover the Power of the QDOTRAXY Indicator: Your Key to Precise Trading Decisions! Have you ever imagined having a powerful ally that combines advanced technical analysis with real-time alerts to maximize your market operations? We introduce ULTRA ADVANCED, the indicator that revolutionizes how you make buy and sell decisions. Why Choose QDOTRAXY? Unmatched Accuracy: QDOTRAXY combines multiple technical indicators (MACD, Bollinger Bands, SAR, and Moving Average) to generate highly reliable si
QUICKVIEW MT5 A simple indicator to instantly highlights asset variations, delivering crystal-clear market insights at a glance. Effortlessly track multiple assets with visual simplicity, enabling quicker, smarter, and more confident trading decisions daily.
Key Benefits Real-Time Asset Tracking :: Instantly monitor multiple assets simultaneously, never missing a critical market move. Flexible and Intuitive Display :: Personalize your view, displaying assets exactly as you want—clear, concise
FREE
The THREE DRAGONS is a technical indicator that portrays three mystical Chinese dragons flying through the price chart:
1. The Green Dragon (SeaGreen): - The most agile and fastest of the three - Reacts quickly to market direction changes - Usually leads the movements
2. The Red Dragon (Tomato): - Moves with balance between speed and caution - Confirms movements initiated by the Green Dragon - Its interactions with the Green Dragon may indicate opportunities
3. The Black Dragon (Black): - Th
FREE

This indicator overlays higher timeframe candles on the lower timeframe chart. You have option to make the candles Hollow (outline) or Solid (fill) for better visibility and analysis of your charts. You can easily change your chart timeframes ( to any lower timeframe than the indicator input) while using this indicator for true multi-timeframe analysis.
Features: Timeframes from 1 Min to 1 Month Minimal Inputs Customize candle body, color etc.
Inputs: Candles Period - Choose the timeframe f
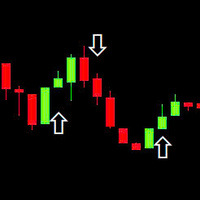
This indicator is based on the RSI (Relative Strength Index) to identify potential Breakout points and draw arrows on the chart to suggest buy/sell signals. Use RSI to find breakout signals. Draw Buy/Sell arrows on the chart. Send alerts when there is a trading signal. Buy (Orange Arrow - 0xFFAA00): When a buy signal appears. Sell (Blue Arrow - 0x0000FF): When a sell signal appears. DRAW_ARROW: Used to draw arrows on the chart.
FREE
This indicator collects and systematizes the data about the spread. Its code was profiling several times and optimized in such a way that despite the presence of graphics not to slow down the work of the MT5 terminal. In addition, the indicator provides for the mode of complete invisibility (while the indicator continues to collect data and save it). Having returned to the visual display mode, you can see the work done by him.
Advantages and capabilities of the SpreadFix indicator: 1. Collects
FREE

Maximisez vos performances de trading avec Dd-uP , un indicateur révolutionnaire basé sur un lissage EMA (Exponential Moving Average). Cet indicateur est représenté par une ligne jaune distincte sur vos graphiques, facilitant l'identification des tendances de marché et offrant des signaux de trading précis et fiables. Fonctionnalités clés : Lissage EMA avancé : Suivez les tendances du marché grâce à un lissage EMA qui réagit rapidement aux changements de prix, offrant une analyse précise et en t
A comprehensive MT5 trading performance indicator designed to provide real-time analytics of your trading activity on chart.
Key Features: - Dual tracking modes: Chart Symbol or Magic Numbers - Customizable display with toggle options for each metric - Adjustable font size for better visibility - Real-time updates with color-coded results
Performance Metrics: - Total Profit/Loss: Track overall performance - Total Trades: Monitor trading frequency - Win Rate: Measure trading success percentage
FREE

Checklist Indicator for MT5 Streamline your trading process with the Checklist Indicator —a powerful tool designed to keep you disciplined and organized. This indicator allows you to create and manage a personalized checklist directly on your chart, ensuring you follow your trading rules before entering a position. ️ Customize your own trading checklist
️ Stay consistent and avoid impulsive trades
️ Improve decision-making with structured analysis
️ Seamlessly integrates into your MT5 workfl
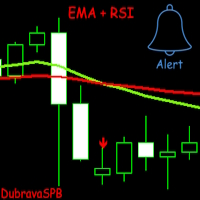
Introducing EMA + RSI – A Trading Indicator Combining Exponential Moving Average (EMA) and Relative Strength Index (RSI) Analysis. The indicator signals trade entries with arrows on the chart when two EMAs cross and the RSI meets the specified conditions.
It is initially optimized for the GBPUSD currency pair on the 1H timeframe, but users can customize it to fit their strategy. Key Features: Flexible settings: Users can adjust EMA length, choose the price for calculation, and configure RSI para

Utility of the Indicator Multifaceted Analysis : Allows for a comprehensive view of the market through different metrics (trend, volatility, momentum, risk, support/resistance). Trading Signals : Offers clear buy and sell signals, aiding traders in making entry and exit decisions. Risk Management : The risk buffer helps to assess when it is safe or risky to execute trading operations. Customizable Visualization : With multiple colors and chart styles, it becomes easy for the trader to interpre

Heiken Ashi Smoothed – The Ultimate Trend Filtering Indicator for MT5 Enhance Your Trading with Smoother Trends! The Heiken Ashi Smoothed indicator is a powerful tool designed for traders who want clearer trend signals while eliminating market noise. Unlike traditional Heiken Ashi candles, this smoothed version provides fluid, lag-free price action , making it perfect for swing trading, trend following, and long-term analysis. Key Features: Crystal-Clear Trends – Filters out market noise
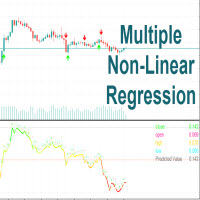
Multiple Non-Linear Regression This indicator is designed to perform multiple non-linear regression analysis using four independent variables: close, open, high, and low prices. Here's a components and functionalities: Inputs: Normalization Data Length: Length of data used for normalization. Learning Rate: Rate at which the algorithm learns from errors. Show data points: Show plotting of normalized input data(close, open, high, low) Smooth?: Option to smooth the output. Smooth Length: Length of
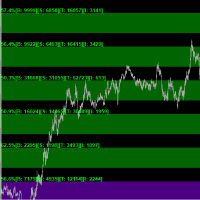
Key Features: • Multi-Zone Analysis: Track volume patterns across multiple customizable price zones • Real-Time Volume Tracking: Monitor buy/sell pressure as it develops • Dynamic Price Levels: Automatically adjusts zones around daily opening prices • Advanced Statistics: View detailed volume metrics and price action percentages
Technical Capabilities: • Volume Distribution Analysis - Buy/Sell volume ratios - Volume imbalance detection - Total trading activity monitoring - Price action directio
In the dynamic world of forex trading, technical analysis is an essential tool for traders seeking to navigate the complexities of the currency markets. One key element of this analysis is the interpretation of candlestick patterns, particularly the phenomenon of consecutive one-sided candles. These candles, characterized by a uniform direction — either completely bullish or bearish — offer significant insight into market sentiment and potential future movements. Understanding the implications o

Initialize RSI with period 2 above the closing price. Initialize EMA with period 20 above the closing price. Buy condition: RSI < 15 (oversold). Closing price of 4 consecutive candles > EMA (uptrend). Place BUY signal at the bottom of the candle. Sell condition: RSI > 85 (oversold). Closing price of 4 consecutive candles < EMA (downtrend). Place SELL signal at the top of the candle
FREE

AriMax – AI-Powered Trading Robot AriMax is a cutting-edge AI-powered trading robot designed to help traders maximize profits while minimizing risk. Utilizing advanced machine learning algorithms and real-time market analysis, AriMax identifies high-probability trade opportunities with precision and speed.
Key Features: AI-Driven Market Analysis – Analyzes market trends and patterns to make data-driven trading decisions.
Automated Execution – Places trades seamlessly with optimiz

One of the most accurate ways to predict price movements is to identify imbalances. When we identify significant price imbalances (aka fair value gaps or fvgs/ifvgs), it becomes relatively easy to place trades based on continuations and retracements. A moving average simply cannot give you anywhere near the precision we find when we observe the reaction of price to an imbalance. There are a few products on the market that claim to provide trading opportunities based on imbalances, but we believe

L'indicateur montre la direction de la tendance sur plusieurs périodes dans une seule fenêtre. Si la tendance de plusieurs périodes coïncide, des flèches sont dessinées. Vous pouvez également passer à l'histogramme, qui indique la tendance sur la période actuelle. L'indicateur dessine des points d'entrée et des points de sortie approximatifs sur le graphique.
Attention : comme l'indicateur est multi-frames, lorsqu'il est utilisé dans le testeur de stratégie, les cotations pour toutes les pério

L' Indicateur Volume Bar POC est un outil innovant qui offre une visualisation précise des niveaux de prix clés (Point of Control, POC) basée sur le volume des ticks. Cet indicateur analyse chaque point de prix dans les bougies individuelles et affiche les niveaux les plus significatifs, qui peuvent être utilisés comme zones fortes de support et de résistance. Idéal pour les stratégies de trading intraday et à long terme. Comment fonctionne l’Indicateur Volume Bar POC ? L’indicateur utilise un
ATR Power Levels Smart Support Resistance Indicator! What makes this indicator unique?
Unlike traditional support & resistance tools, ATR Dynamic Zones uses Adaptive ATR calculations to detect peaks & valleys with extreme accuracy. Once price breaks above or below a key level, the zone is automatically converted into a buy or sell area , giving traders a clear roadmap for smart entries & exits. How It Works:
Detects peaks & valleys dynamically using ATR-based price movement
Highli
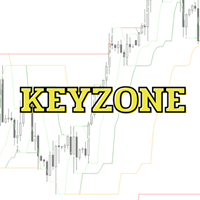
Keyzone est un indicateur conçu pour identifier les niveaux de support et de résistance , classés en quatre niveaux clés : 3, 8, 21 et 89. Ces niveaux sont issus d'une adaptation avancée du Smart Money Concept (SMC) , garantissant une grande efficacité tout en restant simple d'utilisation. Grâce à son design minimaliste mais puissant , Keyzone peut être appliqué à différents styles de trading, notamment :
Scalping – Opérations rapides et fréquentes Swing Trading – Capture des mouvements de prix
FREE

L'indicateur de cadre temporel Wormhole pour MetaTrader 5 (MT5) n'est pas qu'un simple outil de trading – c'est votre avantage compétitif sur les marchés financiers. Conçu pour les traders débutants comme professionnels, Wormhole transforme la manière dont vous analysez les données et prenez des décisions, vous garantissant toujours une longueur d'avance. Pourquoi vous avez besoin de l'indicateur Wormhole Surpassez la concurrence : La capacité de visualiser deux cadres temporels simultanément su
FREE
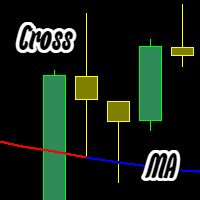
L’indicateur affiche une Moyenne Mobile (MA) bicolore : Bleu — le prix d’ouverture et de clôture de la bougie précédente est au-dessus de la ligne MA. Rouge — le prix d’ouverture et de clôture de la bougie précédente est en dessous de la ligne MA. Paramètres personnalisables : Type de MA (Simple, Exponentielle, Lissée, Linéaire); Période de la MA; Alerte lors du changement de couleur de la MA. Si quelque chose ne va pas, dites-le-nous pour corriger ! bar cross Moving cross candle cross Moving
FREE
The Channel Sgnals ProfRoboTrading Indicator for MT5 is an effective Forex trading tool designed to track market movements. The MT5 signal point indicator effectively detects trend reversals after they have already occurred. This Indicator is a fully automated technical tool that includes a number of parameters to track market trends. It automatically examines the ever-changing price dynamics of the market, compares the information with earlier data and generates a trading signal. Because
FREE
L'indicateur génère des signaux d'entrée pour les OPTIONS BINAIRES OU LE SCALPING FOREX, Normalement, sur le graphique, vous voyez une flèche qui peut apparaître ou disparaître sur la dernière bougie, c'est normal : l'indicateur traite les données et lit les conditions pour envoyer un signal d'entrée. Les conditions changent chaque seconde, donc le signal apparaît et disparaît. IL S'AGIT ESSENTIELLEMENT D'UN AVIS AU COMMERÇANT DE SE PRÉPARER car les conditions d'une éventuelle entrée se forment

The Extreme Spike PRT Indicator is an effective tool for identifying sharp market fluctuations . It performs its calculations using the ATR (Average True Range) indicator and displays candles with extreme volatility in two categories: primary spikes and secondary spikes , within the Metatrader platform oscillator window. This tool assists traders in detecting intense price movements and conducting more precise analyses based on these fluctuations. Time Frame 15-minute - 1-ho
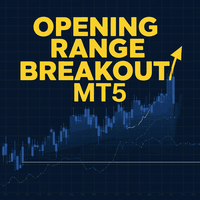
Tired of drawing opening range breakout line? Maximize your trading potential with the Range Breakout Indicator and the Opening Range Breakout (ORB) Indicator for MT5, two essential tools designed to enhance your trading strategy and boost your market performance. These powerful indicators allow you to profit from the explosive price movements that often occur at the opening of major stock indices, such as the DAX, DOW, NASDAQ, and S&P500. By leveraging the Opening Range Breakout Indicator, you

ZigZag Indicator for MT5
The ZigZag Indicator is a valuable tool available in MetaTrader 5, designed to highlight the highs and lows on a price chart. By marking pivotal turning points in price—commonly referred to as Pivot Highs and Lows (HH-HL-LH-LL)—it simplifies the process of identifying price trends. In any price movement, consecutive peaks and troughs are formed. Understanding these patterns correctly is essential for recognizing the direction of the overall market trend or short-term fl
FREE

Fair Value Gap (FVG) Indicator for MetaTrader 5
The Fair Value Gap (FVG) Indicator is an effective tool designed to spot trading opportunities in MetaTrader 5 by identifying imbalances in supply and demand. These imbalances, known as FVGs, emerge when the price moves aggressively. To explain simply, imagine three candlesticks: the gap between the first and third candlestick forms the " FVG ." This indicator highlights these gaps as dynamic boxes—green for bullish FVGs and red for bearish FVGs.
FREE
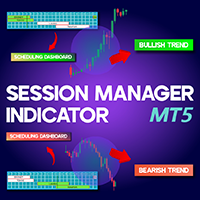
Session Manager Indicator MT5 Effective time management and understanding market activity are vital for traders in the fast-paced financial markets. Different trading symbols exhibit unique behaviors and levels of activity during specific time periods. The Session Time Manager indicator for MetaTrader 5 enables traders to monitor time and analyze price movements. This tool highlights key trading sessions—New York, London, Sydney, and Tokyo—by overlaying boxes on the price chart. «Indicator Insta
FREE

RSI on Moving Average Indicator for MT5
The RSI on MA Indicator integrates Moving Average Crossovers with the Relative Strength Index (RSI) to enhance trend detection and momentum analysis. By merging these technical elements, it improves precision in identifying market movements. The indicator displays two oscillating lines ranging from 0 to 100, making it easier to pinpoint buy and sell opportunities while clarifying trend directions. «Indicator Installation & User Guide» MT5 Indicator Instal
FREE
The Stochastic RSI (StochRSI) is a technical indicator that combines the characteristics of the Relative Strength Index (RSI) with the Stochastic Oscillator, resulting in a more sensitive tool that generates a higher number of trading signals. Developed by Tushar Chande and Stanley Kroll, the indicator was designed to overcome a perceived limitation of the traditional RSI: the low frequency of overbought and oversold levels activation (commonly 80 and 20), especially in less volatile assets. Ho
FREE

Summary
This indicator plots multiple pivot points (support and resistance levels) using various calculation methods, allows customization of their appearance, and can alert when price touches these levels. It works on different timeframes and can display historical levels or just the current ones.
Overview Purpose : Plots dynamic pivot levels (Pivot, S1-S4, R1-R4) on the chart to help identify potential price reversal zones. Key Features : Supports 7 calculation methods (Classic, Camarilla
Based on the Extreme Trend Indicator on Trading View converted for MT5. Usage of the Indicator is free, but if you want the source code, you can purchase the source code by messaging me.
Extreme Trend is an indicator that identifies when a new trend is forming and creates a trading signal. This indicator can be used for many markets, forex, gold etc. If you have any inquiries or want to create an EA using this indicator, you can message me.
FREE
GammaLevels Indicator! What makes this indicator unique?
Unlike traditional support & resistance tools, ATR Dynamic Zones uses Adaptive ATR calculations to detect peaks & valleys with extreme accuracy. Once price breaks above or below a key level, the zone is automatically converted into a buy or sell area , giving traders a clear roadmap for smart entries & exits. How It Works:
Detects peaks & valleys dynamically using ATR-based price movement
Highlig

Overview The Waterfall Trading Indicator is a powerful momentum detection tool designed to identify high-probability trading opportunities across multiple timeframes. Built on pure price action analysis, this indicator provides clear, non-repainting signals that are especially effective for binary options and forex trading. Key Features Non-Repainting Signals : Based on real-time price action, ensuring reliable trade signals Multi-Timeframe Compatibility : Effective across all timeframes, with o
As an ICT or SMC trader you must do top-down analysis, and you struggle to make template of drawing object on Metatrader just like you normally do on Tradingview. Well, Drawing Assistance indicator will make your top-down analysis much easier on Metatrader. Allow to design template for 3 timeframes. (HTF, MTF and LTF). Each objects drawn on chart will have the color, style and visibility individually by the timeframe it was drawn on. Save time as all analyzing is done on Metatrader chart. Shortc

Fibo Extrema Bands is a unique indicator that visually demonstrates when the market shifts into a trend and highlights key levels acting as support or resistance. It combines easy-to-read “stepped” extrema lines with Fibonacci levels (whose values can be adjusted in the indicator’s inputs), simplifying the search for entry and exit points. Install Fibo Extrema Bands to gain a powerful tool for trend analysis and for identifying critical price levels! This product is also available for MetaTrade
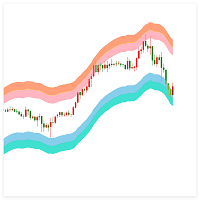
Indicator Introduction: The Volatility Range Indicator aims to help traders identify the current market's volatility range by analyzing historical price data. By calculating the upper and lower bounds of price fluctuations, traders can determine potential support and resistance levels, providing a foundation for subsequent trading decisions. This indicator is particularly suitable for ranging markets and high-volatility environments, as it can effectively assist traders in capturing price breako
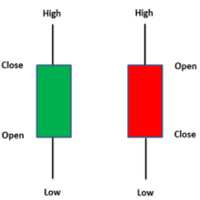
The indicator shows the strength of the trend if the green number is more than 50, you need to look for a signal to buy, and on the contrary, the red number is more than 50, you need to look for a sell,
The indicator is based on the Heiken Ashi candle
the indicator is suitable especially for scalping and medium-term trading
REMEMBER THE INDICATOR DOES NOT GUARANTEE A WINNER BUT IT HELPS TO MAKE CORRECT TRADING
THE RISK ON THE TRANSACTION WILL BE NO MORE THAN 3 PERCENT
FREE

This indicator is based on Mr. Mark Fisher's ACD strategy, based on the book "The Logical Trader."
- OR lines - A lines - C lines - Daily pivot range - N days pivot range - Customizable trading session - Drawing OR with the desired time Drawing levels A and C based on daily ATR or constant number - Possibility to display daily and last day pivots in color zone - Displaying the status of daily PMAs (layer 4) in the corner of the chart - Show the order of daily pivot placement with multi-day piv
FREE
The KT Dynamic Price Oscillator (DPO) offers a specialized approach to analyzing the trend, momentum, and volatility of financial instruments. It excels at identifying trend continuations, overbought or oversold conditions, and potential reversal points with precision. It is specifically designed to assist traders in identifying short-term price cycles and potential reversals by effectively filtering out long-term trends.
How to use the DPO
Trend Confirmation: The DPO acts as a reliable confir
Spike Phantom – Best Spike Detector for PainX and GainX Volatility Spikes (Non-Repainting)
Tired of missing explosive market spikes? Want a powerful tool designed for trading PainX & GainX spikes on WellTrade? Spike Phantom is the ultimate non-repainting spike detector built to capture high-impact market movements with precision and speed . Designed specifically for PainX and GainX and Synthetic Pairs , this indicator provides real-time alerts for perfect entry and exit points. VPS recommend
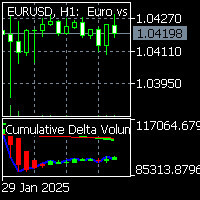
To get access to MT4 version please click here . This is the exact conversion from TradingView: "Cumulative Delta Volume" by "LonesomeTheBlue". The screenshot shows similar results from tradingview and Metatrader when tested on ICMarkets on both platforms. This is a light-load processing and non-repaint indicator. All input options are available. Buffers are available for processing in EAs. You can message in private chat for further changes you need. Thanks for downloading
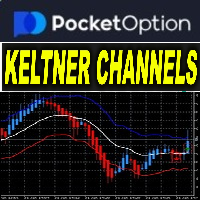
ocket Options Keltner Channel with MA v3.12 Indicator Name: Keltner Channel v3.12 – Advanced Trend and Signal Indicator
Version: 3.12
Release Date: 2024
Platform: MetaTrader 5 (MT5)
Category: Trend Indicators Overview
Keltner Channel v3.12 is a trend-following indicator that combines Keltner Channels with Moving Averages (MA1 and MA2) to identify breakouts, trend shifts, and momentum changes. This tool provides real-time buy and sell signals, visual markers, and alerts to assist traders in dec
Volonacci Indicator It is an indicator that combines Fibonacci and volume to determine the price direction This indicator helps you identify Fibonacci angles according to the strategy The Volonacci indicator is indeed an interesting combination of Fibonacci levels and volume. This indicator uses Fibonacci tools to identify potential support and resistance levels, and enhances this by using volume to confirm the strength behind the price action.
MT4 Version https://www.mql5.com/en/market/produ
VWAP Trend Pro (Volume Weighted Average Price) is a versatile trading tool that can be used effectively in several ways: This is an advanced Volume Weighted Average Price indicator that revolutionizes your trading experience by dynamically changing colors across scanned timeframes, providing real-time trend insights. The intuitive right corner scanner with three simple squares represents Monthly, Weekly, and Daily trends, each bordered by the current trend color and with background color indicat

very simple indicator to help with fast risk management during volatility.
~Displays: - stop loss in points of your choice. - take profit in points of your choice. - what lot size to risk on the trade relative percentage.
~Values that can be changed: - take profit points. - stop loss points. - risk in percentage. - color of lines. - width of lines. - linestyle. - buy / sell trade.
A simple Zig Zag indicator with added visualization of Higher High, Lower High, Higher Low, Lower Low. This indicator will be very helpful when working with support/resistance levels. The ZigZag indicator is a fundamental tool that will significantly help you navigate complex situations in the financial markets. By providing a clear visual representation of price movements and trends, it simplifies the analysis process and improves decision-making capabilities. Its role in identifying trends and
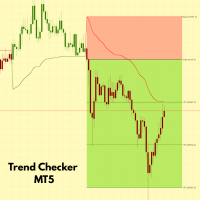
Trend Checker MT5 – Smart Indicator for Trend Detection and Optimal Trade Levels GammaTrend is an advanced technical analysis tool designed to help you trade with precision and confidence. This indicator leverages the Average True Range (ATR) and market closures to identify optimal entry points, set stop-loss levels, and determine potential profit targets. Key Features:
Clear Trend Identification – Helps you understand market momentum and direction.
Accurate Entry Signals – Use

Simple Japanese candlestick indicator
Contains 3 patterns: - bearish engulfing - bullish engulfing - doji
Only contains these 3 because after rigorous testing and trading (data) these seem to be the most efficient. Also contains: - alerts if enabled
When japanese candlestick is detected it is colored with relevant color depending on bias, and also shows label next to it. Labels: - BEG = Bearish engulfing - BE = Bullish engulfing - DO = Doji

Trend Strength Visualizer A Simple Tool for Trend Analysis This indicator helps you quickly assess the strength of market trends using fast and slow moving averages. It’s designed to give you a clear visual representation of the trend, so you can make better trading decisions. ~Displays: Green Line : Strong uptrend (potential buying opportunities). Red Line : Strong downtrend (potential selling opportunities). ~Values That Can Be Changed: Fast MA period. Slow MA period. Line color for uptrend an

The Previous High Low Levels indicator displays the high and low of the previous candle from a selected higher timeframe. This helps traders identify key support and resistance zones while trading on lower timeframes. Features:
Plots the previous high and low from a higher timeframe
Works on all timeframes and instruments
Helps identify strong support and resistance levels
Lightweight and does not repaint How to Use: Select a higher timeframe (e.g., H1, H4, D1) in the settings. T
FREE

The Matrix Series indicator analyzes price action, moving averages, and volatility to detect trending conditions. Bullish Trend: Green zones or upward signals indicate a strong uptrend, ideal for long positions. Bearish Trend: Red zones or downward signals suggest a downtrend, perfect for short positions. Sideways/Neutral Market: Non-highlighted or gray zones show periods of market consolidation or low momentum, helping you avoid false signals. Use Cases: Trend Confirmation: Use the indicator to

MACD Classic : Indicateur de Convergence/Divergence des Moyennes Mobiles pour MT5 Conçu pour les traders avancés à la recherche de précision et d’adaptabilité dans leurs stratégies de trading. Le MACD Classic est un indicateur technique personnalisé développé en MQL5 pour MetaTrader 5 , optimisé pour vous fournir des signaux clairs de convergence et de divergence des moyennes mobiles, vous aidant ainsi à identifier les tendances et les points d’entrée/sortie avec plus d’efficacité. Caractéristiq
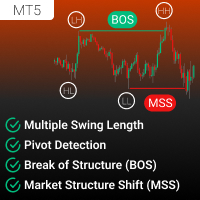
L'indicateur 1TF BOS/MSS est un outil puissant conçu pour analyser et visualiser la structure du marché directement sur une seule unité de temps sur votre graphique. Cet indicateur détecte avec précision les ruptures de structure de marché (BOS) et les changements de structure de marché (MSS), permettant aux traders d'identifier facilement les points de retournement clés et les continuités de tendance. Ses paramètres personnalisables et ses annotations détaillées en font un outil indispensable p

Cet indicateur dessine des zones d'offre et de demande sur le graphique. Associé à vos propres règles et techniques, cet indicateur vous permettra de créer (ou d'améliorer) votre propre système puissant. Veuillez également consulter la version payante qui offre bien plus. Ma recommandation est de rechercher des opportunités de trading où le premier test de zone se produit après au moins 25 barres. Caractéristiques Les zones ont 3 couleurs (réglables par entrée). Couleur foncée pour la zone n
FREE
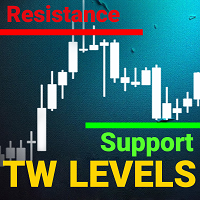
support resistance levels indicator mt5:
Cet outil est un indicateur multi-temporels qui identifie et trace les lignes de support et de résistance, ainsi que les niveaux de Fibonacci, sur un graphique avec la même précision que l'œil humain. Les niveaux de support et de résistance TW pour le forex disposent d'un algorithme complexe qui scanne le graphique pour identifier les niveaux précédents de stabilisation des prix et de rebond, en enregistrant le nombre de touches.
Êtes-vous fatigué de

VWAP FanMaster : Maîtrisez la stratégie de pullback avec précision !
VWAP FanMaster est l'indicateur ultime pour les traders à la recherche de points d'entrée précis et de pullbacks efficaces . Il combine la puissance de VWAP (Prix Moyen Pondéré par le Volume) et des lignes Fibonacci Fan , offrant une carte claire des zones d'intérêt du marché. Caractéristiques principales Simple mais puissant : Déplacez simplement les lignes verticales et l'indicateur trace automatiquement VWAP et les
FREE
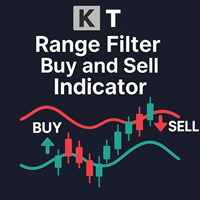
L’indicateur KT Range Filter Buy and Sell simplifie les petits mouvements et fluctuations de prix, les transformant en une tendance plus fluide et définie. Alors que le lissage QQE est généralement appliqué au RSI, cet indicateur applique le concept directement au prix, offrant une approche unique et efficace de l’analyse du marché.
Il présente une structure à trois bandes, composée d’une ligne moyenne principale entourée d’une bande supérieure et d’une bande inférieure. Ces bandes sont calcul

SlopeChannelB – un outil d'analyse technique qui construit un canal de évolution des prix incliné, offrant des opportunités uniques pour évaluer la situation actuelle du marché et trouver des signaux de trading. Caractéristiques principales de l'indicateur : Canal de mouvement des prix incliné :
L'indicateur aide à visualiser les niveaux de support et de résistance, qui peuvent indiquer des points de retournement potentiels ou des continuations de tendance. Couleurs variées des lignes et mi
Révolutionnez votre trading, débloquez les secrets de la dynamique du marché avec l'indicateur Predator Expansion Contraction Candles : Imaginez avoir le pouvoir de décoder le langage secret des marchés, pour anticiper les flux et reflux des mouvements de prix avec une précision incroyable. Bienvenue à l'indicateur Predator Expansion Contraction Candles, un outil révolutionnaire qui élève votre trading à de nouvelles hauteurs en fournissant des aperçus sans précédent des phases d'expansion et d

The Forex Gangster Indicator allows you to determine the current trend. If the Forex Gangster Indicator line has moved below the price and turned blue, then you should open deals for an increase. If the Forex Gangster Indicator line has appeared above the price and turned red, then you should open deals for a decrease: The indicator is suitable for any time frames, but it needs to be supplemented with filtering indicators, since by itself it is late and does not have time to give an accurate si
FREE

This indicator works by plotting fractals on the chart as arrows that can be used as buy or sell signals. It is a great tool for both new and experienced traders as it provides a clear visual representation of the market and helps traders identify fractals. Although it repaints, it can be used quite effectively in conjunction with other tools to filter trading strategies.
We use this indicator in this way in our Royal Fractals EA, which you can purchase on the MQL5 Market: https://www.mql5.com
FREE

The Teamtrader Channel Stop indicator allows you to determine the current trend. If the Teamtrader Channel Stop indicator line has moved below the price and turned blue, then you should open deals for an increase. If the Teamtrader Channel Stop indicator line has appeared above the price and turned red, then you should open deals for a decrease: The indicator is suitable for any time frames, but it needs to be supplemented with filtering indicators, since by itself it is late and does not have
FREE

The GoldenBufferPattern indicator uses several indicator buffers (Candles+Fractals+ZigzagColor+ColorMaLine).
The indicator is recommended to be used together with other indicators or using the Martinheim Method. We use this method with this indicator, as well as some of our other proprietary filters and trading strategies in particular, in our Experts Advisors on ProfRoboTrading.

Golden Trend Pulse — trend indicator developed specifically for Gold, also applicable to the Cryptocurrency and Stock markets. The indicator is designed for precise determination of market trends using advanced analytical methods. The tool combines multifactor analysis of price dynamics and adaptive filtering of market noise, ensuring high accuracy in identifying key entry and exit points. Thanks to its intelligent system, the indicator effectively handles market variability, minimizing false
Basic information. To perform its work, the indicator takes data on volumes from a lower timeframe, builds Market Profiles for a higher timeframe and a histogram for the current timeframe. The indicator starts in several stages. In this case, messages like: "Build Source & Target TF. Step: …" are output to the log. The process can be accelerated by changing the input parameter Milliseconds between steps - the initialization speed. The final value of this parameter is always individual and is set
Le MetaTrader Market offre un lieu pratique et sécurisé pour acheter des applications pour la plateforme MetaTrader. Téléchargez des versions démo gratuites de Expert Advisors et des indicateurs directement depuis votre terminal pour les tester dans le testeur de stratégie.
Testez les applications dans différents modes pour surveiller les performances et effectuez un paiement pour le produit que vous souhaitez en utilisant le système de paiement MQL5.community.
Vous manquez des opportunités de trading :
- Applications de trading gratuites
- Plus de 8 000 signaux à copier
- Actualités économiques pour explorer les marchés financiers
Inscription
Se connecter
Si vous n'avez pas de compte, veuillez vous inscrire
Autorisez l'utilisation de cookies pour vous connecter au site Web MQL5.com.
Veuillez activer les paramètres nécessaires dans votre navigateur, sinon vous ne pourrez pas vous connecter.