YouTubeにあるマーケットチュートリアルビデオをご覧ください
ロボットや指標を購入する
仮想ホスティングで
EAを実行
EAを実行
ロボットや指標を購入前にテストする
マーケットで収入を得る
販売のためにプロダクトをプレゼンテーションする方法
MetaTrader 5のための新しいテクニカル指標 - 7

DTFX Algo Zones are auto-generated Fibonacci Retracements based on market structure shifts.
These retracement levels are intended to be used as support and resistance levels to look for price to bounce off of to confirm direction.
USAGE Figure 1 Due to the retracement levels only being generated from identified market structure shifts, the retracements are confined to only draw from areas considered more important due to the technical Break of Structure (BOS) or Change of Character

Session Box Indicator for MetaTrader 5
Description: The SessionBox indicator is designed to visually represent the trading sessions on a chart, specifically the Asian, European, and American sessions. This indicator draws customizable rectangles around each session, allowing traders to easily identify different trading periods. It also includes labels to denote each session, enhancing clarity.
Users only need to input the session start and end hours in their server time. Please note, the As
FREE
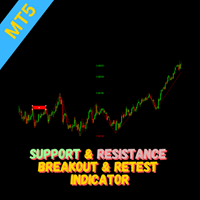
Overview The Breakout and Retest indicator is designed to identify potential trading opportunities by detecting price breakouts from significant support and resistance levels followed by a retest of the broken level. How it Works The indicator analyzes price data to determine key support and resistance areas. When the price decisively breaks through one of these levels and then retest it, then a potential breakout is signaled when it breakout again. To increase the probability of a successful t
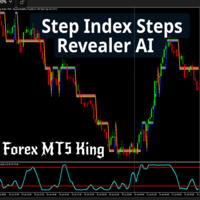
Unlock precision in your trading with the Step Index Steps Revealer AI . This advanced MT5 indicator is your ultimate tool for identifying key price levels on major forex pairs, including GBP/USD, EUR/USD, and others, as well as the step index
Key Features 1. Accurate Price Level Identification Plots precise key levels on major forex pairs like GBP/USD, EUR/USD, USD/JPY, and more. Ideal for traders looking to capitalize on bounce backs and breakouts with accuracy. 2. Optimized for Step Index C

Price and Spread Indicator
Version: 1.0 Developer: Creative Tech Solutions Website: https://www.creativetechsolutions.co.uk
Overview The Price and Spread Indicator is a great tool for MetaTrader 5 that displays the Ask and Bid prices along with the spread directly on the chart. This indicator provides real-time updates and allows traders to make informed decisions based on accurate price information.
Features - Real-time Price Updates: Continuously updates Ask and Bid prices. - Spread D
FREE

MT5用 サブウィンドウにスプレッドとBUY SWAP(BS)とSELL SWAP(SS)を表示するインジケーターです。
表示の文字フォントの大きさと色の設定、スプレッドの表示をPIPS表示もしくはPOINTS表示切替が可能ですので、チャートの色設定などに合わせて、お好みでご利用いただけます。 サブウィンドウの表示サイズに合わせて、その中央に表示するようになっています。
(ご協力お願いします!) こちらは無料でご利用いただけます。どうぞご自由にご利用ください。 もしよければ MS High Low indicator も紹介していますので、どうぞご参照の上、DEMO版のダウンロードをお試しください!
Happy Trading :)
FREE

Quantum Prime Indicator Take Note 1.This indicator works with additional license to prevent third party software from access. Kindly message me after purchase to receive license 2.You will get the quantum prime indicator for free after purchasing the Quantum prime EA.
The Quantum Prime Indicator is a cutting-edge trading tool designed to revolutionize your trading experience by integrating the powerful concepts behind the renowned Quantum Prime EA. This advanced indicator leverages sophistic
O delta volume é uma ferramenta poderosa utilizada em várias estratégias de operação, especialmente no trading de futuros, ações e criptomoedas. Aqui estão algumas das principais estratégias onde o delta volume é frequentemente aplicado: Identificação de Tendências : O delta volume ajuda a identificar a direção da tendência predominante, mostrando se há mais pressão de compra ou venda. Isso pode ser útil para confirmar a força de uma tendência ou identificar possíveis reversões. Confirmação de B

Elder Impulse Indicator Overview: The Elder Impulse Indicator is a powerful tool designed for traders who want to combine the strengths of trend-following and momentum strategies. Developed by Dr. Alexander Elder, this indicator helps traders identify potential entry and exit points by analyzing both price direction and momentum. It’s an essential tool for making informed decisions in various market conditions, whether you're trend-trading, swing trading, or looking for momentum shifts. Key Fea
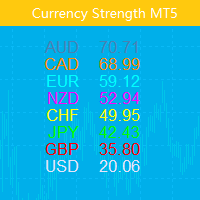
この指標は、8 つの主要通貨 (USD、EUR、GBP、AUD、NZD、CAD、CHF、JPY) の相対的な強さを示します。 力の値は 0 ~ 100 の範囲で正規化されます。 60 を超える値は強いことを意味します。 40未満の測定値は衰弱を示します。
チケット Only Show Current Pair - true の場合、現在のチャート ペアのみが表示されます。それ以外の場合は、8 つの曲線すべてが表示されます。 Bars To Show - フォース カーブを表示するバーの数。 Ma Periods To Smooth Curves : 強度曲線を平滑化するための移動平均期間 Suffix - 文字の接尾辞。今すぐインストールする必要はありません。 Font Size - 画像のフォント サイズ、デフォルトは 13 Row Space - 描画線間の間隔、デフォルトは 17 2 つの曲線が交差したときに警告を発するために、次の 3 つの入力が提供されます。 Select Cross at w
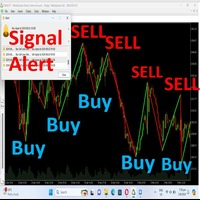
Hello Traders, *-For your bonus one indicator with SL,TP zone* just give your review, comment.Once finish developing I will give you**** Trend identification Indicator This is a indicator that will identify trend zone as bearish and bullish zone . This indicator can use for all pairs and any timeframe you can use it . *Green lime mean buy.Red line mean sell.You will receive alert sound when signal generate. The create best on high, low point and moving average calculation. You can customize valu
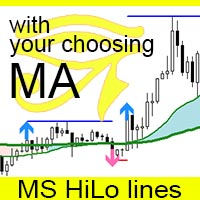
MS High Low Lines インジケーターは、MT5用のトレンドの可視化を向上させるために設計されたツールです。
設定でお好みの移動平均線(SMA もしくはEMAで、期間設定は自由)を使用して、その設定したMAを上抜け、下抜けしたときに設定したサインを表示させながら、高値と下値をラインで表示します。 機能性の高いMAで設定することで、市場のトレンドをより良く理解し、優位性あるトレード判断をすることができます。
設定を変更し、一つの画面に複数のインジケーターを設定することができますので、マルチタイムフレーム分析での活用も可能です。 特徴説明の動画もあわせてご参照ください。 ハッピートレーディング!(*'ω'*) ※ 現在は特価価格での提供です。 この機会をお見逃しなく!

無料ダウンロードは、当グループに参加してください。期間限定オファー! 私たちの革新的なMQL5インディケーターを紹介します。これは、ロータイムフレームでの日足キャンドルの境界を明確に視覚的に表示することで、トレーディング体験を向上させるために設計されています。このツールは、日足キャンドルの進行状況を把握し、より良い意思決定と戦略実行を確実にしたいトレーダーに最適です。 主な機能 日足キャンドルボックスの視覚化: ロータイムフレームで日足キャンドルの開始から終了までの明確なボックスを描画します。 日足キャンドルの開始点と終了点を明確にハイライトし、日々の市場動向を追跡するための視覚的な参照を提供します。 チャートの明瞭さの向上: きれいで整理されたチャートビューを提供し、トレーダーが画面を乱雑にせずに日々の境界を迅速に識別するのに役立ちます。 日々の取引活動の文脈で市場のトレンドやパターンを分析する能力を向上させます。 シームレスな統合: 既存のMQL5プラットフォーム設定に簡単に統合され、迅速なインストールと即時使用が可能です。 M1、M5、M15、M30、H1などの様々なロータイムフ

VolaMetrics VSA | 技術分析の強力な味方 VolaMetrics VSA は、 Volume Spread Analysis (VSA) メソッドと詳細な 取引量分析 を組み合わせた技術分析指標です。 価格の重要な動き を 特定 し、 追跡 するために設計されたこのツールは、 取引量 と 価格スプレッド の相互作用を利用して、トレーディング決定をサポートする貴重な洞察を提供します。 Volume Spread Analysis (VSA) の基礎 Volume Spread Analysis (VSA) は、技術分析で尊敬されているメソッドで、 取引量 、 価格スプレッド 、および 価格の終値 の関係を特定の期間内で理解することに焦点を当てています。最も情報を持つオペレーター( スマートマネー )が価格の動きに影響を与えるという考えに基づき、VSA は 積み上げまたは分配のシグナル を特定し、価格の重要な変化を予測します。 VolaMetrics VSA の機能 ️ VolaMetrics VSA は、従来の VSA 分析を自動化し、 逆転の可能性があるシ

Introducing the BOOM CRASH MASTER Indicator: Unleash the Power of Precision Trading! Step into the world of unparalleled trading with the BOOM CRASH Master Indicator, exclusively designed for the Boom and Crash indices offered by Deriv broker. This cutting-edge tool is your gateway to mastering the art of spike detection and anti-spike entries, ensuring you stay ahead of the market’s every move. Key Features: Precision Spike Detection: Harness the power of advanced algorithms to catch spikes wi
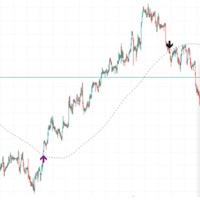
If the price is cutting above the slow length moving average, a breakout may occur. If the price is cutting below, a pullback may occur in the market. This was known for a long time, but there aren't many indicators which signal on the event. Candlestick pattern validation is also used in this indicator so that signals will not be drawn on doji candles or small "uncertainty" candles. The length of the moving average period can be defined by the user (default is 200). The number of price movement
FREE
The VSA Scanner Dashboard is a multi-symbol, multi-timeframe scanner that displays VSA signals. It is based on the Volume Plus and VSA Signals indicator. Features Displays the VSA signal of the last closed candle. Monitors 28 customizable instruments (symbols) and up to 21 timeframes at the same time. Easily arrange symbols in any order. Each signal has a tooltip that displays the name and time of appearance. Click on each signal to open a new chart. All types of alerts (sound, pop-up, email,

Fractals Aydmaxx 2024 Overview: Fractals Aydmaxx 2024 is a custom indicator designed for the MQL5 trading platform, developed by Aydmaxx. This indicator identifies and displays fractal patterns on your trading chart, which are essential for recognizing potential market reversals. The indicator highlights both bull and bear fractals, making it easier for traders to spot key levels of support and resistance. Features: Customizable Fractals: Allows the user to set the number of bars on the left and
FREE
CLICK HERE FOR A FREE DOWNLOAD AND LONG-LASTING PERFORMANCE This trading indicator Automatically identifies and plots contract blocks, which are essential zones marked by significant levels of support and resistance. This powerful tool provides traders with a clear and intuitive visualization of critical market points where prices are likely to bounce or reverse. The contract blocks, represented by distinct colored rectangles, highlight support zones (at the bottom) and resistance zones (at the
FREE
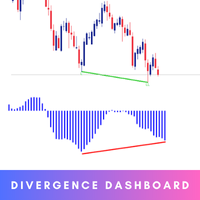
The Smart Divergence Dashboard is your ultimate tool for identifying high-probability trading opportunities. This cutting-edge indicator is meticulously designed to detect Regular Divergences, offering traders a clear and actionable advantage. MT4 Version - https://www.mql5.com/en/market/product/120702/ Key Features: Real-time Divergence Detection: Instantly pinpoints Higher High/Lower Low and Oscillator Higher Low divergences across multiple currency pairs and timeframes using Awesome Os
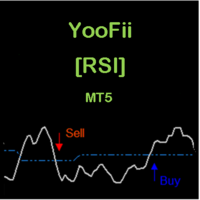
CONSTITUTION YooFii [RSI] is an indicator consisting of an oscillator and a dynamic level. The oscillator, dynamic level and warning signals can be adjusted via the inputs. It is designed for the MT5 platform only. APPLICATION This indicator should be used with a trend filter [e.g. two moving averages, MA 200 and MA 55] [see screen shots for more details]. when the oscillator crosses the dynamic level from bottom to top, we have a BULLISH move. when the oscillator crosses the dynamic level from
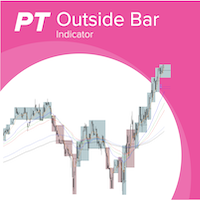
Outside bars (Außenstäbe) are important in professional price action trading and were made popular by Michael Voigt. Highs and lows of outside bars ( Aussenstäbe ) can be utilized as entry and exit for trades following different strategies. With combining different timeframes you can more easily detect the overall trend of the market, see potential resistance and support levels and also detect change in trend and framing of the market. Examples for strategies with inside bars (Innenstäbe) an

** All Symbols x All Timeframes scan just by pressing scanner button ** *** Contact me to send you instruction and add you in "Head & Shoulders Scanner group" for sharing or seeing experiences with other users. Introduction: Head and Shoulders Pattern is a very repetitive common type of price reversal patterns. The pattern appears on all time frames and can be used by all types of traders and investors. The Head and Shoulders Scanner indicator Scans All charts just by pressing
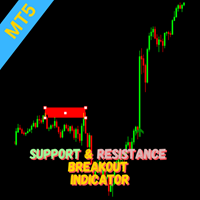
Indicator Overview This indicator utilizes the Zigzag indicator to identify potential support and resistance levels. When the price action breaks through one of these levels, a trading signal is generated. How it Works The Zigzag indicator is employed to pinpoint significant price highs and lows, forming potential support and resistance areas. A signal is triggered when the current candle closes beyond a previously established support or resistance level. Traders can consider entering a position

This indicator/dashboard , is place on a single symbol. It shows the percentage of movement withing all time frames from M1 to W1.The text will change green if all % are in the positive for a buy signal.The text will change red if all % are below zero and in negative for a sell signal. There are audible notifications, as well as on screen notifications along with push notifications that can be turned on and ON/OFF in the settings.
This is a sure way to Find trends quickly and efficiently, with
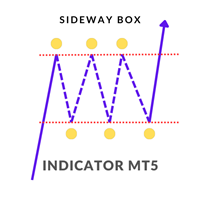
Sideway Box Indicator
The Sideway Box Indicator is an advanced trading tool designed to help traders identify and capitalize on sideways market conditions. This powerful indicator detects periods when the market is in a sideways (ranging) phase, providing traders with clear visual cues. Key Features
Sideways Market Detection : The Sideway Box Indicator accurately identifies sideways market conditions, allowing traders to recognize when the price is consolidating within a specific range. Buy/S

FusionBlocks: Decode Market Structure Unlock the full potential of your trading with FusionBlocks, the ultimate MT5 indicator for smart money concepts (SMC) traders. Designed to provide a comprehensive understanding of market structure, FusionBlocks is an indispensable tool for traders looking to enhance their strategy and performance. Key Features Order Block Detection : Automatically identifies and draws order blocks on the chart, helping you pinpoint key areas of interest. Break of Structure

This MQL5 Speed Indicator script calculates the average speed of price movements for a selected financial instrument over a specified period. It uses the arithmetic mean to determine the average speed, which is computed by dividing the distance (change in price) by the time interval. The indicator then displays this value as a histogram in a separate window. Average Speed Calculation : The speed is calculated using the formula v = d t v = \frac{d}{t} v = t d , where d d d is the price differen
The "Order Block Indicator for MetaTrader 5" is an advanced trading tool designed to help traders identify key order block zones in the financial markets. Order blocks are areas of institutional buying and selling, often marking significant price levels where market reversals or continuations are likely to occur. This indicator provides a visual representation of these zones directly on the chart, enabling traders to make more informed trading decisions. Key Features: Accurate Order Block Identi

Average Session Range: Calculate and Average the Sessions High-Low Range of Specific Time Sessions Over Multiple Days. The Session Average Range is a sophisticated and precise tool designed to calculate the volatility of specific time sessions within the trading day. By meticulously analyzing the range between the high and low prices of a defined trading session over multiple days, this tool provides traders with a clear and actionable average range. **Note:** When the trading platform is closed
FREE
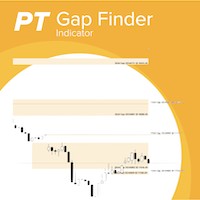
With the gaps finder indicator gaps between trading session are automatically added to you chart and you will never miss a gap which you can use in your trading strategies. Gaps often act as a magnet where the markets returns to or when a gap is closed often constitutes a reversal point.You don't have to draw manually gaps anymore. Key Features: Support for multiple trading sessions in a single chart, e.g market session and future session Configurable number of days to look back for gaps Highly

AtBot: どのように機能し、どのように使用するか ### どのように機能するか MT5プラットフォーム用の「AtBot」インジケーターは、テクニカル分析ツールの組み合わせを使用して売買シグナルを生成します。単純移動平均(SMA)、指数移動平均(EMA)、および平均真実範囲(ATR)インデックスを統合して取引機会を特定します。さらに、Heikin Ashiキャンドルを使用してシグナルの精度を向上させることもできます。 購入後にレビューを残すと、特別なボーナスギフトを受け取ります。 ### 主な機能: - 再描画なし: シグナルはプロット後に変更されません。 - 再描画なし: シグナルは一貫しており、変更されません。 - 遅延なし: 遅延なくタイムリーなシグナルを提供します。 - 多様な時間枠: あらゆる時間枠で使用可能で、取引戦略に合わせることができます。 ### 操作手順: #### 入力と設定: - firstkey (TrendValue): トレンド検出の感度を調整します。 - Secondkey (SignalValue): 売買シグナル生成の感度を定義します。 - ma
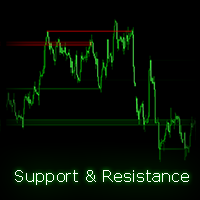
チャート上にサポートとレジスタンスチャネル(S/R)を自動で見つけてプロットし、重要なレベルを簡単に特定できるようにします。このインジケーターは複数の時間枠をサポートしており、現在のチャートに異なる時間枠のチャネルを表示できます。さらに、視覚的な明瞭さを高めるために透明な色を提供し、チャネルの色を好みに合わせてカスタマイズできます。 このインジケーターはどのように機能しますか? このインジケーターは、bars lookback パラメーターで定義された範囲内のスイングポイント(高値と安値)を見つけます。スイングポイントは、価格が方向を変えるチャート上のピーク(高値)やトラフ(安値)です。スイング長パラメーターを使用して、これらのポイントを特定するために何バーを前後に見るかを決定します。これらのスイングポイントから、最大チャネル高さパラメーターよりもチャネル高さが小さいことを確認しながらS/Rチャネルを形成します。最後に、複雑なフィルターを適用して最良のS/Rチャネルを選択し、チャートにプロットします。 インジケーターには「Use auto value for the maximum c
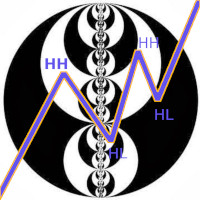
現在の時間枠の市場構造指標が見つかります:
1. トレンド(昇順と降順の波)。 波の方向の変化は、極値の中断(反対側からの流動性の撤退)の後に起こる。 トレンドは、外部バーを考慮して描画されます(1つの外部バーに2つの極端なものがある可能性があります)。 トレンドは、波の最小バー数(2以上)を考慮して描くことができます。 これは、Qty_Bars_For_Waveパラメータによって構成されます
2. BoS–構造の内訳、トレンドの方向への構造最小値と最大値の更新、昇順-最大値の更新、降順-最小値の更新
3. 誘導(IDM)は、価格がBoSを作るときの構造の最後の修正の極端な点です
4. 構造ポイント(価格がIDMに達した後に表示されます)。

SolarTrade Suite 金融指標: Jupiter 市場指標 - 金融市場の世界で信頼できるガイド!
これは、革新的で高度なアルゴリズムを使用して値を計算するトレンド指標であり、見た目にも美しいデザインです。
この指標の読みは非常に簡単に理解できます。青色は買い、赤色は売りです。
説明の下部にある SolarTrade Suite シリーズの他の製品をご覧ください。
投資と金融市場の世界を自信を持ってナビゲートしたいですか? SolarTrade Suite 金融指標: Jupiter 市場指標は、情報に基づいた投資決定を行い、利益を増やすのに役立つように設計された革新的なソフトウェアです。
SolarTrade Suite 金融指標: Jupiter 市場指標の利点:
- 正確な予測: 当社の指標は、高度なアルゴリズムと分析方法を使用して、市場の動きを正確に予測します。
資産の売買に最適なタイミングに関するシグナルを受け取ります。 - ユーザーフレンドリーなインターフェース: 直感的なインターフェースにより、プログラムを簡単にマスターし、インス

金融指標 SolarTrade Suite: Earth Market Indicator - 金融市場の世界で信頼できるガイドです! 私たちのFX取引プログラムには、リアルタイムで市場データを分析する強力な人工知能が搭載されています。価格変動を正確に予測し、トレーダーが情報に基づいた意思決定を行うのに役立ちます。高度なアルゴリズムを使用して、私たちのインジケーターは戦略を最適化し、リスクを最小限に抑えます。 これは、標準の灰色の日本のローソク足の代わりとなるもので、特別な革新的で高度なアルゴリズムを使用してその価値を計算し、見た目にも美しいデザインになっています。
この指標の読み方を理解するのは非常に簡単です。青色 - 買い、赤色 - 売り。
色が明るいほど、シグナルが強くなります。
説明の下部にある他の SolarTrade Suite 製品をご覧ください。
投資と金融市場の世界を自信を持ってナビゲートしたいですか? SolarTrade Suite 金融指標: Earth Market Indicator は、情報に基づいた投資決定を行い、利益を増やすのに役立つ

SolarTrade Suite 金融指標: Saturn 市場指標 - 金融市場の世界で信頼できるガイド!
これは、革新的で高度なアルゴリズムを使用して値を計算する価格チャネル指標であり、デザインも魅力的です。
この指標の読み方を理解するのは非常に簡単です。ブレイクアウトとリバウンドの両方で境界から取引します。
説明の下部にある SolarTrade Suite シリーズの他の製品をご覧ください。
投資と金融市場の世界を自信を持ってナビゲートしたいですか? SolarTrade Suite 金融指標: Saturn 市場指標は、情報に基づいた投資決定を行い、利益を増やすのに役立つように設計された革新的なソフトウェアです。
SolarTrade Suite 金融指標: Saturn 市場指標の利点:
- 正確な予測: 当社の指標は、高度なアルゴリズムと分析方法を使用して、市場の動きを正確に予測します。
資産を売買するのに最適なタイミングに関するシグナルを取得します。 - ユーザーフレンドリーなインターフェース: 直感的なインターフェースにより、プログラムを

金融指標 SolarTrade Suite: 天王星市場指標 - 金融市場の世界で信頼できるガイド! 私たちのFX取引プログラムには、リアルタイムで市場データを分析する強力な人工知能が搭載されています。価格変動を正確に予測し、トレーダーが情報に基づいた意思決定を行うのに役立ちます。高度なアルゴリズムを使用して、私たちのインジケーターは戦略を最適化し、リスクを最小限に抑えます。 これらは、革新的で高度なアルゴリズムを使用して値を計算する 2 つの移動平均であり、デザインも魅力的です。
この指標の読み取り値を理解するのは非常に簡単です。青色 - 買い、赤色 - 売り。
色が明るいほど、シグナルが強くなります。
説明の下部にある SolarTrade Suite シリーズの他の製品をご覧ください。
投資と金融市場の世界を自信を持ってナビゲートしたいですか? 金融指標 SolarTrade Suite: 天王星市場指標は、情報に基づいた投資決定を行い、利益を増やすのに役立つように設計された革新的なソフトウェアです。
金融指標 SolarTrade Suite: 天王星市場

金融指標 SolarTrade Suite: Neptune Market Indicator - 金融市場の世界で信頼できるガイド! 私たちのFX取引プログラムには、リアルタイムで市場データを分析する強力な人工知能が搭載されています。価格変動を正確に予測し、トレーダーが情報に基づいた意思決定を行うのに役立ちます。高度なアルゴリズムを使用して、私たちのインジケーターは戦略を最適化し、リスクを最小限に抑えます。 これらは、革新的で高度なアルゴリズムを使用して値を計算する 6 つの移動平均であり、デザインも魅力的です。
この指標の読み取り値を理解するのは非常に簡単です。青色 - 買い、赤色 - 売り。
色が明るいほど、シグナルが強くなります。
説明の下部にある SolarTrade Suite シリーズの他の製品をご覧ください。
投資と金融市場の世界を自信を持ってナビゲートしたいですか? 金融指標 SolarTrade Suite: Neptune Market Indicator は、情報に基づいた投資決定を行い、利益を増やすのに役立つように設計された革新的なソフトウェ

SolarTrade Suite 金融指標: Venus 市場指標 - 金融市場の世界で信頼できるガイド! 私たちのFX取引プログラムには、リアルタイムで市場データを分析する強力な人工知能が搭載されています。価格変動を正確に予測し、トレーダーが情報に基づいた意思決定を行うのに役立ちます。高度なアルゴリズムを使用して、私たちのインジケーターは戦略を最適化し、リスクを最小限に抑えます。 これは、特別な革新的で高度なアルゴリズムを使用して値を計算するオシレーターであり、見た目にも美しいデザインです。
この指標の読み取り値を理解するのは非常に簡単です。青色 - 買い、赤色 - 売り。
色が明るいほど、信号が強くなります。
説明の下部にある SolarTrade Suite シリーズの他の製品をご覧ください。
投資と金融市場の世界を自信を持ってナビゲートしたいですか? SolarTrade Suite 金融指標: Venus 市場指標は、情報に基づいた投資決定を行い、利益を増やすのに役立つように設計された革新的なソフトウェアです。
SolarTrade Suite 金融指標

金融指標 SolarTrade Suite: Mars Market Indicator - 金融市場の世界で信頼できるガイド! 私たちのFX取引プログラムには、リアルタイムで市場データを分析する強力な人工知能が搭載されています。価格変動を正確に予測し、トレーダーが情報に基づいた意思決定を行うのに役立ちます。高度なアルゴリズムを使用して、私たちのインジケーターは戦略を最適化し、リスクを最小限に抑えます。 これは、特別な革新的で高度なアルゴリズムを使用して値を計算するオシレーターであり、デザインも魅力的です。
このインジケーターの読み取り値を理解するのは非常に簡単です。青色 - 買い、赤色 - 売り。
色が明るいほど、信号が強くなります。
説明の下部にある SolarTrade Suite シリーズの他の製品をご覧ください。
投資と金融市場の世界を自信を持ってナビゲートしたいですか? 金融指標 SolarTrade Suite: Mars Market Indicator は、情報に基づいた投資決定を行い、利益を増やすのに役立つように設計された革新的なソフトウェアです。

上位タイムフレームに基づくフラクタルレベルは、上位タイムフレームのフラクタ ルに基づく正確なサポートおよびレジスタンスレベルを構築するよう設計された強力な ツールです。
仕組み: このインディケータは、上位タイムフレーム上のフラクタルのレ ベルを分析し、現在のチャートに表示します。インジケータのプロパティで上位タイムフレームを簡単に 調整でき、最大限の精度と戦略との関連性を得ることができます。
上位タイムフレームに基づくフラクタルレベルを使用する利点:
早 期 シ グ ナ ル 検 出:上位タイムフレームのフラクタルレベルを下位タイム フレームで見ることができるため、潜在的な売買シグナルをその開始時 点で識別することができます。 損益率の向上:低いタイムフレームでの早期エントリーにより、ストップロスを短く設定できるため、取引効率が大幅に向上します。 便利なアラート:重要なシグナルを見逃しません - エントリーやエグジットの機会を即座に通知します。 分析精度の向上:本当に重要な重要レベルに集中し、不必要な市場ノイズを無視します。 ハイヤータイムフレームに基づくFractal

無料ダウンロードには、グループに参加してください。期間限定オファー! 概要: MetaTrader 5用の通貨強度チャートを使って、一目で最強の通貨を特定しましょう。この強力なインジケーターは、過去30日間の主要通貨の相対的な強度を明確に視覚化し、より情報に基づいた取引判断を下すのに役立ちます。 主な特徴: 30日間の比較分析: 30日間の期間で各主要通貨の強さを比較し、トレンドや潜在的な取引機会を見つけるのに役立ちます。 視覚的な表現: 読みやすいチャート形式で、通貨のパフォーマンスを迅速に評価するための直接的な比較を提供します。 カスタマイズ可能な設定: あなたの取引ニーズに合わせて、時間枠や通貨ペアをカスタマイズしてチャートを調整できます。 リアルタイムデータ: リアルタイムデータで常に最新の情報を手元に置いておくことができます。 ユーザーフレンドリーなインターフェース: 初心者と経験豊富なトレーダーの両方に設計されており、通貨強度チャートは直感的で使いやすいです。 利点: 意思決定の強化: 最も強い通貨と最も弱い通貨を迅速に特定し、より戦略的な取引計画を立てることができます。

Candle Time CountDown By BokaroTraderFx The Candle Timer Countdown Indicator is a versatile tool designed for the MetaTrader 5 (MT5) trading platform. It provides traders with a visual countdown of the remaining time for the current candle on a chart. The key features include:
Customizable Position: Place the countdown timer in any corner of the chart for optimal visibility. Default Text Color: Set to red for clear visibility, with options for further customization. Minimal Display: Shows onl
FREE

Balanced Work Indicator: Your Gateway to Trend Trading Balanced Work is a trend-following indicator designed to simplify market analysis and trading decisions. This algorithmic tool draws two-colored dots along the price chart, connected by lines, offering a clear visual representation of market trends. The simplicity of this indicator lies in its color-coded signals: buy when a blue dot appears and sell when a red dot appears. It is particularly effective for scalping and pipsing, and it has p
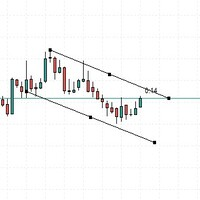
This indicator serves to give sound alerts when the price passes the manually placed line. A very useful tool, which allows you not to spend too much time sitting in front of the computer.
Note that the alert issued will always refer to the current candle, you can use multiple lines on the past chart to analyze.
This indicator will always receive better updates.
FREE
Amazing RSI + ATR Dashboard Indicators are useful for traders, but when you put them into a dashboard and can scan 28 symbols at once they become even better, and when you can also combine different indicators and timeframes to give you synchronized alerts they become awesome. When this product gets 20 reviews I will add another indcator free to this dashboard as a thank you. This easy to use dashboard provides you with the RSI and ATR indicators, use them individually or together to create p
FREE

Moving pivot Average Fibonacci
The indicator compares the selected period with its counterpart from the previous period. The indicator determines the moving Fibonacci levels for the day or any time interval to assess the price movement range from the time average. The indicator helps predict the expected high or low for the day based on historical time data. The pivot line can be considered an average trend line and use it in a variety of trading strategies.
If you have any question about t
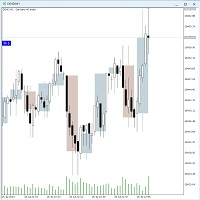
The Twotimeframe-Candles (RFrame) - Indicator for MT5 shows the candles of an higher, timeframe as an overlay on the current timeframe. You can choose the number of candles and color of the overlays. The indicator calculates the candle evevery tick. If you like the indicator, please left a comment. Version 1.1: The second time frame can now be set.
Keywords:
Candlestick, Multitimefram, Two Timeframes,
FREE

First and foremost, the Insight Flow Indicator stands out as a Non-Repainting, Non-Redrawing, and Non-Lagging tool. This makes it a prime choice for both manual and algorithmic trading, ensuring reliable and consistent signals. User Manual: Settings, Inputs, and Strategy The Insight Flow Indicator leverages price action, strength, and momentum to provide a clear edge in the market. Equipped with advanced filters, it eliminates noise and false signals, enhancing trading potential. By using multip
Optimized for Asia- London- US- Open-Session true Momentum - time-based Indicator
Filter
Daytime Weekdays Moving Averages Keltner-Channel
Advantages Optimized for Asia- London- US- Open-Session choose your personal times to trade - select Daytime and Weekdays Keltner-Channel => to reduce market noise - sideways movement will be hidden 3x Moving Averages => for the Trend Signal after close - no repaint
Alerts
Email Screen-Alert Push-Notification

Translator MeraMera Custom Indicator for MetaTrader 5
Overview:
The MeraMera indicator is a powerful tool designed for MetaTrader 5, aimed at traders who prefer a decisive, high-risk-high-reward trading strategy. Its motto, "GO Full Margin or GO Home," encapsulates its aggressive approach to trading. This custom indicator analyzes market conditions to identify potential bullish and bearish signals, helping traders make informed decisions based on historical price patterns.
Key Features:

The ICT Immediate Rebalance Toolkit is a comprehensive suite of tools crafted to aid traders in pinpointing crucial trading zones and patterns within the market.
The ICT Immediate Rebalance, although frequently overlooked, emerges as one of ICT's most influential concepts, particularly when considered within a specific context. The toolkit integrates commonly used price action tools to be utilized in conjunction with the Immediate Rebalance patterns, enriching the capacity to discern con
A simple indicator for plotting a tick chart.
This indicator will allow you to track the spread dynamics and the price behavior in general.
In the settings, you can select the price to display on the chart - Bid, Ask or both prices at the same time.
Tick Chart Indicator will definitely be useful when using scalping strategies. The MT4 version is available here . Good luck to everyone and successful trading!
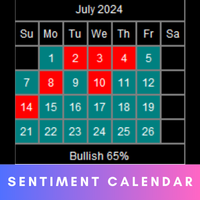
The Market Sentiment calendar provides a visual representation of market sentiment for each day or month. It will display daily and monthly BIAS . The calendar also highlights the percentage of bullish days or months within a given month or year. MT4 version - https://www.mql5.com/en/market/product/120767/ Inputs Frequency: Choose between "Daily" and "Monthly" calendar views. Sentiment Method: Select the method to determine daily or monthly sentiment: " L inear Regression ", " Accumu

Dynamic Range and Target Indicator: Your Reliable Trading Partner
Introducing an innovative indicator that revolutionizes how you analyze markets and make trading decisions. Whether you're a beginner seeking clear guidance or an experienced trader looking to enhance your strategy, this tool is designed to meet your needs.
Key Features:
1. Dynamic Range Determination: The indicator continuously analyzes the market, identifying the most recent significant price ranges.
2. Clear Suppor

The indicator places a buy or sell signal when the conditions of the strategy it was designed with are met. The strategy is guaranteed, strong, and has been tested for 9 years. The indicator is for binary options and can be converted into a bot by linking it to MT2Trading, where it sends the signal to this platform. This platform automatically opens a trade on the trading platform you are using, whether it is Pocket Option, IQ Option, or any other binary options platforms. The entry is on the n

The indicator displays the total number of ticks during the formation of a single bar. It can be used to analyze market activity in financial trading. Peaks and troughs of the indicator effectively highlight potential reversal points in price movements. This tool is particularly useful for traders seeking to identify periods of high volatility, allowing them to make informed decisions based on tick volume patterns. By observing changes in tick frequency, traders can gain insights into market se

The indicator places a buy or sell signal when the conditions of the strategy it was designed with are met. The strategy is guaranteed, strong, and has been tested for 9 years. The indicator is for binary options and can be converted into a bot by linking it to MT2Trading, where it sends the signal to this platform. This platform automatically opens a trade on the trading platform you are using, whether it is Pocket Option, IQ Option, or any other binary options platforms. The entry is on the ne

The trendlines with breaks indicator return pivot point based trendlines with highlighted breakouts. Users can control the steepness of the trendlines as well as their slope calculation method.
Trendline breakouts occur in real-time and are not subject to backpainting. Trendlines can however be subject to repainting unless turned off from the user settings.
The indicator includes integrated alerts for trendline breakouts. Any valid trendlines methodology can be used with the indicator, u
Introducing the Gold Market Arrow Indicator, specifically designed for the 15-minute chart. This advanced tool provides clear and actionable buy and sell arrows, enabling traders to make timely and informed decisions in the gold market. Whether you're a seasoned trader or a novice, our indicator simplifies complex market data into straightforward signals, ensuring you never miss an opportunity to capitalize on gold price movements." This indicator works with a custom build in strategy The indic

Description of the Indicator Trend Stop shows the highest/lowest value of the last N periods. Can help traders identify the trend direction and potential stop levels. Use Trend Stop indicator to detects the trend direction.
Downtrend if the price crosses the Trend Stop line upwards Uptrend if the price crosses the Trend Stop line downwards
Use Trend Stop indicator to define optimal stop levels. Downtrend Place your stops above the Trend Stop line Uptrend Place your stops below the Tr
This never-before-seen Indicator is a histogram of the MACD lines crossing. It has never been easier to observe a trend reversal in advance. It fixes the crossing points of the MACD lines on the chart according to your parameter settings. Ideal for anticipating trends and studying the stock market. Detailing the Indicator: It accurately indicates the crossing of the MACD and Signal lines, being later confirmed by the MACD indicator as confirmation of the trend. it confirms the macd crossing wit

ゴールドブリッツスキャルピングインジケーターを紹介します。このツールは、M1、M5、M15の時間枠でゴールドをスキャルピングするための最適なツールです。先進的なAIニューラルネットワークを使用して開発されたこの非リペイントインジケーターは、一貫した利益と優れた取引結果を保証します。精度と効率を追求したゴールドブリッツスキャルピングインジケーターは、M15時間枠で最も良い結果を提供します。 主な特徴: 先進的なAIニューラルネットワーク: 最先端のAI技術を活用して比類のない精度を実現。 非リペイント: 一貫したパフォーマンスのために信号のリペイントを防ぎます。 複数の時間枠スキャルピング: M1、M5、M15に最適化されており、M15時間枠で最良の結果を提供。 包括的な信号: 明確な売買シグナル、利益確定(TP)および損切り(SL)レベルを提供し、情報に基づいた取引をサポート。 利点: 高精度: 高精度のシグナルで卓越した取引成功を実現。 リアルタイムアラート: 即時のアラートとシグナルで先手を打つ。 使いやすさ: 明確な指示とサポートで簡単に使用。 生涯アクセス: 現行バージ

Easy Fibonacciは、MT5用のインジケーターで、フィボナッチリトレースメントを簡単にプロットできます。 特徴 インジケーターの設定から最大10個のフィボナッチレベルを設定できます。 各レベルには、異なる線スタイル、線色、線幅、およびその他の設定をカスタマイズできます。 追加ボタン付きのマウスを使用して、VキーとBキーをマッピングし、フィボナッチを便利にプロットできます。 ボタンの操作: BとV:チャートの表示領域にトップ/ボトムのフィボナッチをプロット NとM:次と前のローソク足のスイングエクステンション R:リセット
Easy Fibonacciは、MT5用のインジケーターで、フィボナッチリトレースメントを簡単にプロットできます。 特徴 インジケーターの設定から最大10個のフィボナッチレベルを設定できます。 各レベルには、異なる線スタイル、線色、線幅、およびその他の設定をカスタマイズできます。 追加ボタン付きのマウスを使用して、VキーとBキーをマッピングし、フィボナッチを便利にプロットできます。 ボタンの操作: BとV:チャートの表示領域にトップ/ボトムのフィボナッチ
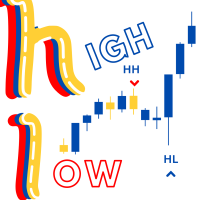
Swing High/Low Identifier Swing High/Low Identifier は、MetaTrader 5 (MT5)用に設計されたカスタムインディケータで、チャート上の重要なスイングポイントを強調表示します。このインディケータは、設定可能なバー範囲に基づいてスイングハイとスイングローを識別してマークします。 スイングハイは、対応するキャンドルの上に赤い矢印でマークされます。 スイングローは、対応するキャンドルの下に青い矢印でマークされます。 このツールは、トレーダーが重要な価格レベルやパターンを迅速に見つけるのに役立ち、情報に基づいた取引決定を行う上で重要です。 有効な戦略 トレンド転換の識別: スイングハイは、下降トレンドが始まる可能性のある抵抗レベルを示すことがあります。 スイングローは、上昇トレンドが始まる可能性のある支持レベルを示すことがあります。 サポートとレジスタンスの分析: マークされたスイングハイとスイングローを使用して、重要なサポートおよびレジスタンスレベルとして機能する水平線やチャネルを描画します。 プライスアクショントレード: インディ
FREE

金融指標 SolarTrade Suite: Pluto Market Indicator - 金融市場の世界で信頼できるガイド!
これは、特別な革新的で高度なアルゴリズムを使用して値を計算するボラティリティ オシレーターであり、見栄えの良いデザインも備えています。
このインジケーターの読み取り値を理解するのは非常に簡単です。緑色 - ボラティリティが低く、取引を開始するのに最適な時期、オレンジ色 - ボラティリティが高く、取引ポジションのクローズを検討する時期。
色が明るいほど、信号が強くなります。
利便性のために、このインジケーターのウィンドウをクリックして信号を反転することができます。
説明の下部にある他の SolarTrade Suite 製品をご覧ください。
投資と金融市場の世界を自信を持ってナビゲートしたいですか? SolarTrade Suite 金融指標: Pluto Market Indicator は、情報に基づいた投資決定を行い、利益を増やすのに役立つように設計された革新的なソフトウェアです。
SolarTrade Suite 金融指

ボリューム ブレイク オシレーターは、オシレーターの形で価格変動とボリューム トレンドを一致させるインジケーターです。
私はボリューム分析を戦略に統合したいと思っていましたが、OBV、マネー フロー インデックス、A/D、ボリューム加重 Macd など、ほとんどのボリューム インジケーターにいつもがっかりしていました。
そのため、このインジケーターを自分で作成し、その有用性に満足したので、市場に公開することにしました。
主な機能:
ボリュームの増加 (ブレイク) によってサポートされる方向に価格が動くフェーズを強調します。 ボリュームの増加が止まり、市場が縮小するフェーズを強調します。 特に時間枠 (<=15 分) のデイトレードでは、価格もボリュームも動かないため、市場が将来の動きに備えられるフェーズを強調します。 ボリュームの増加によってサポートされていない場合、他のエキスパートアドバイザーからの偽のシグナルをフィルタリングします。 トレンドとレンジフェーズを非常に簡単に視覚化できます 入力パラメータ:
計算設定:
計算タイプ: FAST、NORMAL、S

金融指標 SolarTrade Suite: Mercury Market Indicator - 金融市場の世界で信頼できるガイドです! 私たちのFX取引プログラムには、リアルタイムで市場データを分析する強力な人工知能が搭載されています。価格変動を正確に予測し、トレーダーが情報に基づいた意思決定を行うのに役立ちます。高度なアルゴリズムを使用して、私たちのインジケーターは戦略を最適化し、リスクを最小限に抑えます。 これは、革新的で高度なアルゴリズムを使用して値を計算する移動平均であり、見た目にも美しいデザインです。
この指標の読み方を理解するのは非常に簡単です。青色 - 買い、赤色 - 売り。
色が明るいほど、シグナルが強くなります。
説明の下部にある他の SolarTrade Suite 製品をご覧ください。
投資と金融市場の世界を自信を持ってナビゲートしたいですか? SolarTrade Suite 金融指標: Mercury Market Indicator は、情報に基づいた投資決定を行い、利益を増やすのに役立つように設計された革新的なソフトウェアです。
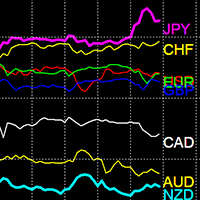
通貨強度インジケーター
通貨強度インジケーターは、トレンドを識別するための強力なツールです。さまざまな通貨の強さと弱さを比較し、トレンドの通貨ペアを簡単に見つけることができます。
セール価格: 49 ドル
機能
強い通貨と弱い通貨を効果的に区別します トレンドの通貨を自動的に識別します マルチタイムフレーム 28 通貨ペアをロードします パフォーマンスが最適化されています
インジケーターの使用法 強い通貨: 80 を超える通貨は強いと見なされます。 弱い通貨: 20 未満の通貨は弱いと見なされます。
例
EUR が 80 を超えて上昇傾向にあり、USD が 20 未満で下降傾向にある場合、EURUSD は上昇傾向にあります。
JPY が 80 を超えて上昇傾向にあり、GBP が 20 未満で下降傾向にある場合、GBPJPY は下降傾向にあります。
インジケーターで通貨が高いほど、強いことを意味します。インジケーター上で通貨が低いほど、その通貨は弱いです。
インジケーターの反対側にある通貨で構成される通貨ペアは、通常、強いトレンドで、しばらく続き
MetaTraderマーケットはMetaTraderプラットフォームのためのアプリを購入するための便利で安全な場所を提供します。エキスパートアドバイザーとインディケータをストラテジーテスターの中でテストするためにターミナルから無料のデモバージョンをダウンロードしてください。
パフォーマンスをモニターするためにいろいろなモードでアプリをテストし、MQL5.community支払いシステムを使ってお望みのプロダクトの支払いをしてください。
取引の機会を逃しています。
- 無料取引アプリ
- 8千を超えるシグナルをコピー
- 金融ニュースで金融マーケットを探索
新規登録
ログイン