YouTube'dan Mağaza ile ilgili eğitici videoları izleyin
Bir ticaret robotu veya gösterge nasıl satın alınır?
Uzman Danışmanınızı
sanal sunucuda çalıştırın
sanal sunucuda çalıştırın
Satın almadan önce göstergeyi/ticaret robotunu test edin
Mağazada kazanç sağlamak ister misiniz?
Satış için bir ürün nasıl sunulur?
MetaTrader 5 için yeni teknik göstergeler - 22

A heatmap is a graphical representation of data in two dimensions, using colors to display different factors. Heatmaps are a helpful visual aid for viewers, enabling the quick dissemination of statistical or data-driven information. The MP Heatmap indicator provides a graphical representation of the relative strengths of major currencies compared to others, organizing data from pairs into color-coded results and producing a clear overview of the entire Forex market. The MP Heatmap indicator dis
FREE

Introducing "Congestion Breakout MT5" - the indicator that helps you identify congestion zones in your chart and alerts you when the price breaks through them. Traders know that congestion zones can be key areas of price action and can indicate potential turning points in the market. However, spotting these zones and anticipating breakouts can be a difficult and time-consuming task. That's where "Congestion Breakout" comes in. This powerful indicator uses advanced algorithms to analyze the pri
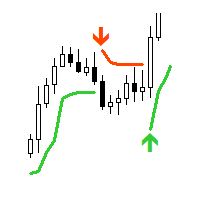
"AV SuperTrend MT5" is an indicator for MetaTrader 5. The supertrend indicator is popular for determining the trend and positioning stops or as trailing support. I use this indicator in several expert advisors for trend analysis.
Supertrend indicator signals can be selected in the form of entry arrows and notifications, as well as various sounds.
Settings:
- Period
- Multiplier
- Alert buy signal: arrow color
- Alert sell signal: arrow color
- Alert yes/no
- Sound: choice or no

The euro index (Euro Currency Index, EURX) is an average indicator of changes in the exchange rates of five currencies (US dollar, British pound, Japanese yen, Swiss franc and Swedish krona) against the euro. Displays a Eur X chart in a seperate window below the main chart. YOUR BROKER MUST HAVE THESE SYMBOLS FOR THE INDICATOR TO WORK Based on EUR/USD, EUR/JPY, EUR/GBP, EUR/CHF and EUR/SEK All these pairs must be added to Market Watch for the indicator to work correctly As this is calculated usi
FREE
This is a simple arrow system based on MACD indicators Main/Base line and MACD Levels. It gives you alerts when MACD's Main Line crosses above/below certain level. Which type of alerts available? 1. It paints on chart Up/Down Arrows. 2. Popup message and sound alert in trading terminal window. 3. Push notification or Alert on your android and ios mobile phones (requires MT4 or MT5 app installed!)

Simple supply and demand indicator which should help identify and visualize S&D zones. Settings:
Color for supply zones, color for demand zones - default colors are set for dark (black) background.
Number of how much zones should be created above and below current price - value "3" means there will be 3 zones above current price and 3 zones below current price. Principle:
When price creates "V", reversal zone is registered. Rectangle filled based on zone type (supply / demand) is drawn if pri
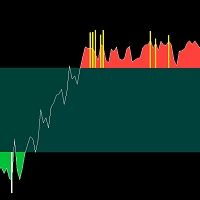
BS Trend Line是一款很好的买卖指示器,不含有未来函数,不会重绘,新版本已经加入了更好的过滤算法,开单成功率有了很大的提高,是一个很好的波段交易提示器,尤其是配合 SourcePoint 会有更明显的效果,它能帮你过滤掉接近70%以上的无效交易信号。 ===================参数列表===================== timeframe:M1
gip:30 sip:6 up line:80 down line:20 ===================使用方法===================== 配合 SourcePoint 使用时, SourcePoint 的参数 fastP: 96
slowP:208 avgP:72

This is a simple arrow system based on Engulfing Candlestick Pattern. It gives you alerts on your smartphone when there is an engulfing candlestick pattern happens. Which type of alerts available? 1. It paints on chart Up/Down Arrows. 2. Popup message and sound alert in trading terminal window. 3. Push notification or Alert on your Android and IOS mobile phones (requires MT4 or MT5 app installed!) *Note: Use it on higher timeframes like H4 (4 hours), D1 (1 Day) then find trade opportunities on s

Displays trends in current chart. You can display trends of multiple timeframes in one chart by inserting this indicator as often as you want. Key features: displays trend line by finding highs and lows counts number of high/low of current trend in different color (long/short) allows you to display multiple timeframe trends in one chart Settings: Indicator Name: if you want to show M5 and H1 on one chart add TITrend twice to your current chart and rename M5 to "TITrendM5" and H1 to "TITrendH1" C
It is important that the indicator works only in the charts of Japanese candlesticks and bars. So, this indicator is ideally combined with price pattern analysis Price Action and is used in classic Japanese candlestick analysis This forecasting tool consists of three elements: Price flip is a signal of a potential reverse. Setup filters out the signals, that is, it identifies where a new trend starts and when there is only a correction within the current trend. Countdown calculates the tre

VWAP Bantları Görsel Stil 1.0 Finansal piyasa göstergeleri, tüccarlar ve yatırımcılar tarafından finansal piyasaları analiz etmek ve karar vermek için kullanılan temel araçlardır. VWAP ve Bollinger Bantları, tüccarlar tarafından piyasa trendlerini ve fiyat oynaklığını ölçmek için kullanılan iki popüler teknik analiz aracıdır. Bu üründe, piyasa eğilimlerinin ve oynaklığının kapsamlı bir analizini sağlayan benzersiz bir ürün oluşturmak için iki göstergeyi birleştirmeyi öneriyoruz. Bu ürün, veriye
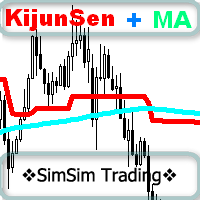
Çok basit ama etkili bir gösterge.
Ichimoku göstergesinin KijunSen çizgisine ve bu hattaki oluşturulmuş ortalama MA'ya dayanmaktadır. Al veya Sat sinyali: bu iki çizginin kesişme noktasıdır!!!
Ben de ticaret için Ichimoku göstergesinin KijunSen hattını sık sık kullanıyorum, eğer fiyat YÜKSEK ise, sadece SATIŞLAR DÜŞÜK ise SATIN ALMALARI dikkate alıyorum.
Ve KijunSen çizgisinin ortalaması alındıktan ve KijunSen MA çizgisi oluşturulduktan sonra, iki çizginin kesişme noktaları ortaya çıktı, bu t

Gerçek Dönen Top Göstergesi
Dönen topaçın gerçek anlamı olan dengeli gövde ve fitil yükseklik oranı ile grafik üzerinde doğru topacı algılar ve onu Hammers and Doji veya Null Candlestick'ten ayırır.
Bu gösterge, grafikte bulunan topaç sayısına bir kanat simgesi çizer.
Ayarlar şunları içerir:
Çubuk Sayısı : Aramayı çubuk sayısına göre ayarlamak için
Simgenin Rengi: simgenin rengini değiştir
Simge kodu: simge için kanatların kodunu değiştirin
FREE

CZSC Fraktal tip indeksi
Özellikler:
Dahil etme ilişkisinin kapsamlı bir şekilde işlenmesini gerçekleştirdi
"Stok Yapmayı Öğretmek 93: İki Tablo Arasındaki İlişki ve Trend Yapısının İçi 2" deki durumu ve üst-alt bir sınıflandırma olup olmadığını değerlendirmek için EA çağrısını kullanmak uygundur.
Yukarıdan aşağıya sınıflandırmayı oklarla göster
Olası kalemleri farklı renklerde göster
İki bitişik K-çizgisinin dahil etme ilişkisi bir tanım verir: bir K-çizgisinin yüksek ve alçak nokt
The SD Indicator is a powerful tool in the world of Forex trading, that combines two classical strategies: Support/Resistance levels and Supply/Demand zones. The indicator helps traders to identify potential trading opportunities in the market with high accuracy.
Support and resistance levels are key price levels where buying and selling pressure converge, leading to potential price reversals. The SD Indicator identifies these levels in real-time and provides traders with a clear picture of wh
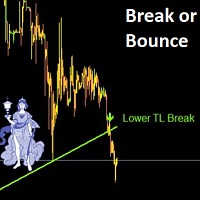
Trade like a pro and never miss Break or Bounce of a Support or Resistence Line
Get alert and suggested Trading points (entry, TP1, TP2 and SL) whenever there is a break of - Break or Bounce from Pivot Point Support or Resistence - Break or Bounce from a Trendline (upper and lower Trendline) - High and Low of a previous period Any suggestion on other types of Support / Resistence to add are more than welcome

** All Symbols x All Timeframes scan just by pressing scanner button ** *** Contact me after the purchase to send you instructions and add you in "Channel Scanner group" for sharing or seeing experiences with other users. Introduction: The Channel pattern is described as the area located between two trend lines. This area is used for a measure of a trading range. In this case, the upper trend line connects price highs while the lower trend line connects price lows. Also when it comes to

Sobre la base del concepto físco de "Cantidad de Movimiento" construimos este indicador/oscillador, que pretende darnos idea de entradas y salidas en el mercado. En mecánica clásica, la cantidad de movimiento se define como el producto de la masa del cuerpo (volumen) y su velocidad (rapidez con la varía el precio) en un instante determinado. p=M*V Se trata de un indicador/oscilador que pretende identificar momentos de entrada y salida basados en la fuerza o presión a ambos lados del preci

This indicator emulates volume delta (buy trades vs sell trades) based on per candle volume and candle shape (direction, size of body and wicks). Artificially separated buy and sell volumes then accumulated for specified number of bars. The indicator shows a histogram of volume delta per bar, as well as a sum of the delta for the given period. What is more important, the indicator allows you to combine current symbol quotes/volumes with quotes/volumes of other related symbols (futures, indices,
FREE
iHegde MA cross is a MultiTimeFrame Indicator which works by intersection of two moving averages
Signals- the indicator generates signals in the form of arrows when the intersection between short and long moving average occurs
Features 1. Works on All Time Frame 2. Works on All scripts, Index, Forex 3.No repainting 4. Smoothed for better appearance
Settings 1.Moving averages-short and long 2. Arrow-size 3. Colour customization 4. Alerts/Push/Email
Note: The signals are indicative of pos

NO repaint, NO misleading statistics, NO hidden mechanisms – only proven mathematics using the famous Fibonacci retracement levels.
This indicator finds bearish Fibonacci retracement levels using a dynamic seeking engine, and tells where current price is relative to the levels, continuously for all candles. No need to redraw the levels manually when market structure changes - this indicator dynamically adjusts to the most recent structure. See the levels and price location from the indicator
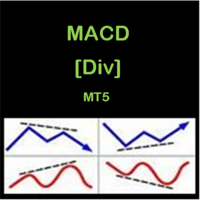
The indicator draws arrows and lines in the main chart and subwindow chart according to the divergences detected. Using the inputs, you can change the MACD values, disable or enable the drawing of divergence lines and arrows in the main chart or subwindow chart, change the colors of the divergence lines enable and disable the alerts [poup up alerts and notification alerts]. sell signal: if occurred bearish divergence and main crossed signal. buy signal: if occurred bullish divergence and main cr

As well as SuperTrend, SuperTrend Alerts offers alerts . You can also get alerts with SuperTrend Alerts . Besides SuperTrend, SuperTrend Alerts also offers alerts . SuperTrend Alerts offers alerts along with SuperTrend . In addition to SuperTrend, SuperTrend Alerts has alerts . Also , SuperTrend Alerts offers alerts . The SuperTrend Alerts add-on works with SuperTrend as well. As well as SuperTrend, SuperTrend Alerts has alerts too .
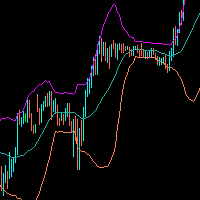
Bollinger Bands are a technical analysis tool that consists of a set of three lines plotted on a price chart. The middle line is a simple moving average, usually of 20 periods, and the upper and lower lines represent the standard deviation of the price from the moving average. The upper band is calculated by adding two standard deviations to the moving average, while the lower band is calculated by subtracting two standard deviations from the moving average. This creates a band around the moving

Smart Tape - это индикатор ленты всех сделок с возможностью агрегации по цене и времени и фильтрацией по величине объема, включает в себя два отключаемых варианта отображения. Вариант 1: перемещаемое окно по графику со списком сделок (Time Sales). Список обновляется сверху вниз и не имеет возможности просмотра истории. Количество отображаемых строк выбирается пользователем. Порядок отображения в строке: время с точностью до миллисекунд, тип сделки (B - покупка или S - продажа
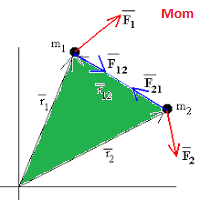
Indcador/Oscilador basado en el concepto de la física clásica, "Cantidad de movimiento". Fácilmente adaptable a diferentes pares y activos, como a períodos de time frame. Los parámetros de entrada son los que siguen, y pueden modificarse por el usuario: TrendPeriod = 14; // Trend period Smooth = 3; // Smoothing period TriggerUp = 0.05; // Trigger up level TriggerDown = -0.05; // Trigger down level
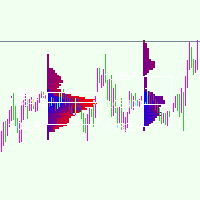
A Market Profile (time price opportunity) implementation with an option to mark a point of control (POC) based on volume .
Config: Hide default candles. Select a session time using exchange timezone. Experiment with tick multiplier value to achieve desired level of detail. Choose the symbols of your choice, e.g. squares or A-Z chars. For multiple sessions you will have to add additional instances of this script with a different time configuration.
Limitations: TradingView has a hard

The Rainbow Multiple Moving Average (MMA) is a technical analysis tool used to identify trends and potential reversal points in financial markets. It is based on a system of moving averages that are designed to be used together, with each moving average having a different time frame. The Rainbow MMA consists of multiple exponential moving averages (EMAs) of different lengths, with each EMA plotted in a different color. Typically, the Rainbow MMA includes EMAs of 2, 3, 4, 5, 6, 7, 8, 9, 10, 11, a
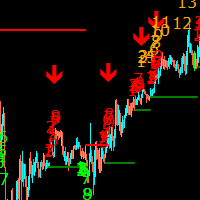
The Sequential Ultimate Indicator is a modified version of the Ultimate Oscillator that adds a sequential component to the calculation. It is designed to identify potential trend reversals by looking for divergences between the price action and the oscillator. The Sequential Ultimate Indicator works by adding a sequential count to the Ultimate Oscillator readings. The sequential count starts at 1 when the oscillator moves above 70 or below 30 and continues until a price reversal occurs. The sequ

Profesyonel iş hayatı boyunca sızma testleri ve güvenlik danışmanlığı konusunda birçok firmaya hizmet veren Tekno Fatih, web uygulama, mobil uygulama, network&sistem, kablosuz ağ gibi birçok alanda sızma testleri yapmış olup siber olaylara müdahale, ddos testleri ve kaynak kod analizi projelerinde de yer almıştır. Siber güvenlik alanında birçok konferansta yerini almıştır. Amerika Savunma Bakanlığına bağlı olan NSA.gov ( Ulusal Güvenlik Teşkilatı )'inde ve NGA.mil ( Ulusal Coğrafya-İstihbarat T
Gösterge iki zaman periyodu ile çalı ş ır, olayları do ğ rudan çalı ş ma grafi ğ i üzerinde görsel olarak gösterir ve destek / direnç seviyeleri olarak hizmet eden yatay seviyeleri gösterebilir. Olu ş turulan hacimlerin farklı de ğ erleri, grafi ğ in sa ğ tarafına yönlendirilen seviyelerin olu ş turuldu ğ u ilgili çubukta renkli bir i ş aret olarak görüntülenir. Çalı ş ma grafi ğ inde, daha eski zaman diliminden alınan seviyeler de görüntülenir. Seviyelerin gösterimi ve özellikleri gösterge ayar
G ö sterge iki zaman periyodu ile ç al ışı r , dalgalar ı do ğ rudan ç al ış ma tablosu ü zerinde g ö rsel olarak g ö sterir ve yatay dalga seviyelerini g ö sterir . ZigZag g ö stergesi , dalga hareketinin alg ı lanmas ı n ı kolayla ş t ı ran ve dalgalar ı seviyelere g ö re aral ı klara b ö len g ö r ü n ü r e ğ imli ç izgilerle fiyat grafi ğ indeki ö nemli ü st ve altlar ı birle ş tirir . Ekstrem değerler, High\Low fiyatlar veya Close fiyatları ile hesaplanır. Dalga seviyeleri bir sonraki dalga

MT4 versiyonu | FAQ | EA Universal Breakout Universal Box , daha sonra bir fiyat aralığı kırılmasıyla işlem yapmak için kullanılabilecek fiyat aralıklarını grafikte çizer. Bu göstergeyi uygulayabileceğiniz birçok strateji vardır. Gösterge varsayılan olarak grafikte Asya, Avrupa ve Amerika ticaret seansı aralıklarını işaretleyecek şekilde ayarlanmıştır. Aralıklar, sınırları işlem seansının başlangıç ve bitiş zamanı ve o dönem için maksimum ve minimum fiyat seviyeleri olan dikdörtg
FREE

Fiyat Dalga Modeli MT5 --(ABCD Modeli)-- hoş geldiniz ABCD modeli, teknik analiz dünyasında güçlü ve yaygın olarak kullanılan bir ticaret modelidir.
Tüccarların piyasadaki potansiyel alım ve satım fırsatlarını belirlemek için kullandıkları uyumlu bir fiyat modelidir.
ABCD modeliyle, tüccarlar potansiyel fiyat hareketlerini tahmin edebilir ve alım satımlara ne zaman girip çıkacakları konusunda bilinçli kararlar verebilir. EA Sürümü: Price Wave EA MT5
MT4 Sürümü : Price Wave Pattern
FREE

MetaForecast, fiyat verilerindeki harmonileri kullanarak herhangi bir piyasanın geleceğini tahmin eder ve görselleştirir. Piyasa her zaman tahmin edilemezken, fiyatlarda bir desen varsa, MetaForecast geleceği mümkün olduğunca doğru bir şekilde tahmin edebilir. Benzer ürünlere göre, MetaForecast piyasa eğilimlerini analiz ederek daha kesin sonuçlar üretebilir.
Giriş Parametreleri Past size (Geçmiş boyut) MetaForecast'ın gelecekteki tahminler oluşturmak için kullandığı çubuk sayısını belirtir. M

MT4 versiyonu | Valable ZigZag göstergesi | FAQ Elliott Dalga Teorisi , fiyat grafiklerindeki dalgaların görsel modeline dayanan, finans piyasalarındaki süreçlerin bir yorumudur. Bu teoriye göre, şu anda piyasada yukarı veya aşağı doğru hangi eğilimin hakim olduğunu tam olarak bilebiliriz. Valable ZigZag göstergesi , piyasanın dalga yapısını göstermenin yanı sıra mevcut zaman diliminde şu anda ana eğilimin yönünü gösterir. Size kolaylık sağlamak için Trend Monitor VZ göstergesi, işl

A Heatmap with a Volume Profile is like a thermal imager or x-ray machine. It will help you to estimate the relative distribution of volume during the price movement and to understand the relationship between volume and price. Indicator Volume Profile "Volumos Maxima" is a powerful tool for analyzing this relationship. After simple experimentation with heatmap, you can find that each trading instrument has its own “ characteristic ” way of distributing volume. And this will help you to make a b

Supply or demand zones refer to price areas where a significant amount of supply or demand had previously entered the market, causing prices to either fall or rise. If the price returns to the demand or supply zone, it is likely to bounce off due to the large number of orders previously placed within the zone. These orders will be defended in these areas.
The Fair Value Gap (FVG) is a concept used to identify imbalances in the equilibrium of buying and selling. Fair Value Gaps are formed in a

Your search for a perfectly simple ICT Killzone indicator for MT5 is now over because here it is. If you trade ICT concepts, then you know what ICT Killzones are. ICT Killzones (by default is adjusted to EST New York Time, no recalibrating to your timezone needed. Just load it onto your chart and you're good to go): Asian Open Killzone (06:00PM - 12:00AM EST New York Time) London Open Killzone (02:00AM - 05:00AM EST New York Time ) New York Open Killzone (07:00AM - 9:00AM EST New York Time )

MT4 Version Order Blocks ICT Kill Zones SMT Divergences ICT Breakers
The ICT Breakers indicator is a powerful tool for traders looking to gain an edge in the market. This indicator is based on the order flow and volume analysis, which allows traders to see the buying and selling pressure behind the price action. This information can be extremely valuable in identifying key levels of support and resistance, as well as potential turning points in the market. Breaker blocks are areas where i

This indicator automatically draws horizontal lines at 00s, 20s, 50s and 80s levels. If you trade ICT concepts and are an ICT Student, then you know that these levels are used as institutional support/resistance levels and/or fibonacci retracement anchor points. Features
Draws horizontal lines at 00, 20, 50 and 80 levels above and below current market price . Choose the amount of levels to show on chart Customizable line colors Recommended for forex currency pairs. Saves time looking for the
FREE

Displays a USD DXY chart in a seperate window below the main chart. YOUR BROKER MUST HAVE THESE SYMBOLS FOR THE INDICATOR TO WORK Based on EUR/USD, USD/JPY, GBP/USD, USD/CAD, USD/CHF and USD/SEK All these pairs must be added to Market Watch for the indicator to work correctly As this is calculated using a formula based on the 6 pairs it will only work when the market is open.
YOUR BROKER MUST HAVE THESE SYMBOLS FOR THE INDICATOR TO WORK
Displays a USD DXY chart in a seperate window below the
FREE

This indicator can be used to study the repeating daily volatility structure, and also find deviations from the historical means. Black line tells the average volatility of current hour from last 30 days. Blue bands tell the confidence interval (2 times standard deviation). Red line tells the current volatility, ATR.
Inputs: - days: the number of days where to calculate the average volatility - atrp: the ATR period used to measure volatility
FREE
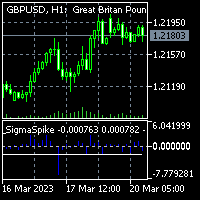
To get access to MT4 version please click here . - This is the exact conversion from TradingView: "SigmaSpikes(R) per Adam H. Grimes" by "irdoj75" - This is a light-load processing and non-repaint indicator. - All input options are available. - Buffers are available for processing in EAs. - You can message in private chat for further changes you need. Thanks for downloading

Candlestick bar, you can call it Candlestick Scalping Beast(CBS). This indicator is made specifically for scalping. The strategy on the indicator is that it gives signal on the close of a candle following this rule, if the close of the candle/bar is high then the previous candle/bar ,then it is a buying signal (up-trend),a green arrow and if the close of the candle/bar is lower than the previous candle/bar , then it is a selling signal (Downtrend), a red arrow. And the ATR is a secrete recipe

Murrey Math Lines The concept of this technical analysis system was developed by T. Henning Murrey in 1995 and described in The Murrey Math Trading System; For All Markets. The main concept here is that all markets behave in the same manner based upon the observations made by W.D. Gann. To date, the Murrey Math Line X it is one the most popular methods of Forex analysis and trading. Formula The Murrey Math Line X is calculated with the help of price movement segment, which, in accordance to Gan

This is a volume indicator with the addition of a threshold level that can be set to a fixed value chosen personally or obtained from the average of the volume values themselves. The type of averaging method can be selected in the input parameters.
The input parameters are easy to interpret but let's examine them:
1 - Volume type Here you can select the type of volume you want to see represented and there are 2 choices, either TICK volume or REAL volume. Keep in mind that for forex, for exa
FREE

Forex BUY and SELL signals from the best Heiken Ashi Smoothed indicator. Draw bullish/bearish bars on the chart. Accurate trend detector. Heiken Ashi Smoothed is a simple MT5 indicator that draws bullish and bearish bars in the chart to reflect the direction of the trend. The indicator consists of orange bearish bars and green bullish bars. When the trend changes its direction, the indicator changes its color. The indicator is a modernization of the traditional Heiken Ashi indicator. Moving Aver
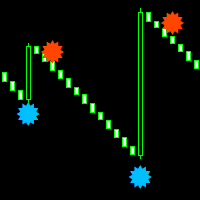
Boom and crash smasher free indicator that works on all timeframe from the one minute to the monthly timeframe. the indicator is 100% non-repaint. the indicator come with sound alerts and email push notification the indicator appears on the current candle stick for faster entries can be used on all charts and renko charts orange dot is your sell signal blue dot is your buy signal
FREE

MA3 Trend MT5 - is the good trend indicator on three MAs . Benefits of the indicator: The indicator produces signals with high accuracy.
The confirmed signal of the indicator does not disappear and is not redrawn.
You can trade on the MetaTrader 5 trading platform of any broker.
You can trade any assets (currencies, metals, cryptocurrencies, stocks, indices etc.).
You can trade on any timeframes (M5-M15 scalping and day trading / M30-H1 medium-term trading / H4-D1 long-term trading).
FREE

Ticaretin sonucunu, gösterge göstergelerini, danışmanın çalışmalarını, ticaret stratejisinin geliştirilmesini analiz etmek için grafiksel bir gösterge.
Bir ana parametre minimum kar yüzdesidir.
Gösterge, kapalı çubuk ve fraktal dikkate alınarak herhangi bir grafikteki tüm eğilimleri gösterir, her trenddeki maksimum kar yüzdesini hesaplar.
Ayrıca, enstrümanın ortalama kar yüzdesini hesaplar. Enstrümanlar arasında daha büyük bir yüzdelik, bu enstrümanın spekülasyon için tarihsel çekiciliğin

Clock GMT Live, komisyoncumuz hakkında daha fazla bilgi edinmek için ihtiyacınız olan her şeye sahiptir, çoğu zaman benim hangi gmt üzerinde olduğumu veya aracımın hangi gmt üzerinde çalıştığını merak etmiş olacaksınız, bu araçla hem GMT'yi hem de gerçek zamanlı olarak öğrenebileceksiniz. komisyoncunun ve yerel saatinizin zaman farkı, ayrıca komisyoncunun pingini de sürekli olarak bileceksiniz Sadece günün bir saatinde yerleştirerek bilgi alabilirsiniz.
Her satın alma için fiyat artar, bununl
FREE

MQL5 "Günlük direnç ve destek" göstergesi - günlük destek ve direnç çizgilerini çizer. Çizim yalnızca grafik nesnelerin (trend çizgileri) yardımıyla gerçekleştirilir - bu göstergede gösterge tamponları kullanılmaz. Göstergenin herhangi bir ayarı yoktur - seviye araması "D1" zaman aralığından son 500 barda gerçekleştirilir ve bu parametre kodun içinde fiziksel olarak bağlanmıştır. Manuel ticaret: Manuel alım satım yaparken, bu göstergenin "M10" ile "H1" arasındaki zaman dilimlerinde kullanılması
Extreme Price Meter Gösterge, geçmiş piyasa bilgilerine dayanarak, yüksek bir tersine dönme olasılığı ile bir sonraki fiyat uç noktasının ne olacağını hesaplar. Alım veya satım olasılığının yüksek olduğu 2 fiyat bandı oluşturur. Bir mum olasılık bantlarının dışında kapandığında yerleştirdiği oklar dikkate alındığında göstergenin yüksek doğruluğunu görmek kolaydır. Masaüstü, telefon ve e-posta için bildirimler.

** All Symbols x All Timeframes scan just by pressing scanner button ** *** Contact me after the purchase to send you instructions and add you in "Wolfe Wave Scanner group" for sharing or seeing experiences with other users.
Introduction: A Wolfe Wave is created with five-wave patterns in price. It shows supply and demand and a fight towards a balance price. T hese waves of price actions can help traders identify the boundaries of the trend . Also It helps forecast how the price will mo

Welcome to the Ultimate Harmonic Patterns recognition indicator that is focused to detect advanced patterns. The Gartley pattern, Bat pattern, and Cypher pattern are popular technical analysis tools used by traders to identify potential reversal points in the market.
Our Ultimate Harmonic Patterns recognition Indicator is a powerful tool that uses advanced algorithms to scan the markets and identify these patterns in real-time.
With our Ultimate Harmonic Patterns recognition Indicator, you

Little Hanzel is t he best spike Detector, the indicator is made for trading Boom and Crash using the 1 min timeframe.It use levels on the 1 min timeframe to detect spikes.A horizontal line(order level) will appear on all the buying levels for on Boom and selling level, horizontal line will also appear on Crash. Join mql5 Little Hanzel channel https://www.mql5.com/en/channels/littlehanzel Input section: Choose Boom for the Boom indices (Boom 1000, Boom 500,and Boom 300 ) Choose Crash for t

T he most Flexible & Reliable Trend-Based Fibonacci indicator by Safe Trading. This indicator helps you calculate Trend-Based Fibonacci levels base on the main and retracement trends to predict future price . If you just looking for a simple Fibonacci Retracement indicator, please use this Free indicator .
### FEATURES ### Auto-calculate up to 7 Trend-Based Fibonacci levels on adjustable frame. Adjust Fibonacci levels as your need. Adjust the start and the end of calculated frame
FREE

TransitTrendlines this is a automatically trendline drawer, it draw both horizontal and diagonal trendlines. The horizontal trendlines are the pivot points of the day timeframe and the diagonal trendlines are based on the current time frames. You can adjust the diagonal trendlines by increasing the number of bars to draw the diagonal trendline and can also adjust the steepness. Note that the Horizontal trendlines are based on the day pivot points not currant time frame. Join mql5 transitbk98 cha
FREE
Introduction to the Magic TD Sequential 9
The "Magic TD 9" is a technical analysis tool for stocks. It is based on historical price data and divides prices into nine levels based on a certain magnitude. It then calculates the average price of each level and constructs a sequence of nine data points. This sequence is called the "Magic TD 9," with the first data point representing the stock's lowest price and the ninth data point representing the highest price.
Index inputs:
1 Turns: repr
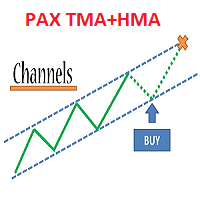
Trade system "PAX Multi TMA/HMA 8" for MT5
It is a ready-made trading system for trading on any instrument and any timeframe.
Completely ready for manual trading and use in robots.
Not redrawn signals ( See the picture )
It is convenient to work on any timeframe.
Tested on metals, currency pairs, oil, international stocks, Russian stocks, cryptocurrencies, monetary and cryptocurrency indices.
What the trading system consists of:
1. The main channel of price movement named Medi

Media Band é um indicador que projeta 8 bandas paralelas a uma media movel de referencia. Podendo auxiliar na visualização da volatilidade do mercado financeiro. Este indicador foi inspirado na necessidade de avaliar melhor uma boa oportunidade de compra e venda dos ativos de acordo com o "seu" operacional. Não pode ser utilizado como recomendação e sim a fins de estudos do Mercado Financeiro.
FREE
This is MT5 version of StochScanner It scans Stochastic from Multi Symbols and Multi Timeframes and displayed on the dashboard on a single chart. . 4 scanning modes: 1. Mode OverBought/OverSold Indicator scans Overbought and OverSold . OverBought : current stochastic is above level 80 and OverSold : current stochastic is below level 20 2. Mode Signal It means if the previous stochastic is on OverBought or OverSold ( either Main Line and Signal Line ) and the current Main Line cross over the curr

The Advanced Pivot Point Indicator is a powerful tool designed to help traders identify key support and resistance levels in the market. This versatile indicator offers a customizable and user-friendly interface, allowing traders to select from five different pivot point calculation methods: Floor, Woodie, Camarilla, Tom DeMark, and Fibonacci. With its easy-to-read lines for pivot points (PP), support (S1, S2, S3, S4), and resistance (R1, R2, R3, R4) levels, the Advanced Pivot Point Indicator pr
FREE

OHLC Volume Histogram displays the difference between two streams of the OHLC Volume volume indicator as a colored histogram. There are no input parameters. Calculation: Histogram = StreamUP - StreamDN where: StreamUP = Volume * UP_Coeff / (UP_Coeff+DN_Coeff) StreamDN = Volume * DN_Coeff / (UP_Coeff+DN_Coeff) UP_Coeff = High-Open DN_Coeff = Close-Low Volume - tick volume

What Is Moving Average Convergence/Divergence (MACD)? Moving average convergence/divergence (MACD, or MAC-D) is a trend-following momentum indicator that shows the relationship between two exponential moving averages (EMAs) of a security’s price. The MACD line is calculated by subtracting the 26-period EMA from the 12-period EMA. The result of that calculation is the MACD line. A nine-day EMA of the MACD line is called the signal line, which is then plotted on top of the MACD line,

“Multi timeframe Slow Volume Strength Index” shows data of three SVSI indicators from different timeframes on the current chart. The indicator has nine adjustable parameters: EMA period – EMA SVSI calculation period Smoothing – SVSI smoothing period Overbought – overbought level Middle – middle line Oversold – oversold level Drawing mode – indicator drawing type Steps – as a ladder Slope – sloping lines First SVSI timeframe – the timeframe of the first SVSI Second SVSI timeframe – th
The Bounce strength indicator (BSI) for meta trader 5 illustrates the strength of the market bounce. The +10 and -10 extreme bounds are used by the indicator. The blue bars show a bullish bounce, while the pink bars show a bearish bounce. The indicator, in essence, depicts market volatility for both up and down moves. When utilized appropriately, the indicator performs equally well on all currency pairs and produces encouraging returns.

Se você está procurando uma maneira de melhorar seus resultados de negociação, então o indicador VWAPiEagleVision é o que você precisa! Este robô é programado para rastrear o VWAP em tempo real e usar essas informações para identificar tendências e oportunidades de negociação lucrativas.
O VWAP (Volume Weighted Average Price) é um indicador amplamente utilizado pelos traders para determinar o preço médio ponderado pelo volume negociado. Ele é comumente usado por traders institucionais e pode
FREE
Mumun sonuna kadar geçen sürenin göstergesi. Sunucu saatinin yanı sıra mumun sonuna kadar geçen süreyi gösterir. Metin, mumun eğilimini veya yönünü görüntüleyebilir, sesli bildirimler yerleşiktir özellikler:
Mevcut mumun sonuna kadar olan süreyi ve gerekirse ayarlanabilen veya devre dışı bırakılabilen diğer zaman dilimlerini görüntüler. AW Mum Zamanı, AW Süper Trend göstergesi ile mevcut mumun veya trendin yönünü seçebilir Trend stratejisi seçilen renkte vurgulanır Mumu değiştirmeden önce yerle
FREE
MetaTrader Mağaza, geçmiş verilerini kullanarak test ve optimizasyon için ticaret robotunun ücretsiz demosunu indirebileceğiniz tek mağazadır.
Uygulamaya genel bakışı ve diğer müşterilerin incelemelerini okuyun, doğrudan terminalinize indirin ve satın almadan önce ticaret robotunu test edin. Yalnızca MetaTrader Mağazada bir uygulamayı tamamen ücretsiz olarak test edebilirsiniz.
Ticaret fırsatlarını kaçırıyorsunuz:
- Ücretsiz ticaret uygulamaları
- İşlem kopyalama için 8.000'den fazla sinyal
- Finansal piyasaları keşfetmek için ekonomik haberler
Kayıt
Giriş yap
Gizlilik ve Veri Koruma Politikasını ve MQL5.com Kullanım Şartlarını kabul edersiniz
Hesabınız yoksa, lütfen kaydolun
MQL5.com web sitesine giriş yapmak için çerezlerin kullanımına izin vermelisiniz.
Lütfen tarayıcınızda gerekli ayarı etkinleştirin, aksi takdirde giriş yapamazsınız.