MetaTrader 5용 새 기술 지표 - 22
A top and bottom indicator that can intuitively identify the trend of the band. It is the best choice for manual trading, without redrawing or drifting. Price increase of $20 every 3 days, price increase process: 79--> 99 --> 119...... Up to a target price of $1000. For any novice and programming trading friend, you can write the signal into the EA to play freely. Array 3 and array 4, for example, 3>4 turns green, 3<4 turns red. If you don't understand, please contact me. ====================P
The "ZigZag_OsMA" indicator is a powerful tool designed to enhance price chart analysis within the MetaTrader 4 platform. This custom indicator amalgamates the strengths of two renowned indicators: ZigZag and OsMA (Moving Average of Oscillator), resulting in a comprehensive visualization that aids traders in making informed decisions.
The indicator employs color-coded candlesticks to represent market trends. It dynamically adjusts the high and low prices of each candlestick based on ZigZag va

The "MA_Candles" indicator is a customizable technical tool designed for the MetaTrader 5 trading platform. It enhances price chart analysis by visually representing candlesticks with distinct colors based on a moving average (MA) calculation. This indicator helps traders identify potential trend reversals and market sentiment shifts.
The "MA_Candles" indicator enhances MetaTrader 5 charts by coloring candlesticks based on a moving average (MA) calculation. It helps traders quickly identify

Considerando que os preços de OHLC de períodos anteriores são regiões importantes de negociação, criei um indicador que traça linhas de Open, High, Low e Close do dia, semana ou mês anterior no gráfico atual. Além de marcar essas regiões, linhas extras foram inseridas como opção que marcam os MEIOS (50%) dessas regiões e uma linha que marca a ABERTURA do dia. O usuário pode configurar a exibição das linhas que achar mais expressivas. Configurações: PERIOD RANGE Timeframe = Período de referência

Indicador tipo 2mv frequência mostra os níveis percentuais no mercado financeiro que tendem a ser zonas realmente importantes para os traders. Observem que o preço segue um fluxo e uma frequência que se enquadram em canais percentuais de movimento, tradicionalmente traçados por níveis Fibonacci. O indicador LevelsPercent traça linhas em pontos específicos de percentual configurados pelo usuário e "pode" anteceder possíveis níveis de SUPORTE e RESISTÊNCIA. A leitura do mercado e a identificação

혁신적인 MT5 지표인 DARWIN Assistant 을 소개합니다. 성공적인 거래의 세계로 가는 궁극적인 관문입니다! 정확성과 전문성으로 설계된 DARWIN Assistant 은 RSI, 스토캐스틱, CCI 및 추세와 같은 고급 기술 지표의 힘을 모든 시간대에 걸쳐 활용하는 특별한 전략에 따라 운영됩니다. 이 최첨단 지표는 진입을 위한 가장 정확한 신호를 제공하므로 비교할 수 없는 확신을 가지고 시장을 탐색할 수 있으므로 특별한 거래 경험에 대비하십시오.
DARWIN 트래픽을 사용하면 가장 수익성이 높은 거래 기회를 감지할 수 있도록 세심하게 보정된 중요한 지표에 대한 포괄적인 분석에 액세스할 수 있습니다. 불확실성에 작별을 고하고 정보에 입각한 의사 결정의 새로운 시대를 맞이하십시오. RSI, Stochastics, CCI 및 Trends가 DARWIN Assistant 내에서 원활하게 수렴되어 전례 없는 시장 역학을 생생하게 보여줍니다.
DARWIN Assi

자동 고정 VWAPs로 거래 통찰력 해제하기: 자동 고정 VWAPs 는 거래 세계에서의 당신의 안내자입니다. 이 인디케이터들은 중요한 시장 전환점을 정확하게 찾아 VWAP 라인을 사용하여 차트에 나타냅니다. 이것은 고정 VWAP 전략을 사용하는 트레이더에게 혁명을 가져다주는 것입니다. 어떻게 작동하나요? 고점 식별: 현재 양초의 가장 높은 가격이 이전 양초의 가장 높은 가격보다 낮을 때, 그리고 이전 고점이 그보다 이전에 나온 고점보다 높을 때, 우리는 고점을 식별한 것입니다. 이 중요한 지점은 이 세 개의 양초 중간에 위치합니다. 저점 인식: 현재 양초의 최저 가격이 이전 양초의 최저 가격보다 높을 때, 그리고 이전 저점이 그보다 이전에 나온 저점보다 낮을 때, 우리는 바닥을 발견했습니다. 이 바닥의 중심이 바로 우리의 초점입니다. 고정된 VWAPs 그리기: 각 상단과 하단은 VWAP 라인에 해당합니다. 그러나 제한이 있습니다: 인디케이터의 계산 요구 사항으로 인해 차트에서 동시에

Introduction
WaveTrend Plus is an amazing oscillator that can detect optimal entry points in the market with high precision using complex computations of price and momentum. This version packs many improvements compared to the original WaveTrend such as cleaner visuals, oversold/overbought signals and divergence detection
Signal
Buy when oversold signal appear (green dot below) or when a bullish divergence is detected (green dashed line)
Sell when overbought signal appear (red dot ab
FREE

The Clean Trading Sessions indicator shows the most significant trading sessions for the Forex market, such as London, New York, Tokyo. The Clean Trading Sessions indicator is a simple and, at the same time, quite functional Forex sessions indicator, developed for the MT5 terminal. It is available to download for free.
How is this Forex market session indicator used? Traders normally use trading sessions to determine the volatile hours throughout the day, since the trading activities vary
FREE
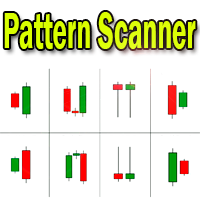
Candlestick pattern indicator - display found candlestick patterns on the chart. MT4-version: https://www.mql5.com/en/market/product/103345 Bearish patterns: Bearish Pattern Designations Pattern name SS
Shooting Star STR(S) Evening Star DJ(E) Evening Doji Star DC Dark Cloud Veil BEP Bearish Engulfing Bullish patterns: Designation of bullish patterns Pattern name HMR
Hammer pattern
STR(M) Morning Star DJ(M) Morning Doji Star PRL Piercing Line BEP Bullish Engulfing The

Introduction The "Ultimate Retest" Indicator stands as the pinnacle of technical analysis made specially for support/resistance or supply/demand traders. By utilizing advanced mathematical computations, this indicator can swiftly and accurately identify the most powerful support and resistance levels where the big players are putting their huge orders and give traders a chance to enter the on the level retest with impeccable timing, thereby enhancing their decision-making and trading outcomes.
FREE

-- BEST SWING --
L'indicateur BEST SWING est un indicateur technique personnalisé, un excellent outil pour négocier les cassures en fonction des niveaux de support et de résistance horizontaux. L'indicateur BEST SWING utilise une formule complexe en analysant des données de prix autrement incongrues sur les cours de clôture de chaque période, ainsi que les hauts et les bas du prix, afin de donner un aperçu de la force ou de la faiblesse de la tendance du marché et de sa probabilité

Indicator Type Strategy (Pullback) for all Symbols and Periodicity, Preferably from 30M periodicity. Can be used for manual trading. Its workspace corresponds to channel of 3 bars of Bill Willians. Also relies on the indicator Rsi and Atr. BUY when: There is a Green Arrow STOPLOSS to buy, below the bottom line of the channel (red line)" SELL when: There is a Red Arrow. STOPLOSS to sell, above the upper line of the channel (blue line)

The Visual Result Calculator Indicator is a powerful tool designed to enhance your trading experience on the MetaTrader platform. This intuitive and user-friendly indicator allows you to visualize potential profits or losses on a trading chart, helping you make better-informed decisions and manage your trades with precision. The Indicator displays a dynamic line on the trading chart, representing the potential profit or loss of a trade based on the start and end of the line. Simply click and
FREE
King Binary Profit System
1 minute candle
3-4 minute expire
Alright. This indicator works on MT5 and is very easy to use. When you receive a signal from it, you wait for that candle with the signal to close and you enter your trade at the beginning of the next new candle. A red arrow means sell and a green arrow means buy. All arrows comes with a long dotted like for easy identification of trade signal. Are you okay with that?

The Volume Plus indicator for MT5 can be effectively used for detecting imbalances in supply and demand.
The indicator improves on the typical volume histogram by coloring the bars.
Bar colors (colors are customizable):
Neutral - DimGray Wide Spread (Range) Bar on High Volume - MediumBlue Narrow Spread, High Volume - MidnightBlue Wide Spread, Low Volume - ForestGreen Narrow Spread, Low Volume - DarkGreen Very/Ultra Wide Spread, Low Volume - Aqua Narrow Spread, Ultra High Volume - Purple V
FREE

This indicator is a zero-lag indicator and displays exact trend as is. True Trend Moving Average Pro works best in combination with True Trend Oscillator Pro that displays strength of trend change.
True Trend Oscillator Pro: https://www.mql5.com/en/market/product/103589
If you set PERIOD input parameter to 1 this indicator becomes a sharpshooter for binary options.
Default input parameters: TT_Period = 10; TT_Meth = MODE_SMA; TT_Price = PRICE_MEDIAN;
Before you buy this product, please
FREE

This indicator is a zero-lag indicator and displays strength of trend change . True Trend Oscillator Pro works best in combination with True Trend Moving Average Pro that displays exact trend as is. Oscillator value is exact price change in given direction of the trend.
True Trend Moving Average Pro: https://www.mql5.com/en/market/product/103586
If you set PERIOD input parameter to 1 this indicator becomes a sharpshooter for binary options.
Developers can use True Trend Oscillator in E
FREE
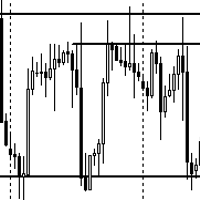
The Vice Supply and Demand Zones MT5 Indicator is a powerful tool designed to identify potential supply and demand zones on price charts. These zones represent areas where market forces of supply and demand are likely to cause significant price movements. The indicator helps traders to spot key support and resistance levels, aiding in making informed trading decisions. Indicator Features: Supply Zones: The indicator plots blue rectangles on the chart to identify potential supply zones. Supply z
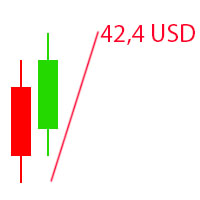
The Visual Result Calculator Indicator is a powerful tool designed to enhance your trading experience on the MetaTrader platform. This intuitive and user-friendly indicator allows you to visualize potential profits or losses on a trading chart, helping you make better-informed decisions and manage your trades with precision. The Indicator displays a dynamic line on the trading chart, representing the potential profit or loss of a trade based on the start and end of the line. Simply click and

Hidden Gap by MMD Hidden Gap by MMD is a unique indicator that detects hidden gaps between three consecutive candles. This observation isn't my own, but in the MMD methodology, it has its application alongside other original indicators. You can apply this indicator to the chart multiple times and set the interval from which you want to see the hidden gaps. You can show or hide these gaps as needed. For example, you can view the chart at an M5 interval and see hidden gaps from an M15 chart, etc.

【Super Scanner】Indicator Introduction : The color of the Super Scanner which is green and climbing up means that the price trend is going up.The color of the Super Scanner is red and going down means that the price trend is going down.
It is very simple to use it to judge the market trend! What's even better is that the open parameters of the indicators allow investors to adjust. You can adjust【Super Scanner】according to your needs. Adjust it faster to be closer to short-term market fluctuati
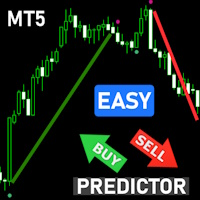
Easy By Sell est un indicateur de marché pour l'ouverture et la fermeture de positions. Il devient facile de suivre les entrées sur le marché.
Il indique les points de retournement de tendance lorsqu'un prix atteint des valeurs extrêmes et le moment le plus favorable pour entrer sur le marché. il est aussi efficace qu'un Fibonacci pour trouver un niveau mais il utilise des outils différents comme un algorithme basé sur des indicateurs ATR et Stochastic Oscillator. Vous pouvez modifier ces deu
FREE

Easy By Sell is a market indicator for opening and closing positions. It becomes easy to track market entries with alerts.
It indicates trend reversal points when a price reaches extreme values and the most favorable time to enter the market. it is as effective as a Fibonacci to find a level but it uses different tools such as an algorithm based on ATR indicators and Stochastic Oscillator. You can modify these two parameters as you wish to adapt the settings to the desired period.
My othe

차트에 수동으로 피보나치 레벨을 그리는 데 지쳤습니까? 거래에서 주요 지지선과 저항선을 식별할 수 있는 편리하고 효율적인 방법을 찾고 계십니까? 더 이상 보지 마세요! 자동 피보나치 수준 을 수행하는 최고의 MetaTrader 5 지표인 DrawFib Pro를 소개합니다. 차트에 그림을 그리고 이러한 수준이 위반되면 적시에 경고를 제공합니다. DrawFib Pro를 사용하면 거래 전략을 강화하고 시간을 절약하며 정보에 입각한 결정을 내릴 수 있습니다. 내 피보나치 기반 지표 : Advanced Gartley Pattern MT5 || Price Wave Pattern MT5 주요 특징들:
자동화된 피보나치 그리기. 사용자 지정 가능한 매개변수. 정확 하고 신뢰할 수 있음. 실시간 알림. 사용자 친화적인 인터페이스. DrawFib Pro는 효율적이고 신뢰할 수 있으며 사용자 친화적인 방식으로 차트에 피보나치를 자동으로 그
FREE

The Volume+ and VSA Signals indicator for MT5 is based on the Volume Spread Analysis (VSA) methodology to provide the signals. The signals are displayed at closing of bars on the main window or subwindow in the form of symbols. The symbols are not repainting. The indicator produces a signal on an individual bar and this signal is not buy or sell signal. When a minor trend goes in the opposite direction of a major trend, there are sequences of major trend-following signals that give a higher pro

Ali Levels Pro is an indicator designed to identify and draw levels of interest including: Opening Range High/Low with seconds precision, Previous Session High/Low (if you are a Intraday trader who trades Indices or Commodities maybe you want to know yesterday New York Session high and low), Overnight Session High/Low, Previous Day High/Low, Previous Week High/Low, and Previous Month High/Low.
Traders use this levels as support and resistance levels. By searching for confluences between

Introduction
Reversal Candles is a cutting-edge non-repainting forex indicator designed to predict price reversals with remarkable accuracy through a sophisticated combination of signals.
Signal Buy when the last closed candle has a darker color (customizable) and an up arrow is painted below it Sell when the last closed candle has a darker color (customizable) and a down arrow is painted above it
FREE

Indicator Description: FVG Imbalance Zones The FVG Imbalance Zones indicator is a powerful tool designed to identify potential price imbalances on financial charts. Developed by Pierre-Alexis Blond, this innovative indicator marks regions where significant price shifts may occur, offering traders valuable insights into potential market turning points. Key Features: Imbalance Detection: FVG Imbalance Zones identifies potential price imbalances in the market, pinpointing areas where supply and d

hello,
king binary sureshot mt5 binary indicator,
1 minute candle
1 minute expire
Alright. This indicator works on MT5 and is very easy to use. When you receive a signal from it, you wait for that candle with the signal to close and you enter your trade at the beginning of the next new candle. A red arrow means sell and a green arrow means buy. All arrows comes with a long dotted like for easy identification of trade signal. Are you okay with that?
FREE

The Binary Tend Follower indicator has been designed especially for Binary options trading. The best time frame to use the indicator on is a 1M chart with 1Min expiry's as soon as the signal candle closes. There is no need to over complicate your trading as all the thinking has been done for you. The indicator was designed as simple as possible to take out all the subjectivity of trying to follow a complicated strategy, and allowing the trader to focus on extremely simple entry's. Buy: When the

Introducing the Order Block Indicator , the pinnacle of trading technology. Order blocks, the large cluster of buy or sell orders placed by institutional traders, significantly influence market direction. They form at critical price levels and can act as robust support and resistance zones. Our cutting-edge indicator allows you to harness the full potential of these influential market dynamics, providing a never-before-seen level of precision and customization. Here's why this tool stands apart:

"Volality 75 Boom Crash VIX" is an advanced analysis tool designed to identify key breakout zones in volatile asset pairs and boom crashes. Its focus is on highlighting moments of high volatility in the market.
This indicator is perfect for both scalping and swing trades.
"Volality 75 Boom Crash VIX is not just an indicator, but a trading strategy in itself.
The most recommended timeframe for using the indicator is 15M MINUTES.
The breakout levels represent the balance between bullish a
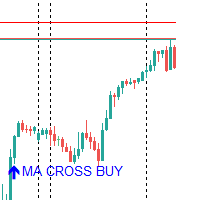
This indicator does not repaint, it is a trend indicator created to trade all financial instruments; go watch the video of the presentation on youtube https://youtu.be/OyhGcmgpzdQ you can do swin, day trading and scalping depending on the settings you will receive after your purchase, join my telegram channel @ASTBOSSA MY USERNAME FOR TELEGRAM GOOD LUCK TIMEFRAME: H1,H4,D1 (98% WIN RATE FOR ALL MARKET)

Kindly rate and comment about the product for upgradation & Support
The 5 EMA is plotted in green color ( Lime ).
The 14 EMA is plotted in red color ( Red ).
The 20 EMA is plotted in blue color ( Blue ).
The 200 EMA is plotted in yellow color ( Yellow ).
The Quarter EMA that provided calculates and plots four Exponential Moving Averages (EMAs) on the chart using different periods: 5, 14, 20, and 200. Each EMA is represented by a different color on the chart. Here's a description of each
FREE

This indicator uses a mathematical calculation algorithm . This algorithm calculates the remainder between the updated model and the actual values and produces the possible progress of the graph on the graph. It is not a super prophet in trading, but it is very good for the trader when entering the market and to analyze it before entering. Applicable for all currencies. Данный индикатор использует алгоритм математических вычислений . Данный алгоритм вычисляет остаток между обновленной моделью и

The selective pin bar is designed to identify reversals. To use the selective pin bar effectively, traders typically look for Strong Rejection: The tail of the pin bar should extend significantly beyond the surrounding price action. It indicates that there was a sharp rejection of higher or lower prices during the trading period. A strong rejection suggests that the market sentiment may be changing.
FREE

This Indicator breaks down the movement into 3 waves: The primary wave suitable for long-term trading The intermediate wave suitable for intraday trading The minor wave for short-term trading
Supports and resistances:
Each wave is defined by major highs and minor lows. According to Dow's theory, an uptrend will be defined by minor lows higher and higher and a downtrend by major highs lower and lower.The indicator plots the next supports and resistances for each wave.
Trend channels (primary
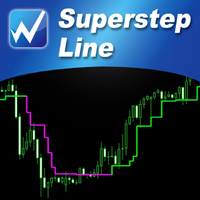
【SuperStep Line】Indicator Introduction : The color of the SuperStep line which is green and climbing up means that the price trend is going up.The color of the SuperStep line is purple and going down means that the price trend is going down.
It is very simple to use it to judge the market trend! What's even better is that the open parameters of the indicators allow investors to adjust. You can adjust 【SuperStep Line】 according to your needs. Adjust it faster to be closer to short-term market

DoubleMACD DoubleMACD DoubleMACD DoubleMACD DoubleMACD DoubleMACD DoubleMACD DoubleMACD DoubleMACD DoubleMACD DoubleMACD DoubleMACD DoubleMACD DoubleMACD DoubleMACD DoubleMACD DoubleMACD DoubleMACD DoubleMACD DoubleMACD DoubleMACD DoubleMACD DoubleMACD DoubleMACD DoubleMACD DoubleMACD DoubleMACD DoubleMACD DoubleMACD DoubleMACD
FREE

MT4 Version GaussChannelPro is a powerful and innovative trading indicator designed to enhance your trading strategy with the precision of Gaussian-based channels. Leveraging the principles of Gaussian (normal) distribution, this indicator creates a unique channel on your price chart, offering valuable insights into market trends and potential turning points. Utilizing advanced statistical analysis, GaussChannelPro calculates the optimal channel boundaries based on historical price data, present

모닝 브리핑 여기 mql5 와 텔레그램에서 FX Power MT5 NG 는 오랫동안 인기 있는 통화 강도 측정기인 FX Power의 차세대 버전입니다. 이 차세대 강도 측정기는 무엇을 제공합니까? 기존 FX Power에서 좋아했던 모든 것 PLUS GOLD/XAU 강도 분석 더욱 정밀한 계산 결과 개별 구성 가능한 분석 기간 더 나은 성능을 위한 사용자 정의 가능한 계산 한도 특별 멀티더 많은 것을보고 싶은 사람들을위한 특별한 다중 인스턴스 설정 모든 차트에서 좋아하는 색상을위한 끝없는 그래픽 설정 수많은 알림 옵션, 중요한 것을 다시는 놓치지 않도록 Windows 11 및 macOS 스타일의 둥근 모서리가 있는 새로운 디자인 마법처럼 움직이는 인디케이터 패널
FX 파워 키 특징 모든 주요 통화의 완전한 강세 이력 모든 시간대에 걸친 통화 강세 이력 모든 브로커 및 차트에서 고유 계산 결과 100% 신뢰할 수있는 실시간100 % 신뢰할 수있는 실시간 계산-> 다시 칠하지 않음

트렌드 캐쳐:
알림 인디케이터와 함께 하는 트렌드 캐쳐 전략은 시장 트렌드와 잠재적인 진입 및 체크 포인트를 식별하는 데 도움이 되는 다목적 기술 분석 도구입니다. 이는 시장 상황에 적응하여 트렌드 방향을 명확하게 시각적으로 표현하는 동적 트렌드 캐쳐 전략을 제공합니다. 트레이더는 선호도와 위험 허용도에 맞게 매개변수를 사용자 정의할 수 있습니다. 이 인디케이터는 트렌드 식별을 지원하고 잠재적인 반전을 신호로 제공하며 트레일링 스탑 메커니즘으로 작동하며 실시간 경고를 제공하여 신속한 시장 대응을 돕습니다.
특징:
- 트렌드 식별: 상승 트렌드와 하락 트렌드를 신호합니다. - 트렌드 반전: 양봉 색상이 상승에서 하락으로 변경되거나 그 반대의 경우 잠재적인 반전을 경고합니다. - 실시간 경고: 새로운 트렌드 식별을 위한 경고를 생성합니다.
추천사항:
- 통화 및 페어: EURUSD, AUDUSD, XAUUSD 등... - 시간 프레임: H1. - 계정 유형: 모든 E
FREE

이 도구로 시장 구조를 빠르게 분석하고 중요한 가격 수준을 활용하세요.
시장 구조 이 사용자 지정 인디케이터는 중요한 가격 수준을 표시하며, 진입점 또는 수익 목표로 사용할 수 있습니다.
트레이딩 범위 파악 시장 턴오버 포인트를 참고하여 이 지표로 스캘핑하세요.
브레이크아웃 트레이딩 기회 이 지표를 사용하여 브레이크아웃 기회를 포착하세요. 이 트레이딩 전략은 우수한 위험 대비 보상 비율을 제공합니다.
맞춤 알림 가격이 특정 거래 범위를 벗어나면 휴대폰으로 알림을 받거나 이메일로 받아보세요. 이러한 알림을 트레이딩 전략에 맞게 사용자 지정해야 한다고 생각되면 언제든지 메시지를 보내주세요.
스마트 머니 개념 이 인디케이터는 스마트 머니 개념을 따르기 위해 독점 트레이더와 협력하여 개발되었습니다.
심플한 디자인 차트에 가능한 모든 영역을 그리는 대신 따라야 할 주요 영역이라고 생각되는 레벨 만 그리기로 결정했습니다. 따라서 지표가 간단하여
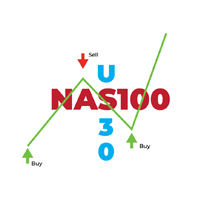
The NAS30 Scalper Indicator is a cutting-edge tool designed to provide precise buy and sell signals for scalping trading strategies on NAS100 and US30. This indicator leverages advanced algorithms to identify short-term market trends and capitalize on quick price movements, making it perfect for traders looking to seize rapid profit opportunities. Key Features: Real-Time Signals: Receive instant alerts when the indicator detects optimal entry and exit points, ensuring you never miss a profitable

Introduction
The Bounce Zone indicator is a cutting-edge non-repainting technical tool built to identify key areas on the price chart where market sentiment is likely to cause a significant price reversal. Using advanced algorithms and historical price data analysis, this indicator pinpoints potential bounce zones. Combined with other entry signal, this indicator can help forex traders place the best trades possible
Signal
A possible buy signal is generated when price is in the green zo
FREE
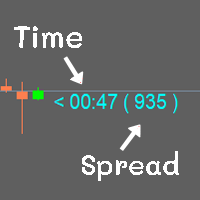
Show the time of candlesticks and spread. All data will be displayed in a rod. Can change color Can fix the size as needed
MT4 : Link https://www.mql5.com/en/market/product/102742 MT5 : Link https://www.mql5.com/en/market/product/102834
Most free code on various websites I didn't write it myself. I only do a little bit.
If you like it, please give 5 stars with it. Thank you.
FREE

Introduction
The PF Maximizer is a game-changing non-repainting technical tool engineered to help traders distinguish genuine trend signals from erratic market fluctuations. By employing sophisticated algorithms and cutting-edge data analysis, this indicator efficiently filters out unwanted noise, empowering traders to identify the precise starting and ending points of substantial market moves.
Signal
Potential buy signal is generated when moving average is going up and the blue line c
FREE

We value your feedback and believe that your experience with the Hull Moving Average (HMA) is essential to us and other traders. Help us continue to improve and refine our product by sharing your thoughts and insights through a review!
The Hull Moving Average (HMA) Indicator – Your Key to Smoother Trends and Profitable Trades! Are you tired of lagging and choppy moving averages that hinder your ability to spot profitable trading opportunities? Look no further! The Hull Moving Average (HMA) is
FREE
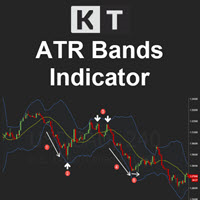
KT ATR Bands draws the volatility envelops and bands using a combination of Average True Range and Moving average. They are typically used to identify the potential reversal points and the periods of high and low volatility.
Features
Multi-Timeframe Ability: For example, you can have the atr bands from the daily timeframe on the H1 timeframe. Smart Alerts: You can turn on/off alerts for each band separately. Also, you can choose a minimum time interval between each alert to stop unnecessary,
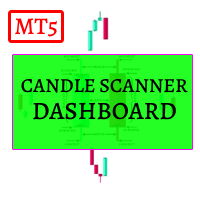
Candle Scanner Dashboard is an incredibly powerful tool in the financial markets. It excels at detecting market reversals, trend changes, and retracements. The dashboard displays patterns as they are identified, and with a simple click on each pattern, you can view them on their dedicated charts to precisely locate their occurrences. With its capability to detect 11 popular bullish and 11 bearish patterns, you can trust the dashboard to handle pattern identification effortlessly. It provides an
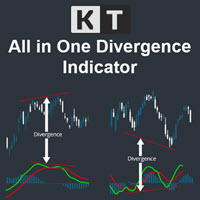
The KT All-In-One Divergence is designed to identify regular and hidden divergences between the price and 11 widely recognized oscillators. This powerful tool is indispensable for swiftly and accurately spotting market reversals. Its a must-have tool in any trader's arsenal, providing clear and accurate divergence patterns. Its accuracy and speed in identifying market reversals are remarkable, allowing traders to seize profitable opportunities confidently.
Features No Interference: You can a

Hello There,
Today I want to show you my new researchable fore BUY SELL indicator,
it work all asset,
and also work Derive Volatility asset!
it work all time frame, but i recommend start 5 minute to H1
when you receive a signal just take trade and stay wait for your take profit
asset
All Major Pair And minor
IT WORK ALSO XAUUSD
Fantastic results,
for more info,,, message us
thank you

Volume Cross Over is an indicator that measure positive and negative volume flow in a financial instrument, such as a stock, commodity, or index. It is base on the idea of On-Balance Volume developed by Joseph Granville. However instead of trending lines, this indicator shows volume cross over. When the closing price of an asset is higher than the previous closing price, then the Bull volume is greater than zero and Bear volume is negative. It suggests that buying volume is dominating, and
FREE
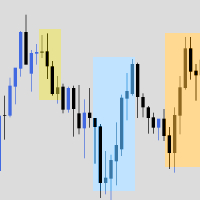
The indicator is a bundle of EIGHT different fundamental functions required for a trader: 1] Forex Session where you can determine your own timings/highlights. 2] High low marking from 1H to 1M 3] Sweetspot 4] Spread and Candle Stick Timer 5] Background logo for branding- You can place the images at any zone of the chart you want 6] Profit and Loss 7] Days names (SUN MON TUE…) on the chart 8] High/low break notification

The indicator is created using a unique algorithm that has no analogues. Based on the calculations, the contract price itself and the percentages displayed in it are calculated, which are displayed in the indicator in the form of histograms in two drawing options, as well as in six options for displaying prices on a chart in various combinations, which allows you to accurately see the interest of all trading participants in the form of drawing levels support and resistance. Trading decisions can
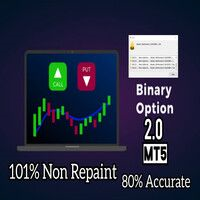
Alright. This indicator works on MT5 and is very easy to use. When you receive a signal from it, you wait for that candle with the signal to close and you enter your trade at the beginning of the next new candle. A red arrow means sell and a green arrow means buy. for easy identification of trade signal. Are you okay with that?
The indicator cost $500. We release new updates of the indicator every month and the updates are for free once you bought the indicator first time. This indicator was

KT DMA is a modified and advanced version of the classic Displaced Moving Averages with buy/sell crossover alerts and a Multi-Timeframe scanner that shows DMA's direction across each real-time time frame. A Displaced Moving Average is a simple moving average that moves ahead or backward in a time frame (either short-term or long-term). It also allows you to predict price movement more accurately.
Features Depicts the trend direction using the alignment of three moving averages. Buy/Sell signa
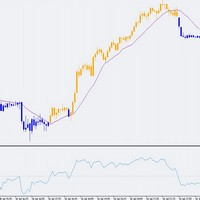
This indicator can be very important in any trading system. The Indicator colors candles above or below the 50 level of the RSI, which is a widely used indicator in technical analysis. With this indicator it is much easier to identify trends, helping with the entry and exit points of negotiations. It is a fact that in the financial market, simple things work. Este indicador pode ser muito importante em qualquer sistema de negociação. O Indicador colore as velas acima ou abaixo do nível 50 do

1. GENERAL DESCRIPTION OF THE TREND RENEWAL INDICATOR The Trend Renewal Indicator (TRI) is a simple yet very powerful trend-following indicator that works on the MT5 trading platform of MetaQoutes (MLQ5). The TRI indicator suits small and large accounts, and is ideal for very large accounts. It has been used for decades by fund managers and institutional traders, but never offered to retail traders. The TRI works with any instrument, including currencies, crypto currencies, metals, hard and soft

The RSI (Relative Strength Index) scanner is a powerful technical analysis tool designed to help traders and investors identify potential trading opportunities in the forex, stocks, and cryptocurrency markets. RSI is a popular momentum oscillator that measures the speed and change of price movements and helps determine overbought or oversold conditions in an asset. The scanner takes advantage of this indicator to streamline the process of finding trading signals and opportunities. The RSI value
FREE

KT Triple Top-Bottom identifies the triple top/bottom pattern with a breakout signal in the opposite direction. It is used to identify potential trend reversals.
A Triple Top pattern is formed when the price reaches a high point three times, while a Triple Bottom pattern occurs when the price comes to a low point three times.
Features The indicator detects the triple top/bottom pattern with high precision and accuracy. The indicator suggests a shift in momentum, with sellers or buyers takin

Introducing the Aroon Indicator - Your Ultimate Trend Analysis Tool!
Are you looking to take your trading game to the next level? Want to identify lucrative entry and exit points in the financial markets with ease? Look no further! The Aroon Indicator is here to revolutionize your trading strategy and help you make informed decisions like never before.
Developed by the brilliant mind of Tushar Chande, the Aroon Indicator is a powerful technical analysis tool designed to measure the strength
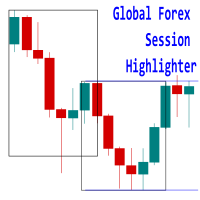
Introducing the 'Global Forex Session Highlighter' , a powerful tool designed to enhance your trading strategy by providing a visual representation of the Three major Forex trading sessions: Tokyo, London, and New York. This indicator is designed to help traders understand the dynamics of the global Forex market by highlighting the trading sessions directly on your MT5 chart. It provides a clear view of when each session starts and ends, allowing you to strategize your trades around the most act

LT 회귀 채널을 발견하세요. 이는 피보나치 분석, 엔벨로프 분석 및 푸리에 외삽의 요소를 결합한 강력한 기술 지표입니다. 이 지표는 시장 변동성을 평가하며 피보나치 분석을 통해 과매수 및 과매도 수준을 정확하게 식별하도록 설계되었습니다. 또한 이러한 지표의 데이터를 통합하여 시장 움직임을 예측하기 위해 푸리에 외삽을 활용합니다. 우리의 다용도 도구는 독립적으로 또는 다른 지표와 조합하여 사용할 수 있습니다. 다양한 시간대 및 차트 유형과 호환되며 Renko 및 Heiken Ashi와 같은 사용자 정의 옵션도 포함됩니다. 일부 재그리기가 발생할 수 있지만 장기 시간대(500 이상 권장)로 갈수록 안정성이 크게 향상됩니다. 더 큰 시간대에서는 더 정확한 예측을 제공합니다. LT 회귀 채널의 힘을 여러분의 거래 전략에 경험해보세요. 지금 바로 시도해 보세요!
FREE

시장 동향에 대한 명확한 통찰력을 제공하도록 설계된 Heiken Ashi 양초는 노이즈를 필터링하고 잘못된 신호를 제거하는 기능으로 유명합니다. 혼란스러운 가격 변동에 작별을 고하고 더 매끄럽고 신뢰할 수 있는 차트 표현을 만나보세요. Quantum Heiken Ashi PRO를 정말 독특하게 만드는 것은 전통적인 촛대 데이터를 읽기 쉬운 색상 막대로 변환하는 혁신적인 공식입니다. 빨간색과 녹색 막대는 각각 약세와 강세 추세를 우아하게 강조하여 잠재적 진입점과 퇴장점을 매우 정확하게 파악할 수 있습니다.
Quantum EA 채널: 여기를 클릭하세요
MT4 버전: 여기를 클릭하세요
이 놀라운 지표는 다음과 같은 몇 가지 주요 이점을 제공합니다. 선명도 향상: Heiken Ashi 바는 가격 변동을 완화하여 시장 추세를 보다 명확하게 나타내므로 유리한 거래 기회를 쉽게 식별할 수 있습니다. 소음 감소: 종종 잘못된 신호로 이어지는 불규칙한 가격 변동

이 지표는 My Candle Complete의 데모 버전으로, 여기에서 다운로드할 수 있습니다: Candle Patterns Creator 전체 버전을 사용하면 자신만의 캔들 규칙을 생성하고 전통적인 캔들 패턴을 전략에 맞게 수정하여 더 정확하게 조정할 수 있습니다. 이 지표에는 여러 가지 캔들 규칙 예제가 포함되어 있지만, 여기에서는 일부만을 소개합니다: Pattern Rule Candle Green C > O Candle Red C < O Doji C = O Hammer (C > O and (C-O) *2 < O-L and (C-O) *0.5 > H-C) or (C < O and (O-C) *2 < C-L and (O-C) *0.5 > H-O) Hammer Green C > O and (C-O) *2 < O-L and (C-O) *0.5 > H-C Hammer Red C < O and (O-C) *2 < C-L and (O-C) *0.5 > H-O Marubozu (C > O
FREE

스마트 바이너리 볼륨 인디케이터는 거래량 분석과 머신 러닝을 결합한 다목적 도구입니다. 스캘핑과 같은 단기 거래를 포함하여 다양한 시장과 전략에 적용할 수 있습니다. 고급 머신 러닝 알고리즘을 사용하여 이 인디케이터는 복잡한 패턴을 인식하고 더 정확한 매수 및 매도 신호를 생성합니다.
Buffer to Create EA. Buffer Line Gold = 0. Buffer Line Red = 2 Buffer AI = 3
AI Buffer >= 0 ("SIGNAL BUY")
AI Buffer <= 0 ("SIGNAL SELL")
사용 팁:
1. 대비되는 선들에 주의하십시오: Smart Binary Volume 지표의 선들이 대비되는 움직임을 보이는 상황에 주목하십시오. 이러한 조건은 진입 신호를 나타낼 수 있습니다.
2. 상승 신호: 파란색 라인이 0.30보다 높고 빨간색 라인이 -0.30 아래에 위치하는 경우 주의하세요. 이러한 설정은 상승

The main objective of this indicator is to determine entry and exit points, that is why ExactArrow draws nothing but arrows showing entry and exit points. In spite of apparent simplicity of the indicator, it has complicated analytic algorithms which determine entry and exit points. The indicator generates exact and timely entry and exit signals which appear on the current candle. The indicator generates an average of 1-2 candles before its analogues do. The indicator is very easy to use. Open Bu
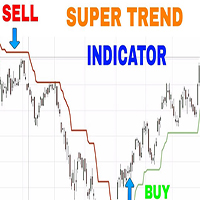
As the name suggests, it indicates the direction of the price movement in a market that is trending, that is following any particular path . It is plotted in stock price charts for investors to see marked current trend which is shown in red when prices have dipped and green when prices have risen.
Input Parameters:
CCI Indicator period ATR Indicator Period CCI Activation level Horizontal Shift of Indicator Bars
Otherwise ; You can use the Default settings
트레이딩 전략과 기술 지표를 판매하기에 가장 좋은 장소가 왜 MetaTrader 마켓인지 알고 계십니까? 광고나 소프트웨어 보호가 필요 없고, 지불 문제도 없습니다. 모든 것이 MetaTrader 마켓에서 제공됩니다.
트레이딩 기회를 놓치고 있어요:
- 무료 트레이딩 앱
- 복사용 8,000 이상의 시그널
- 금융 시장 개척을 위한 경제 뉴스
등록
로그인
계정이 없으시면, 가입하십시오
MQL5.com 웹사이트에 로그인을 하기 위해 쿠키를 허용하십시오.
브라우저에서 필요한 설정을 활성화하시지 않으면, 로그인할 수 없습니다.