Kostenpflichtige technische Indikatoren für den MetaTrader 4 - 98

Entfesseln Sie die Kraft des Gewinns im Bereich binärer Optionen mit dem "Eagle Eye Indicator" für MT4 Machen Sie sich bereit für eine revolutionäre Reise in die Welt der binären Optionen mit dem beeindruckenden "Eagle Eye Indicator" für MetaTrader 4 (MT4). Dieses revolutionäre Werkzeug steht bereit, um Ihr Trading-Erlebnis zu verändern und mit chirurgischer Präzision und beispiellosen Gewinnmöglichkeiten zu bereichern. Tauchen Sie ein in eine Welt, in der die Grenzen des Potenzials überwunden u

Dabei handelt es sich um ein Mehrzwecksystem, das sowohl für manuelle Forex-Händler geeignet ist, entweder als Scalper-System oder als Strategie für den Einstieg in ein sehr starkes Momentum, für Händler von binären Optionen oder für die Verwendung durch universelle Automate imisisierungshandel.
Jeslyn ist eine Strategie, die auf jahrelanger Forschung basiert und sich auf eine bestimmte Preisaktionsstrategie konzentriert. Es mag wie ein einfacher Pfeilindikator aussehen, verfügt aber über
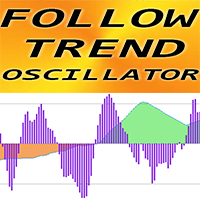
"Follow Trend Oscillator" - is advanced custom indicator, efficient trading tool! User friendly indicator provides opportunities for scalping into the direction of major trend Smooth and adjustable oscillator with signal histo part Green color of oscillator for upward trends, Brown color - for downward trends Oversold values: below -30 ; O verbought values: over 30 There are plenty of opportunities to upgrade even standard strategies with this indicator // More great Expert Advisors and In

This is the Simple Indicator based on Trend and Break of Structure, so that i have combined the Moving Average and the Stochastic combination's for the Better results it will signal based on the Trend (MA) for the sharp entries.
Advantages of the System.
Purely Trend Based Strategy. BOS(Break of Structure on the trend Side Confirm's the Signal). Minimum 1:2 Ratio can be easily Achievable.

Renko Bollinger Bands are Bollinger bands based on Renko boxes. You can see the free enhanced Renko indicator here . This indicator can be useful to get a better aspect of the price and deviation since it is based on Renko bars. Also the Main line of Bollinger Band is the SMA of Renko bars based on the Period in the inputs.
Inputs:
Box Size: Renko box size based on market Points.
Period: Bollinger Bands Period
Deviation: Bollinger Bands Deviation.

Indikator des Preiskanals und des darin enthaltenen Breakpoint-Generators. Es gibt einen Eindruck von der Lage des Preises im Verhältnis zur Nutzungsdauer.
Es enthält geglättete Trend-Absprunglinien entlang der Kanalgrenzen und Absprungpunkte, die den Ein- und Ausstiegszeitpunkt bestimmen.
Funktioniert mit verschiedenen Handelsinstrumenten und Zeitrahmen.
So arbeiten Sie mit dem Indikator
Folgen Sie der Kanalunterbrechungslinie. Die blaue Linie zeigt die oberen Eingänge, die rosa Linie di

MACD - the Moving Averages Convergence/Divergence indicator displays information simultaneously from different periods in one subwindow of the chart.
Parameters Fast EMA — period for Fast average calculation. Slow EMA — period for Slow average calculation. MACD SMA — period for their difference averaging. Type of price — price used. Timeframes for MACD — list of periods, separated by a space or comma or semicolon. Number of bars for each period — the number of bars displayed for each period. S

Das vorgefertigte Handelssystem „Mr. Scalp“ zeigt dem Händler vorgefertigte Signale, wenn es notwendig ist, Transaktionen zum Verkauf oder Kauf zu eröffnen. Das System zeigt an, wann Sie eine Bestellung eröffnen müssen und in welche Richtung. Funktioniert für alle Währungspaare und alle Zeitrahmen. Visuell zeigt dieser Indikator mit roten und blauen Punkten auf dem Diagramm die Momente an, in denen der Markt wahrscheinlich umkehren und sich in die entgegengesetzte Richtung bewegen wird. Das Sys
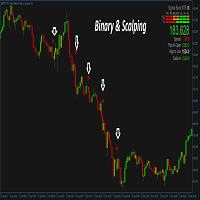
This is a trend following system for Binary options traders and forex scalpers. It is carefully crafted and recognizes periods of WATERFALL in the market and gives the trader the advantage and opportunity of riding with the momentum. It works on all timeframes and currency pairs especially high liquidity pairs. Avoid news events 15mins before and after. Always have your money management script or system in place. Tested on Deriv synthetics as well, please check screenshots. MT5 version can be go

Do you know the spreads on which your trades are / will be opened. How well do you know about the spreads on which your trades are / will be opened.
The main task of the indicator. Help the user / trader to study the spreads in the trading terminal.
Get information about the minimum and maximum spread on each candle, from M1 and above. This information will help in the following cases: - Maximum trading spread EA --- If your broker has smaller spreads or average statistically higher and
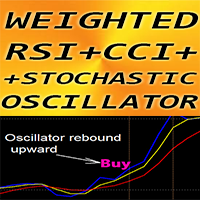
Forex Indicator "Weighted Rsi Cci Stoch Oscillator" for MT4 , No Repaint This unique indicator combines 3 in 1: RSI, CCI and Stochastic for calculation! Precise momentum trading opportunities with this software - see examples on pictures Indicator consist of 3 lines : Weighted Rsi Cci Stoch Oscillator itself ( Blue color ); Fast MA of oscillator ( Yellow color ); Slow MA of oscillator ( Red color ); Zone above 50 - overbought zone (Do not BUY there). Zone below -50 - oversold zone (Do

This indicator will help you identify the key zones needed for The Silver Bullet Strategy which are: The three time-windows the ICT mentioned in the strategy Window 1: 3 AM and 4 AM New York time Window 2: 10 AM and 11 AM New York Time Window 3: 2 PM to 3 PM New York Time Bullish and bearish supply and demand zones which will help you identify FVG inside those time windows T he previous day's high and low, draw on liquidity The indicator does not plot the FVGs to avoid cluttering the chart Exi

Smart Currency Strength is a powerful yet simple indicator that measures the strength of individual currencies.
It features a graphic panel that lists the main currencies and their strength in each timeframe, ranging from 0 (most oversold) to 100 (most overbought). The strength for all currencies in the current timeframe is also shown in a separate window as a multi-line graph, where each currency is represented with a different color, this allows you to monitor the evolution of strength t

With the help of the Fine Market Forex indicator algorithm, you can quickly understand what kind of trend is currently developing in the market. Fine Market is a combined indicator based on several instruments. Fine Market is based on classic basic technical indicators - MA, RSI, MACD, Bollinger Bands, Stochastic. A trader does not need to impose several lines on Forex charts and set up each indicator separately. Fine Market is already successfully combined and has simplified settings, convenie
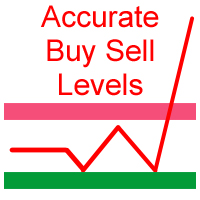
Accurate Buy sell Levels are the fully automated and purely work's on the basis of the Daily Opening weekly Opening and the Monthly Opening Prices. we don't want to do any analysis and other planning for Intraday or Swing we need to focus only when price approaches near the levels we can add other price action confluence's (Inside Bar's , Bullish / Bearish Engulfing pattern's , SND , Order Blocks ... and so on ) for strong Buy or Sell Confirmation's. Very simple and Easy to Follow system. We c

This indicator gives you the Moving Average based on Renko chart. A Renko chart is a type of chart that is built using price movement rather than both price and standardized time intervals like most charts are. A Moving Average based on Renko chart is considered less noisy since it is not based on the time and only based on price change. You can see my free enhanced Renko indicator here .
Inputs: Box Size: Renko box size based on market Points.
Period: Moving Average Period
Method: Mov

This indicator is great for trading on the pair and many more. The indicator itself uses augmented accuracy mathematical strategies, but so far they are optimized for some currency pairs. Many settings can be configured on the working panel. There are two panels on the chart, for visualization and settings. He displays his solution on the graph in the form of icons. There are only two types of icons. In the tester, it works fine by default in the settings. The second panel for counting the res

The indicator allows for quick identification of price reversals by promptly reacting to price impulses and indicating the beginning of a price reversal. The histogram demonstrates the direction of movement and identifies favorable moments for opening positions. It is recommended for use in swing trading and can be applied to any currency pairs, metals, and cryptocurrencies. It is also suitable for binary options trading. Key Features Rapidly identifies changes in the local trend Works on all t

Fast Scalping is a new product that allows you to identify the current market phase (uptrend, downtrend or flat). Represents a typical investor strategy that usually indicates a trend change from bearish to bullish. A tool that allows you to determine the direction and strength of a trend. Unlike most indicators, Fast Scalping finds longer trends and gives fewer false signals.
This indicator displays arrows of different colors depending on the current state of the market and thus signals the

Title: Best Reversal Indicator - A Custom MQL4 Indicator for Trend Reversals Description: The "Best Reversal Indicator" is a custom MetaQuotes Language 4 (MQL4) indicator designed to identify potential trend reversals in financial markets. This indicator is intended to be used on MetaTrader 4 (MT4) trading platforms. Key Features: Non Repaint: Best Reversal Indicator is a non repaint indicator means It does not remove its signal after moving forward. Trend Reversal Detection: The indicator scan

The Game-Changing Engulfing Candle Hunter - Your Guide to Profitable Trend Trading
Step into the realm of trading possibilities with our revolutionary product - The Engulfing Hunter. Designed by traders for traders, this dynamic indicator combines the potency of engulfing candlestick patterns and the versatility of proprietary trend detection system, offering a trading edge unlike any other. Engulfing candlestick patterns have always been a revered tool in the arsenal of seasoned traders. Actin
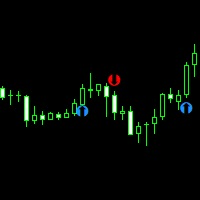
**Features:**
1. **Innovative Trend Tracking:** The UT BOT Simple Indicator leverages the power of the Average True Range (ATR), a renowned volatility measure, to calculate precise trailing stop values, providing unparalleled insights into market trends.
2. **Customizable Settings:** Flexibility is paramount in any trading strategy. With this in mind, our indicator allows you to adjust the ATR periods and other key parameters to tailor the tool to your trading style and strategy.
3. **Rea

The "Never Be Wrong" indicator beware of opening in the wrong direction. The indicator uses the histogram of the MACD to determine a momentum in the direction of the trend. The indicator compares its results with a higher time ratio and gives confirmation of a trend direction. very easy to use but reliable and clear confirmation of your trades. Green Bar = only long trades allowed Red bar = only short trades allowed Blue bar = long and shoert trade allowed Black bar = no trade allowed
how to u
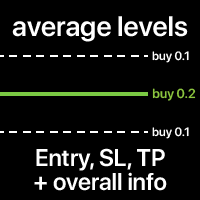
The average Entry, SL and TP levels of all trades on the Symbol. The levels can be calculated together, or separately for Buy and Sell trades. You can optionally display additional info: Level price, total Lot size, floating P/L. The styles and colors of the levels are customizable. My #1 Utility : includes 65+ functions | Contact me if you have any questions | MT5 version In the settings of the indicator, you can configure: Average Entry level: on/off; Average SL level: on/off; Aver

The Strong Volume Trend MT4 indicator is a powerful tool designed to help traders identify and capitalize on significant volume trends in the financial markets. With its advanced algorithm, this indicator accurately detects the strength and direction of volume movements, allowing traders to make informed trading decisions. Features: Volume Strength Analysis: The indicator analyzes the volume data and identifies strong volume trends, helping traders spot potential market reversals, breakouts, or

Introducing the "Amusing Entry Arrows" signal indicator, a powerful tool designed to enhance your trading experience on the H1 chart. With its advanced features and customizable arrow settings, this indicator provides valuable insights and timely alerts to help you make informed trading decisions. Key Features: H1 Chart Compatibility: The "Amusing Entry Arrows" indicator is specifically designed to operate on the H1 timeframe, allowing you to analyze price movements effectively within this timef
Trusty Super Signal Indicator
The Trusty Super Signal Indicator is a powerful technical analysis tool designed to assist traders in making informed trading decisions in the financial markets. With its advanced algorithm and user-friendly interface, this indicator provides accurate and timely signals to help identify potential trading opportunities.
Features: 1. Reliable Signal Generation: The Trusty Super Signal Indicator uses a sophisticated algorithm to generate high-quality trading sign

Meet the Tweezer Hunter, an essential tool for every Forex trader looking to make accurate, trend-following trades. This powerful, intuitive indicator helps traders spot potential trend reversals before they happen, providing a significant advantage in the fast-paced world of Forex trading. The Tweezer Hunter is more than your average tweezer candle indicator; it's designed with a built-in trend identification feature that accurately detects whether the market is bearish or bullish. By integrat

Candle confirmer is the indicator you need when you're waiting for the last candle to confirm to make an excellent order, this indicator will alert you if the current candle has had a higher or lower price compared to the previous candle. Stop trying to guess and start focusing on what really matters. You can activate or deactivate the alerts, chose the time-frame and even change the size, color and position of the indicator. Don't forget to leave your review and comments, it helps us improve

It is no secret that the movements of currency pairs for a certain part of the time occur in a certain price corridor, which is called a channel. The lower limit is considered the level of support, the upper one - resistance. Do not confuse with horizontal support and resistance levels! The distance between the support and resistance levels of a channel is called the range or channel width. The key difference between the Channel Mirosh indicator and other channel indicators (for example, from th
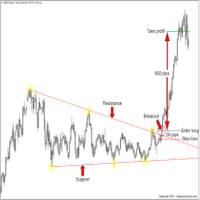
October OFFER: Free Ea with it This is valid till 30th of October. After purchase of indicator connect me on telegram @anabullbear or inbox in mql5 to get free Ea It's a Breakout Scalper On support and resistance and order blocks. Benefits of the indicator: does not redraw arrows. works on all currency pairs. high signal accuracy good for scalping Accuracy level is more than 95 percent. Best TF m15 for gold and major FX pairs Indicator settings: Default for M15,M30, H1 Best Pair -Gold and majo
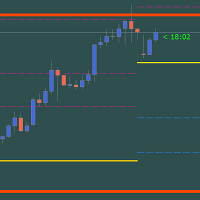
Gold PL MTF - this is a fine stock technical indicator. The indicator algorithm analyzes the movement of the asset price and automatically reflects the important Pivot Levels of the specified timeframe (TF) using the Fibonacci method (golden section).
The indicator perfectly describes the price trajectory of the selected timeframe (day, week, month, year), determines the beginning of a trend and the beginning of a correction, which may develop into an opposite trend. The indicator also shows t
This indicator uses candlesticks with large real bodies to predict possible market structure shift. Displacement is a very powerful move in price action resulting in strong selling or buying pressure. Generally speaking, displacement will appear as a single or a group of candles that are all positioned in the same direction. These candles typically have large real bodies and very short wicks, suggesting very little disagreement between buyers and sellers. Often, a displacement will occur just af

Introducing the Great Oscillator Trend Indicator – a powerful tool designed to enhance your trading strategies and improve your decision-making process.
The Great Oscillator Trend Indicator is a versatile technical analysis tool that helps you identify trends and potential reversals in the financial markets. It utilizes a combination of oscillators and moving averages to generate accurate and reliable signals.
With this indicator, you can easily spot overbought and oversold conditions, as

Highlight special areas based on time
you can highlight London and New York OR other Times and analysis the chart faster
it's so useful for backtesting
it's really hard to highlight several days in a special time but this indicator will help you quickly to Highlight them
I'm a trader so I know what you need
if you need more info comment or message me if you wanna see the video you should send me message i will answer faster in Telegram: https://t.me/forex_ex4
Telegram ID: @forex_ex4
st

The Zigzag Value Indicator is a powerful technical analysis tool designed to assist traders and investors in identifying significant price movements and trends in financial markets. With its advanced algorithm, this indicator helps users determine key turning points and potential reversals, providing valuable insights for making informed trading decisions. To View Our Other Products Go to the link: Other Products
Features:
1. Zigzag Pattern Detection: The Zigzag Value Indicator detects an

1 of 10 for 69$
.
Next Price is 89$
SMC Unmitigated Finding is a indicator for find unmitigated supply and demand in previous legs of price
Settings Zigzag Settings ZZDepth - by Default is 12.
ZZDeviation - by Default is 5.
ZZBackStep - by Default is 3. Rectangle Settings SupportColor- color for Support line.
ResistanceColor - color for Resistance line.
Settings Num of Show - Number of Support & Resistance Show.

The DVV indicator is a multifaceted informative indicator for the Forex market or the Cryptocurrency market . The indicator gives clear and reliable signals without redrawin g. The indicator can be used in bots by taking readings from its zero buffer.
Please note that for different currency pairs, the settings must be selected separately, this is not difficult.
Changing the input parameters greatly affects the display. I will show four options for using the indicator. The indicator

Gioteen Volatility Index (GVI) - your ultimate solution to overcoming market unpredictability and maximizing trading opportunities. This revolutionary indicator helps you in lowering your losing trades due to choppy market movements. The GVI is designed to measure market volatility, providing you with valuable insights to identify the most favorable trading prospects. Its intuitive interface consists of a dynamic red line representing the volatility index, accompanied by blue line that indicat
Entriegeln Sie die Kraft der Markttrends wie nie zuvor mit dem 3-HMA-Multi-Timeframe-Trend-Indikator. Dieses zuverlässige Tool ist Ihr vertrauenswürdiger Partner in der komplexen Welt des Forex-Handels. Es wurde mit Anpassungsfähigkeit und Genauigkeit im Fokus entwickelt und eignet sich ideal für Händler, die die Bedeutung des Trendfolgens verstehen und die einzigartige Reaktionsfähigkeit des Hull Moving Average (HMA) nutzen möchten.
Der Hull Moving Average unterscheidet sich von herkömmliche
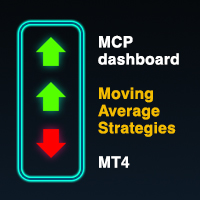
Multicurrency indicator in table format. Signals appear with confirmation, no repaints. Works on the current (open) timeframe. Notifications come for an open instrument. In the indicator settings, you can choose 1 of 4 Moving Average strategies. Strategies (represented in screenshots): Classic fast and slow moving average crossover Reverse signal of classic crossing (used for flat/sideways movement) Classic crossover relative to a slower moving average (Trend MA in settings) Price touching the f
Multicurrency indicator in table format. Signals appear with confirmation, no repaints. In the settings, you can select the number of candles/bars on which the signal will still be displayed so that the trader takes it into account and does not miss it. The indicator works on the current (open) timeframe. Notifications come for an open instrument. In the indicator settings, you can choose 1 of 4 Stochastic strategies Strategies (represented in screenshots): The main line crosses the signal line

Introducing Real Cross System , the cutting-edge trading signal indicator designed to revolutionize your trading experience. Whether you are a seasoned trader or a newcomer to the financial markets, this powerful tool is engineered to provide accurate and timely signals, empowering you to make informed trading decisions with confidence. Features: Real-Time Signal Generation: Real Cross System utilizes advanced algorithms to generate real-time trading signals based on precise market analysis.

Der Smart Strategy Indicator ist ein Handelssystem, mit dem Sie den Markt im Hinblick auf verschiedene Aspekte der technischen Analyse analysieren können. Der erste davon ist ein Preiskanal, der automatisch aufgebaut wird und es dem Händler ermöglicht, die Hauptrichtung der Preisbewegung zu erkennen. Es ermöglicht auch die Analyse des Marktes mithilfe einer Kanalstrategie (Ausbruch und Erholung von Kanallinien).
Block 2 ist das SAR-System, das allgemeine Informationen über die Mikrobewegungen
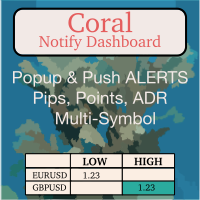
Coral Notify Dash allows you to manage all of your chart price-based notifications from a single consolidated dashboard. It fills a gap left by MT4, which does not support popup alerts. If you're like me and you often don't hear the alert sound for the built-in alerts, this is an indispensable tool. I use Coral Notify Dash as part of my daily chart analysis workflow. I use a tool like Coral Dash (available for free, here ) or one of the other dashboards to set my trading bias. As I review t

The Exact Arrow Entry Signal Indicator is a powerful tool designed to assist traders in making informed decisions in the financial markets. This advanced indicator leverages cutting-edge algorithms and technical analysis to identify potential entry points with high accuracy.
Features: 1. Precision Entry Points: The indicator generates precise arrow signals on the chart, highlighting potential entry points for various trading strategies.
2. Trend Identification: By analyzing price movements

Arbitrage MACD: Your Key to Analyzing Market Trends
The Arbitrage MACD is a cutting-edge indicator designed to assist traders and investors in analyzing market trends with greater precision and confidence. MACD, which stands for Moving Average Convergence Divergence, is a well-known and widely used tool in the financial world, and the "Arbitrage MACD" takes its functionality to the next level.
This innovative indicator offers a comprehensive analysis of the relationship between two moving a

The " Arbitrage RSI " is a cutting-edge technical indicator designed to assist traders in making informed decisions in the financial markets. This powerful tool leverages the concept of Relative Strength Index (RSI) divergence to identify potential trading opportunities. To View Our Other Products Go to the link: Other Products
Features: RSI Divergence Detection: The Arbitrage RSI excels at identifying divergence patterns in the RSI indicator. By comparing the price action with the RSI mov
The Finding Average Volume indicator for MetaTrader 4 is a technical analysis tool that calculates the average volume of swing bars. Swing bars are a type of price chart pattern that identifies potential turning points in the market. The indicator is displayed as a zigzag trend line that is bounded by two vertical lines. The average volume is calculated for the entire swing bar pattern. Benefits of Using the Finding Average Volume Indicator Identify potential trend changes: The Finding Average

ATR Channels Indicator Introducing the ATR Channels Indicator, a powerful tool designed to enhance your trading experience and provide valuable insights into market volatility. ATR, short for Average True Range, is a technical indicator that helps traders understand the overall price volatility of an asset or market. The ATR Channels Indicator takes the ATR calculations to the next level by plotting them as dynamic channels on your price chart. These channels represent the range within which pri

The FollowLine indicator is a trend following indicator. The blue/red lines are activated when the price closes above the upper Bollinger band or below the lower one.
Once the trigger of the trend direction is made, the FollowLine will be placed at High or Low (depending of the trend).
An ATR filter can be selected to place the line at a more distance level than the normal mode settled at candles Highs/Lows.
Some features: + Trend detech + Reversal signal + Alert teminar / mobile app

Title: Best Trend Sniper Indicator - A Custom MQL4 Indicator for Spotting Potential Trends Description: Indicator Name: Best Trend Sniper Indicator Introduction: The "Best Trend Sniper Indicator" is a custom Meta Quotes Language 4 (MQL4) indicator designed to identify potential trends in financial markets. This indicator is intended to be used on Meta Trader 4 (MT4) trading platforms. Key Features: Non Repaint: The Best Trend Sniper Indicator is a non-repaint indicator, which means it does not
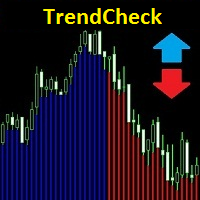
Dieser Indikator zeichnet unter jeder Kerze eine horizontale blaue oder rote Linie, die die Richtung des Trends anzeigt. Die blaue Linie bedeutet einen Aufwärtstrend, die rote Linie einen Abwärtstrend.
Der Indikator verfügt über eine neue Logik, die ihn deutlich von vielen Analoga unterscheidet. Es gibt frühe Ein- und Ausstiegssignale, zeichnet seine Werte nicht neu – das heißt, wenn der Indikator ein Signal zum Einstieg in einen Handel gegeben hat, dann wird dieses Signal nicht verschwinden
RSI Divegence Win Pro
The RSI Drivergent is the best indicator for looking for price reversals.
RSI Drivergent Win Pro has used the strengths and best points of RSI to create in a format for traders to understand more easily.
Suitable for beginners and professional traders.
Case Up Trend : Blue line is below Yellow line. Case Down Trend : Blue line is abve Yellow line.
Usage is very easy. 1. Import the indicator into the MT4 chart. 2. Defind Overbought positions and defind oversold

MT5 Version
Understanding market sentiment is a critical aspect of successful trading. Market sentiment refers to the overall feeling or attitude of traders and investors towards a particular financial instrument, such as a stock, currency pair, or cryptocurrency. It is a collective perception of market participants' emotions and beliefs about the asset's future price direction. Market sentiment can be bullish (positive), bearish (negative), or neutral (sideways). Knowing the market sentiment
SWING X Black ist ein revolutionärer MetaTrader 4 (MT4) Indikator, der sorgfältig für den manuellen und automatischen Handel in den Bereichen Binäre Optionen und Forex entwickelt wurde. Seine unübertroffene Genauigkeit in Kombination mit seiner Anpassungsfähigkeit an verschiedene Zeitrahmen macht ihn zu einem leistungsstarken Werkzeug für Händler, die ihre Gewinne maximieren möchten. SWING X Black ist für den 15-Minuten-Zeitrahmen optimiert, ideal für schnelle Entscheidungsfindung und zügige Han
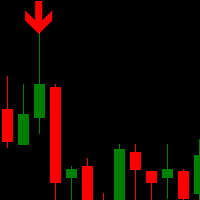
Trend Scalper Arrows is a unique trend reversal 100% non-repainting multi-algo indicator that can be used on all symbols/instruments: forex, commodities, cryptocurrencies, indices, stocks . Trend Scalper Arrows will determine the current trend at its early stages, gathering information and data from up to 10 standard algos When indicator give a valid buy or sell signal, a corresponding arrow will be printed on the chart, open trade at start of the next candle/bar indicating a
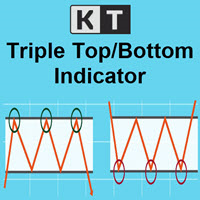
KT Triple Top-Bottom identifies the triple top/bottom pattern with a breakout signal in the opposite direction. It is used to identify potential trend reversals.
A Triple Top pattern is formed when the price reaches a high point three times, while a Triple Bottom pattern occurs when the price comes to a low point three times.
Features The indicator detects the triple top/bottom pattern with high precision and accuracy. The indicator suggests a shift in momentum, with sellers or buyers takin
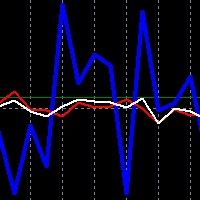
For the new traders of this strategy please remember the convention:
FORWARD trade = BUY AUDUSD and SELL NZDUSD at equal lot size
REVERSE trade = SELL AUDUSD and BUY NZDUSD at equal lot size
Risk is mittigated by the opposing nature of the trades, one tends to offset the other almost 70% of the time, and for when this is not the case we rely on the indicators accordingly - no stops are used in correlation hedge!
This is an enhanced oscillator like analysis of the relationship betw

KT DMA is a modified and advanced version of the classic Displaced Moving Averages with buy/sell crossover alerts and a Multi-Timeframe scanner that shows DMA's direction across each real-time time frame. A Displaced Moving Average is a simple moving average that moves ahead or backward in a time frame (either short-term or long-term). It also allows you to predict price movement more accurately.
Features Depicts the trend direction using the alignment of three moving averages. Buy/Sell signa
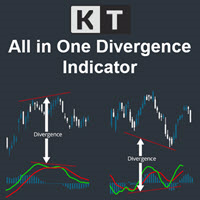
The KT All-In-One Divergence is designed to identify regular and hidden divergences between the price and 11 widely recognized oscillators. This powerful tool is indispensable for swiftly and accurately spotting market reversals. Its a must-have tool in any trader's arsenal, providing clear and accurate divergence patterns. Its accuracy and speed in identifying market reversals are remarkable, allowing traders to seize profitable opportunities confidently.
Features No Interference: You can a

indicator CE and RF Buy-Sell Chandelier Exit and Range Filter Buy Sell
It is the ultimate indicator for telling entry points or entering trades with high accuracy.
Trades must be short term trading only or Scalping only, not suitable for holding positions across several days.
Suitable for beginner traders and professional traders.
Easy Operation 1. Import Indicator, CE and RF into MT4 chart. 2. Waiting for the signal from the arrow pointing up means recommending a long position. and an
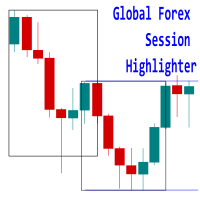
Introducing the 'Global Forex Session Highlighter' , a powerful tool designed to enhance your trading strategy by providing a visual representation of the Three major Forex trading sessions: Tokyo, London, and New York. This indicator is designed to help traders understand the dynamics of the global Forex market by highlighting the trading sessions directly on your MT4 chart. It provides a clear view of when each session starts and ends, allowing you to strategize your trades around the most
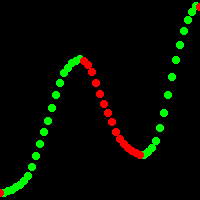
"Xhmaster formula forex indicator" - Ein neuer Oszillator-Indikator mit regressiver mathematischer Modellierung von freien numerischen Reihen. Dieser Indikator ermittelt Preisumkehrpunkte um 60 % genauer als der Standard-Indikator "Xmaster formula" und reagiert zudem weniger empfindlich auf kleine Preisfluktuationen. "Xhmaster formula forex indicator" ist ein einzigartiges und fortschrittliches Werkzeug, das speziell für Trader im Forex-Markt entwickelt wurde. Es bietet Tradern ausgezeichnete Mö

here is a link to back test results
https://youtu.be/9BYDwS9aaqM
https://youtu.be/iLxh43HV91Y
However, the difficult task here for traders is to understand and select the indicator or tool that can help them with their trading plan and benefit their trading style. Traders want a tool that requires minimal effort and provides as much support as it can.
There are multiple reasons for which traders need an indicator. One such reason is to determine the buy-sell signals in the market. The
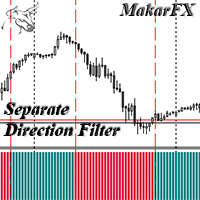
The indicator shows the Buy/Sell direction. The calculations use the opening prices and their rate of change for the billing period - "Calculation period" MTF indicator - "Calculation timeframe", no repaint - NRP. Two display types: "Simple histogram" or "Histogram level crossing" Alerts available: "Chart message", "Push message", "Email message" Two types of signals: "Change direction" or "Crossing level" Level settings: "Crossing UP level" and "Crossing DN level" Color settings. For EA: iCusto

Wir stellen unseren revolutionären Indikator vor: „TrendStoch Channel Pro“! Dieses leistungsstarke Tool ermöglicht es Händlern, sich einen umfassenden Überblick über den Markt zu verschaffen, indem es zwei wesentliche Funktionen – die Beobachtung größerer Zeittrends und des stochastischen Kanals – direkt auf Ihrem Chart nahtlos kombiniert.
Mit „TrendStoch Channel Pro“ erleben Sie ein neues Maß an Handelspräzision. Die Fähigkeit des Indikators, größere Zeittrends anzuzeigen, ermöglicht es

In Forex trading, understanding support and resistance is crucial. Virtually every trading strategy incorporates these levels.
MetaTrader lacks built-in support and resistance calculation features, but there's a solution— the Support and Resistance Lines indicator.
This powerful MetaTrader indicator automatically calculates and displays support and resistance levels for any chosen currency pair or trading instrument.
Benefits of the Support and Resistance Lines indicator:
1. Identify be
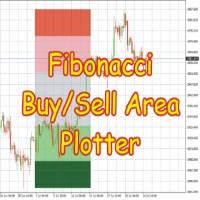
This Indicator is based on Fibonacci levels and draws Buy & Sell Areas. Buy areas are defined in green color (light green & dark green) while Sell areas are defined in red color (light red pink and darker color) Rectangles to easily know that whether price is in buy area or sell area. If price is in gray area, wait for price to come in to your desired area. You can use on any Forex Pairs.
This indicator calculates on the basis of h4 timeframe no matter what time frame you have selected, its cal
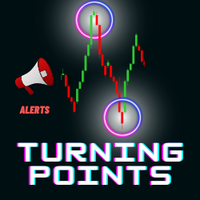
Analysieren Sie mit diesem Tool schnell die Marktstruktur und profitieren Sie von wichtigen Preisniveaus.
Marktstruktur Dieser benutzerdefinierte Indikator stellt die wichtigen Kursniveaus dar, die als Einstiegspunkte oder Gewinnziele genutzt werden können.
Identifizieren Sie Ihre Handelsspanne Scalping mit diesem Indikator unter Berücksichtigung der Umkehrpunkte des Marktes.
Ausbruchshandelschancen Verwenden Sie diesen Indikator, um Ausbruchsgelegenheiten zu erkennen. Diese Handels
MetaTrader Market bietet jedem Entwickler eine einfache und bequeme Plattform für den Verkauf von Programmen.
Wir unterstützen Sie bei der Veröffentlichung des Produkts und beraten Sie gerne, wie man eine Beschreibung für den Market vorbereitet. Alle Produkte, die im Market verkauft werden, sind durch eine zusätzliche Verschlüsselung geschützt und können nur auf dem Rechner des Kunden gestartet werden. Illegales Kopieren ist ausgeschlossen.
Sie verpassen Handelsmöglichkeiten:
- Freie Handelsapplikationen
- Über 8.000 Signale zum Kopieren
- Wirtschaftsnachrichten für die Lage an den Finanzmärkte
Registrierung
Einloggen
Wenn Sie kein Benutzerkonto haben, registrieren Sie sich
Erlauben Sie die Verwendung von Cookies, um sich auf der Website MQL5.com anzumelden.
Bitte aktivieren Sie die notwendige Einstellung in Ihrem Browser, da Sie sich sonst nicht einloggen können.