适用于MetaTrader 5的付费技术指标 - 5

The Volume+ and VSA Signals indicator for MT5 is based on the Volume Spread Analysis (VSA) methodology to provide the signals. The signals are displayed at closing of bars on the main window or subwindow in the form of symbols. The symbols are not repainting. The indicator produces a signal on an individual bar and this signal is not buy or sell signal. When a minor trend goes in the opposite direction of a major trend, there are sequences of major trend-following signals that give a higher pro

SyntheticaFX Boom & Crash Multi 指标适用于 MetaTrader 5,是一款先进的交易工具,旨在通过检测潜在的峰值和分析各时间框架的市场趋势来提升您的交易策略。该指标专为 Crash 和 Boom 指数量身定制,提供及时警报和重要的趋势信息,帮助您做出明智的交易决策。 主要特点: 峰值检测: 检测以下指数和时间框架的潜在峰值: Crash 1000、900、600、500、300:3分钟和5-10分钟时间框架 Boom 1000、900、600、500、300:3分钟和5-10分钟时间框架 趋势分析: 显示市场是处于上升趋势还是下降趋势,帮助做出战略性入场和离场决策。 交易入场建议: 建议仅在下降趋势时进行 Crash 入场,仅在上升趋势时进行 Boom 入场。 推荐止损设置: 高风险和中风险入场:5-15(3分钟蜡烛) 入场1和2:5-6(5分钟蜡烛) 利润管理: 当交易进入利润区时,如果峰值触发,可考虑在关闭之前持有几根蜡烛。 如果没有其他峰值出现,确保在盈利时平仓。 使用指南: 结合您的分析以及支撑和阻力使用。 Crash 指数: 监控3分钟和5-

Renko is a well-known Japanese charting technique that removes time from the chart. Instead of drawing bars in constant intervals (time) as a normal chart would, a Renko chart does so only when price moves beyond a predefined amount.
In a Renko chart, a bar is created when price exceeds the previous bar’s high or low by a predefined amount or what we call the Box Size. The result is a chart with equally sized bars running up or down in 45 degree angles. Such a chart offers the following advanta

Purpose and functions of the indicator The indicator determines and marks the moments of trend change on the chart based on the theory of fractal levels breakout on any of the analyzed timeframes. If a breakout based on all rules is valid, a horizontal line with corresponding color will appear on the chart. If there is an uptrend, the line will be blue. In the descending trend, the line will be red. The blue line is a strong support level, the trader should look for buying opportunities above th

This indicator is converted from UT Bot alerts indicator by @QuantNomad of Trading View to MT5. its considering ATR and creating new candles on chart and also is giving good entry points based on its candles. all buffers of new candles and also entry signals are included as buffer so can be used easily on any EA. there are also some different strategies on the internet that can be used or contact me to create it for you.

The on-balance volume indicator (OBV) is a momentum indicator and was developed in 1963 by Joseph E. Granville. The OBV shows the importance of a volume and its relationship with the price. It compares the positive and negative volume flows against its price over a time period. To provide further confirmation that a trend may be weakening, Granville recommended using a 20-period moving average in conjunction with the OBV. As a result, OBV users could then observe such events more easily by notin
Tired of drawing opening range breakout line? Maximize your trading potential with the Range Breakout Indicator and the Opening Range Breakout (ORB) Indicator for MT5, two essential tools designed to enhance your trading strategy and boost your market performance. These powerful indicators allow you to profit from the explosive price movements that often occur at the opening of major stock indices, such as the DAX, DOW, NASDAQ, and S&P500. By leveraging the Opening Range Breakout Indicator, you

This indicator identifies and displays zones, as it were areas of strength, where the price will unfold. The indicator can work on any chart, any instrument, at any timeframe. The indicator has two modes. The indicator is equipped with a control panel with buttons for convenience and split into two modes. Manual mode: To work with manual mode, you need to press the NEW button, a segment will appear. This segment is stretched over the movement and the LVL button is pressed. The level is displayed

What is the Volume Weighted Average Price (VWAP)? The volume weighted average price (VWAP) is a trading benchmark used by traders that gives the average price an instrument has traded at throughout the day, based on both volume and price. It is important because it provides traders with insight into both the trend and value of the instrument.
What is the Difference between VWAP and AVWAP? While VWAP is having as starting point the beggining of the day,week,month etc. in the AVWAP you can pla

揭开市场真正隐藏的模式,使用 PREDATOR AURORA 交易系统——混合交易指标的终极王者。看清别人看不到的机会! PREDATOR AURORA 交易系统是一款为拒绝平庸、追求卓越的交易者设计的强大工具。这不仅仅是另一个普通的指标;它是你的秘密武器,是你的不公平优势。它是一种复杂的混合狩猎系统,能够以致命的精确度追踪市场动向,在这个只有强者才能生存的丛林中脱颖而出。受自然界中最强大捕食者的启发,PREDATOR AURORA采用先进的自适应算法,能够无缝适应不断变化的市场条件。就像潜伏在阴影中的捕食者,它能穿透市场噪音,揭示其他人可能永远无法发现的高概率交易机会。 主要特点: 自适应狩猎机制: 能够即时调整以适应市场波动,让你在任何交易环境中都能高效掌控局势。 多时间框架分析: 覆盖6个时间框架(M1到D1),让你从更广阔的视角洞察市场,超越普通分析的局限。 动态状态识别: 通过直观的颜色编码信号实时识别市场状态,为你的每一步操作提供指导。 性能跟踪与结果模拟: 内置信号跟踪算法,帮助你衡量和预测设置的成功率,将每次交易转化为精心计算的胜利。 基于波动性的预设: 提

** All Symbols x All Time frames scan just by pressing scanner button ** *** Contact me to send you instruction and add you in "Swing scanner group" for sharing or seeing experiences with other users. Swing EA: https://www.mql5.com/en/market/product/124747 Introduction: Swing Scanner is the indicator designed to detect swings in the direction of the trend and possible reversal swings. The indicator studies several price and time vectors to track the aggregate trend direction and dete

This indicator can be used to display Support and Resistance levels according to the Malaysian SNR concept , in which Support and Resistance are exact levels of a line chart. Malaysian SNR
There are 3 different horizontal levels in Malaysian SNR: A-Level : This level is located at the peak of this line chart. (shape looks like the letter A) V-Level : Level at the valley of a line chart, (shape looks like the letter V) Gap-Leve l: This level is located at the Close/Open gap between two candle

这 ICT 亚洲范围指标 是一款功能强大的工具,旨在帮助交易者根据 ICT 亚洲区间交易策略识别关键市场结构和流动性区域。它标记了亚洲交易时段(纽约时间晚上 7 点至午夜)的最高价和最低价,并为接下来的交易时段的市场走势提供了重要见解。该指标通过突出显示流动性扫荡和公允价值缺口 (FVG) 来提高交易准确性,使其成为 ICT 交易者必不可少的工具。
为什么亚洲范围如此重要? 亚洲交易时段为后续交易时段的价格走势奠定了基础。了解这一范围可让交易者预测市场情绪、找到流动性区域并制定战略性交易入场和出场。
ICT 亚洲指数的主要优势及使用方法 ICT 亚洲区间指标为交易者提供早期市场洞察,帮助他们在伦敦和纽约交易时段开始前预测每日趋势和情绪。通过识别流动性定位,该指标突出了机构交易者可能进入或退出头寸的区域,从而更深入地了解市场行为。该指标还有助于预测波动性和潜在突破点,让交易者为即将到来的交易时段的价格变动做好准备。此外,它还是一种有价值的风险管理工具,为止损和止盈设置提供了明确的参考点,从而降低了整体交易风险。
要有效使用 ICT 亚洲区间指标,交易者首先应确定亚
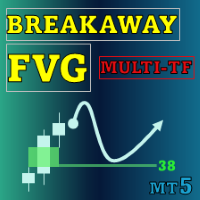
Special offer : ALL TOOLS , just $35 each! New tools will be $30 for the first week or the first 3 purchases ! Trading Tools Channel on MQL5 : Join my MQL5 channel to update the latest news from me Breakaway Fair Value Gaps (FVG) 工具是一种尖端的解决方案,旨在帮助交易者识别价格从平衡中突破的区域,并提供有关修正概率的深入见解。该工具不仅突出关键信号,还包括高级功能以提高决策的准确性。 查看 MT4 版本: Breakaway Fair Value Gaps MT4 查看更多产品: 所有 产品 Breakaway FVG 的关键特点 1. 什么是 Breakaway Fair Value Gap? 定义:
Breakaway FVG 是在价格突破近期历史新 高 或新 低 点时形成的区域。这些区域表明市场的强劲动量,因为买家或卖

Do you want to know how an economic event will impact price? What will happen to price after the news? How has an economic news affected price in the past? This indicator can help you with that.
Do you like technical analysis? Do you enjoy studying the tick history to predict the future? But what do you think could be more important than technical analysis, what could improve technical analysis? Of course, it's fundamental analysis! After all, economic events directly impact the market, and th

Gold Pointer 是最好的趋势指标。该指标的独特算法分析资产价格走势,考虑技术和数学分析因素,确定最有利可图的入市点,并发出买入或卖出指令信号。
最佳指标信号:
- 卖出 = 红色趋势线 + 红色 TF 指标 + 同方向黄色信号箭头。 - 买入 = 蓝色趋势线 + 蓝色 TF 指标 + 同方向水蓝色信号箭头。
该指标的优点
1. 该指标发出的信号准确度高。 2. 该指标的确认信号不会消失,也不会重新绘制--在确认信号(箭头)后会发出声音警报(警报与信息)。 3. 您可以在任何经纪商的 MetaTrader 5 交易平台上进行交易。 4. 您可以交易任何资产(货币、金属、加密货币、股票、指数等)。 5. 您可以在任何时间框架内进行交易(M5-M15 缩放交易/M30-N1 中期交易/H4-D1 长期交易)。 6. 可在指标设置中更改个别参数(颜色、大小等),以便每位交易者都能轻松调整指标,满足自己的需求。 7. 该指标既可作为交易系统的基本补充,也可作为独立的交易系统使用。 8. 在图表上,无论指标设置在哪个时间框架上,它都会显示六个时间框架(M5 M15 M30 H

Gold ATR MTF - 這是一項優秀的股票技術指標。 ATR(平均真實波動幅度)指標的演算法透過繪製指定時間範圍(D1)開盤價的指定百分比(%)的相應水平來分析資產價格的變動並反映波動性。符號價格變動方向和箭頭訊號的指標(紅色和/或藍色 D1 H4)是舒適且有利可圖的日內交易和/或剝頭皮交易的額外且必要的輔助手段。每日利潤可以從外匯符號的 20 點開始,或從黃金符號的 50 點開始。
指標特點: - 這是一個具有魔力、趨勢方向檢測器和兩個趨勢箭頭塊的超級指標,可實現舒適且有利可圖的交易。圖表上顯示用於切換方塊的紅色按鈕。 Magic 是在指標設定中設定的,這樣您就可以在顯示不同區塊的兩個圖表上安裝指標。 - 黃金 ATR MTF 可以放置在具有不同箭頭緩衝區(DM 和 SF)的兩個圖表上。為此,在設定中,您需要選擇不同的魔法,例如,一個魔法=999,另一個魔法=666。然後您就可以在圖表上選擇帶有紅色按鈕的箭頭緩衝區。 - 在黃金 ATR MTF 中,只有當價格劇烈波動時,水平線 (ATR) 才會略微擴大,僅當價格劇烈波動時,趨勢方向指標 (紅色和/或藍色 D1

AtBot: 它是如何工作的以及如何使用它 ### 它是如何工作的 “AtBot”指标用于MT5平台,通过结合技术分析工具生成买入和卖出信号。它集成了简单移动平均线(SMA)、指数移动平均线(EMA)和平均真实波幅(ATR)指标,以识别交易机会。此外,它还可以利用Heikin Ashi蜡烛来增强信号的准确性。 购买后留下评论,您将获得特别的奖励礼物。 ### 主要特点: - 不重绘: 信号在绘制后不会改变。 - 不变动: 信号保持一致,不会被更改。 - 无延迟: 提供及时的信号,没有延迟。 - 多种时间框架: 可在任何时间框架上使用,以适应您的交易策略。 ### 操作步骤: #### 输入和设置: - firstkey (TrendValue): 调整趋势检测的灵敏度。 - Secondkey (SignalValue): 定义买入/卖出信号生成的灵敏度。 - masterkey (ExitValue): 控制信号的退出策略。 - h: 切换是否根据Heikin Ashi蜡烛生成信号(真/假)。 - notifications: 启用或禁用信号提醒。 #### ATR计算: ATR测

Introduction to Support Resistance Risk Management Support Resistance is the most trusted technical analysis. However, the risk management for the support and resistance is not practiced often. Hence we provide one effective risk managment method for the support and resistance trader. In the book: Scientific Guide To Price Action and Pattern Trading (Wisdom of Trend, Cycle, and Fractal Wave), how to use Support Resistance is described as well as Fibonacci Analysis, Harmonic Pattern, Elliott Wave

Dark Sprint is an Indicator for intraday trading. This Indicator is based on Trend Following strategy, also adopting the use of the atr to determine the right volatility. We can enter in good price with this Indicator, in order to follow the strong impulse on the current instrument.
Key benefits
Easily visible sprint lines Intuitive directional arrows Automated adjustment for each timeframe and instrument Easy to use even for beginners Never repaints, never backpaints, Not Lag 100% compatibl

Golden Spikes Detector Acknowledgement and Dedications: The name of this indicator was Inspired by an Original; Mr Grant Koopman; a Knowledgeable and experienced Synthetics trader. I dedicate this indicator to Mr Grant. Overview: The Golden Spikes Premium is a groundbreaking trading indicator meticulously crafted for the Boom and Crash indices on the Deriv market. Tailored to meet the needs of discerning traders, this powerful tool operates exclusively on the one-minute timeframe, providing

Dark Breakout is an Indicator for intraday trading. This Indicator is based on Trend Following strategy, providing an entry signal on the breakout. The signal is provided by the arrow, which confirms the breaking of the level. We can enter in good price with this Indicator, in order to follow the main trend on the current instrument. It is advised to use low spread ECN brokers. This Indicator does Not repaint and N ot lag . Recommended timeframes are M5, M15 and H1. Recommended working pairs

This indicator converted from 5 min Buy and Sell Range Filter - guikroth version on TradingView Popularity of the Range Filter
The Range Filter is a very popular and effective indicator in its own right, with adjustments to the few simple settings it is possible to use the Range Filter for helping filter price movement, whether helping to determine trend direction or ranges, to timing breakout or even reversal entries. Its practical versatility makes it ideal for integrating it's signals into a

该指标显示其他(和非标准)时间范围的最高价/最低价/开盘价/收盘价 - 年、6 个月、4 个月、3 个月、2 个月、月、周、日、H3-H6-H8-H12 小时 。 您还可以设置打开蜡烛的班次并构建虚拟蜡烛。 这些时间范围之一的“周期分隔符”以垂直线的形式提供。 可以针对当前或先前水平的突破(突破昨天/上周的高点/低点等)配置警报。 您还可以将所有级别向右移动一个周期。 也就是说,当前周期将显示前一周期的最高价/最低价。
参数 Number of levels to calculate (0-all) — 屏幕上将显示多少条。 Change the opening of bars (hours) — 将蜡烛的开盘移动 n 小时。 该指标将根据新的开盘时间绘制虚拟柱。 MN1 以上的周期不会改变。 Move the levels to the right — 将所有级别向右移动一格。 您将看到当前蜡烛的先前水平。 Period Separator (vertical lines) — 显示垂直线、周期分隔符。 Show High Lines (trigger for all hig


Candle Range Theory - CRT
Mark Candle Range Theory - CRT bars on the chart.
Options:
choose between 2 bar CRT or CRT that include inside bars Show higher time frame CRT on lower time frame chart show current time frame CRT on chart with higher time frame CRT Alert when new CRT has formed Show / Hide Labels
Button Menu to select Options
for more information on using Candle Range Theory - CRT look on X for @Romeotpt
@SpeculatorFL
Manual

该指标允许您确定当前的价格方向和市场波动。此版本的交易者动态指数消除了历史数据的重绘,优化了算法计算速度,更多的外部参数进行了更精确的调整,并扩展了其功能:增加了初始振荡器的选择和平均线的平滑方法. 参数: Mode Osc - 估计振荡器选择 Period Osc - 所用振荡器的计算周期 Price Osc - 振荡计算的应用价格 Osc volatility bands period - 振荡器的波动周期 Osc volatility bands multiplier - 振荡器的波动率乘数 Smoothing Osc price line period - 主线平滑期 Smoothing Osc price line method - 主线的平滑方法 Smoothing Osc signal line period - 信号线的平滑周期 Smoothing Osc signal line method - 信号线的平滑方法 Use original levels - 允许添加指标的初始水平水平

隆重推出 Auto Trendline,这是一款创新的 MT5 指标,可自动
在您的图表上绘制趋势线。告别繁琐且耗时的手动绘制趋势线任务,
让 Auto Trendline 为您代劳!
*购买后联系我向您发送 说明和分步指南。 凭借其先进的算法,Auto Trendline 会自动检测并为您绘制趋势线,
从而节省您的时间和精力。只需将指标附加到您的图表,并观察它根据价格行为的高点和低点识别和绘制趋势线。 Auto Trendline 是高度可定制的,允许您调整指标的灵敏度以适合您的交易风格和偏好。
您还可以选择不同的线条样式和颜色,甚至可以设置警报以在趋势线被打破时通知您。 无论您是初学者还是经验丰富的交易者,自动趋势线都是识别和分析任何市场趋势的重要工具。
凭借其友好的用户界面和高级功能,该指标一定会提升您的交易体验并帮助您做出更明智的交易决策。 主要特征:
自动绘制趋势线 高度可定制的灵敏度设置 多种线条样式和颜色 破损趋势线的警报通知 用户友好的界面 立即试用自动趋势线,发现自动趋势线分析的好处! 相关产品 : Auto TrendLine MT4

The DR IDR Range Indicator PRO plots ADR, ODR and RDR ranges for a given amount of days in the past. A key feature that appears is that it calculates the success rate of the ranges for the shown days. This indicator is perfect for backtest since it shows ranges for all of the calculated days, not just the most recent sessions. In the PRO version you can now: use fully customizable advanced statistics to base your trades on get an edge via calculating statistics on up to 3 different day period
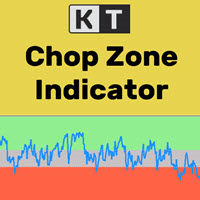
众所周知,金融市场只有大约30%的时间处于趋势状态,其余70%的时间都在区间震荡。然而,大多数初学者交易者很难判断市场当前是处于趋势还是震荡区间。 KT Chop Zone 通过将市场状态清晰地划分为三个区域:看跌区、看涨区和震荡区(Chop Zone),有效地解决了这个问题。
功能特点
通过避免在震荡行情中交易(Chop Zone),即时提高您的交易表现。 也可以用作离场信号。例如,当市场进入震荡区时,您可以选择平掉多单离场。 完全支持自动交易系统(EA),可轻松集成至您的EA中优化交易策略。 包含所有 MetaTrader 平台的提醒功能。
输入参数 主周期: 用于震荡指标的整数值。建议设置在10到30之间。 看涨区间值: 设置看涨区的参考值。 看跌区间值: 设置看跌区的参考值。 颜色设置 提醒设置

5/10份,30美元--->下一个50美元// MT4版本
Forex Vigor 是一个技术指标,评估8种主要货币(欧元、英镑、澳元、新西兰元、美元、加元、瑞士法郎、日元)的动能强度。该指标依靠数学计算来衡量28种货币对之间缺乏相关性的情况。为了计算它们的价值,它使用线性加权平均法(LWMA)加上一个统计系统来分析收盘价之间的百分比差异,该系统消除了模型中不代表意义的价值。这种方法提供了一个加权平均值,使最近的价格变动具有更多的意义。通过考虑这个百分比的差异,该指标提供了一个衡量货币动量的强度和方向。
由于它能够评估主要货币的动能强度,并对市场动态提供有价值的见解,该指标可以帮助交易者识别潜在的交易机会,做出更明智的交易决定,并有效地管理风险。
特点 无重绘 新数据到来时,该指标不改变其数值 交易对 28个交易对 时间框架 所有 (M1, M5, M15, M30, H1, H4, D1, W1, MN) 交易时间 每天24小时
配置
ma_period:这个参数影响算法的计算,按照你的意愿使用它。默认情况下,你不需要改变它。 ma_delta:这个参数会影响算法的计算

Definition : TPO is a Time Price Opportunity. Instead of using bars or candles with an Open, High, Low, and Close price, each "bar" in a Market Profile is represented by horizontal bars against the price It is called Market Profile terminology.
In other words time-price-opportunity (TPO) profiles are histograms of how much time was spent at each price within the span of the profile.
By using a TPO chart, you are able to analyze the amount of trading activity, based on time, for each price level
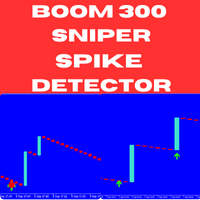
Introducing the Boom 300 Sniper Spike Detector – a powerful, non-repainting indicator specifically engineered to help you master spike trading in the Boom 300 market. Whether you're a seasoned trader or new to the game, this tool offers precise and timely signals, allowing you to catch spikes with confidence and improve your overall trading performance. Key Features: Non-Repainting Signals : Ensures consistent and accurate signals that do not repaint, providing you with reliable data to make con
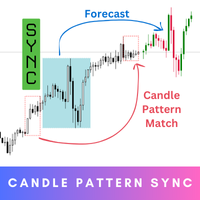
Candle Pattern Sync is your ultimate tool for precision and insight in trading. Step into the future of trading with this innovative indicator that’s designed to help you understand market behavior by analyzing historical patterns and giving you an idea of what might come next. While the forecasts provide valuable probabilities based on history, they’re not guarantees – think of them as a powerful guide to inform your decisions, not a definitive answer. MT4 Version - https://www.mql5.com/en/m

The Smart Liquidity Profile is color-coded based on the importance of the traded activity at specific price levels, allowing traders to identify significant price levels such as support and resistance levels, supply and demand zones, liquidity gaps, consolidation zones, Buy-Side/Sell-Side Liquidity and so on. Smart Liquidity Profile allows users to choose from a number of different time periods including 'Auto,' 'Fixed Range,' 'Swing High,' 'Swing Low,' 'Session,' 'Day,' 'Week,' 'Month,' 'Quart

This LEGIT Indicator Can Accurately Predict the Outcome of One Bar.
Imagine adding more filters to further increase your probability!
Unlike other products, Binary Options PRO can analyze past signals giving you the statistical edge.
How Increase Your Probability
Information revealed here www.mql5.com/en/blogs/post/727038 NOTE: The selection of a Good Broker is important for the overall success in trading Binary Options.
Benefits You Get
Unique algorithm that anticipates price weakness. Gene

If you have been anywhere near Forex forums or social media lately, you have no doubt been hearing people talk about Smart Money Concepts (SMC) trading. You may be wondering what SMC is, and whether it deserves all the hype. In this post, we will introduce Smart Money Concepts trading to you so you can make an informed decision about whether or not to give this strategy a try in your own trading. What is SMC Forex trading? Smart Money Concepts (SMC) is one of many forex trading methods. SMC

The Market Structure Analyzer is a powerful tool designed for traders who follow market structure and smart money concepts. This comprehensive indicator provides a suite of features to assist in identifying key market levels, potential entry points, and areas of liquidity. Here's what it offers:
1. Swing High/Low Detection : Accurately identifies and marks swing highs and lows, providing a clear view of market structure.
2. Dynamic Supply and Demand Zones: Draws precise supply and demand zone

I present an indicator for professionals. Prof MACD is very similar to classic MACD in appearance and its functions . However, Prof MACD is based on completely new algorithms (for example, it has only one averaging period) and is more robust, especially on small timeframes, since it filters random price walks. The classic MACD indicator (Moving Average Convergence / Divergence) is a very good indicator following the trend, based on the ratio between two moving averages, namely the EMA

Was: $99 Now: $49 Blahtech Daily Range indicator displays the average daily range alongside the individual session ranges. Using the daily open price as a reference the indicator shows fixed range and dynamic range targets as lines on the charts. These lines clearly show when the average range has been exhausted. Daily and session ranges can be useful for confirming entries or setting targets and is an excellent odds enhancer for many trading systems. Links [ Documentation | Install | U

MetaCOT 2 is a set of indicators and specialized utilities for the analysis of the U.S. Commodity Futures Trading Commission reports. Thanks to the reports issued by the Commission, it is possible to analyze the size and direction of the positions of the major market participants, which brings the long-term price prediction accuracy to a new higher-quality level, inaccessible to most traders. These indicators, related to the fundamental analysis, can also be used as an effective long-term filter

Smart Drawing Assist PRO MT5. Buttons will appears next to the selected object. The buttons are straightforward and amazingly easy to use. Features are as follow: Draw zigzag . Enabling you to draw patterns, draw zigzag, and draw shapes. All you have to do is click the button and start clicking point to point and it will draw automatically. Change object color . Rectangle/Trendline/HLine/Vline/Text/Price Arrow/Arrowed Line/ and your suggestion please. Flatten trendline . make a perfect flat line

BUY INDICATOR AND GET EA FOR FREE AS A BONUS + SOME OTHER GIFTS! ITALO VOLUME INDICATOR is the best volume indicator ever created, and why is that? The Indicator works on all time-frames and assets, indicator built after 7 years of experience on forex and many other markets. You know many volume indicators around the internet are not complete, does not help, and it's difficult to trade, but the Italo Volume Indicator is different , the Italo Volume Indicator shows the wave volume, when market
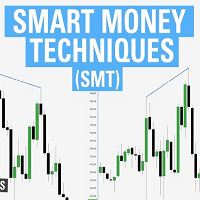
ICT SMT divergence represent a situation in the market where two correlated assets, being seen within the same timeframe, exhibit opposing structure. This can be seen in two positively correlated assets, as one asset forming a higher low, while the other forming a lower low instead of higher low. Version 1.03: Add Higher TF support An ICT SMT divergence serves as the primary signal of reversal for correlated assets. If two positively correlated assets are moving higher and at a point one makes a

MT4 Version Available Here: https://www.mql5.com/en/market/product/43555
Telegram Channel & Group : https://t.me/bluedigitsfx
V.I.P Group Access: Send Payment Proof to our Inbox
Recommended Broker: https://eb4.app/BDFXOsprey *All In One System Indicator, Breakthrough solution for any Newbie or Expert Trader! The BlueDigitsFx Easy 123 System makes it easy to identify important areas of market structure. It alerts you to changes in market structure which typically occur when a reversal

Cycle Sniper MT5 Cycle Sniper MT4 Version and definitions : https://www.mql5.com/en/market/product/51950 Important Notes: MT5 Version does not include Breakout Mode and Late Entry Mode Features.
MT5 Version does not include RSI and MFI filter. **Please contact us after your purchase and we will send you the complimentary indicators to complete the system.**
This indicator does not send any signal without a reason...You can observe and analyze the indicator and the signals it sends Cycle Sni

Golden Spikes Detector This indicator is based on a strategy primarily for trading spikes on Boom and Crash Indices. It alerts on potential Buy and Sell entries. To trade spikes on the Deriv or Binary broker, only take Buy Boom and Sell Cash alerts. It was optimised to be loaded on 5-minute timeframe although multiple timeframe analysis is done in the background. Features · Desktop pop up and sound alerts on computer or laptop · Sends push notifications to mobile phone ·
Mega Spikes Max is your ultimate tool for dominating the markets, giving you the precision and confidence you need to succeed.
Why Choose Mega Spikes Max? Stay Ahead with Real-Time Alerts
Get instant notifications directly to your mobile or desktop when a spike is imminent, even if you're away from your screen. Accurate Spike Detection
Engineered for pinpoint accuracy, Mega Spikes Max identifies high-probability spikes in Boom and Crash indices, helping you time your entries and exits perfectly

** All Symbols x All Timeframes scan just by pressing scanner button ** *** Contact me to send you instruction and add you in "ABCD scanner group" for sharing or seeing experiences with other users. Introduction This indicator scans AB=CD retracement patterns in all charts. The ABCD is the basic foundation for all harmonic patterns and highly repetitive with a high success rate . The ABCD Scanner indicator is a scanner reversal ABCD pattern that helps you identify when the price is about to cha

Was: $69 Now: $49 Blahtech VWAP - Volume Weighted Average Price (VWAP) is the ratio of price to total volume. It provides an average price over a specified time interval. Links [ Install | Update | Documentation ] Feature Highlights
Configurable VWAP Line Sessions, intervals, anchored or continuous Previous day settlement line Standard Deviation bands Alerts at bar close or real time Automatic Broker or Tick volumes Significantly reduced CPU usage
Input Parameters
Expert Advisor Mo

30% Discounted ONLY 10 COPIES HURRY UP! 8 LEFT COPIES MTF UPDATED IN NEW VERSION Note: If MTF Order Not Work just do one thing one, when you set Show_mtf to true then don't change otf timeframe instead you insert indicator and then again open setting and change current otftimeframe to other in this way it will work. It issue from Mql5 not refresh setting properly. Very precise patterns to detect High Accurate Order Blocks: It Draw zone after market Structure Breakout with a high Accuracy,

Smart Fibo Zones are powerful, auto-generated Fibonacci Retracements that are anchored to key market structure shifts . These zones serve as critical Supply and Demand levels, guiding you to identify potential price reactions and confirm market direction. Fibonacci calculations, widely used by professional traders, can be complex when it comes to identifying highs and lows. However, Smart Fibo Zones simplify this process by automatically highlighting order blocks and key zones, compl

Overview:
"TrendLine Alerts" is a dynamic, multi-functional trading tool designed to monitor and alert traders in real-time when price action touches or breaks critical technical levels. Built for precision, it seamlessly tracks trendlines, horizontal support/resistance, vertical time-based lines, and equidistant channels , ensuring you never miss a key market movement. Whether you’re scalping, swing trading, or managing long-term positions, this indicator acts as your 24/7 market sentinel. K
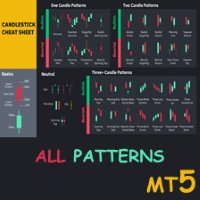
Special offer : ALL TOOLS , just $35 each! New tools will be $30 for the first week or the first 3 purchases ! Trading Tools Channel on MQL5 : Join my MQL5 channel to update the latest news from me 掌握蜡烛图形态是每个希望在市场中做出明智决策的交易者必备的技能。介绍 All Candlestick Patterns —— 一款全面的工具,旨在提升您的技术分析水平,为您提供强大的市场趋势和潜在反转洞察。这个综合解决方案识别每一种主要的蜡烛图形态,使预测价格走势并精确调整您的策略变得前所未有的简单。 查看蜡烛图形态及其含义: All Candlestick Patterns - Meaning and Effects - Analytics & Forecasts - Traders' Blogs
查看 MT4 版本: All Candlestick Patt

Introduction to Harmonic Pattern Scenario Planner
The present state of Forex market can go through many different possible price paths to reach its future destination. Future is dynamic. Therefore, planning your trade with possible future scenario is an important step for your success. To meet such a powerful concept, we introduce the Harmonic Pattern Scenario Planner, the first predictive Harmonic Pattern Tool in the world among its kind.
Main Features Predicting future patterns for scenario

** All Symbols x All Timeframes scan just by pressing scanner button ** *** Contact me to send you instruction and add you in "Trend Reversal group" for sharing or seeing experiences with other users. Introduction: Trendlines are the most famous technical analysis in trading . Trendlines continually form on the charts of markets across all the different timeframes providing huge opportunities for traders to jump in and profit on the action. In the other hand, The trendline reversal str

BUY INDICATOR AND GET EA FOR FREE AS A BONUS + SOME OTHER GIFTS! ITALO TREND INDICATOR is the best trend indicator on the market, the Indicator works on all time-frames and assets, indicator built after 7 years of experience on forex and many other markets. You know many trend indicators around the internet are not complete, does not help, and it's difficult to trade, but the Italo Trend Indicator is different , the Italo Trend Indicator shows the signal to buy or sell, to confirm the signal t

这是一个交易时段指标,可以显示四个交易时段的所有级别(开盘价-最高价-最低价-收盘价)。 该指标还可以预测会话级别。 会话可以用线条或矩形(空的或填充的)绘制,线条可以延伸到下一个会话。 您可以通过按热键(默认为“1”、“2”、“3”、“4”)轻松隐藏/显示每个会话。
您可以看到 ASR(平均会话范围)线(默认热键“A”) 。 这与 ADR 计算类似,只是它是根据最后一个 X 交易时段计算的,这使您可以看到当前(和之前)交易时段的潜在范围(今天价格可以移动多远)。 平均值的计算方式为之前会话的总和除以会话数(参数“ASR 周期(计算平均值的会话数)”),每个会话都有自己的 ASR 值。
该指标计算并绘制未来的会话及其大小。 正确识别报价历史记录中的漏洞。 它还可以在每个会话开始时绘制垂直分隔符。
指标自动确定图表的配色方案。
当价格触及会话水平或价格突破已关闭会话指定距离时,它还会发送警报。 可以禁用每个会话的警报。
参数“如果其他会话启动则停止会话”(热键“S”)允许您停止过时的会话,并在新会话中断时接收警报。
该指标可以绘制枢轴水平并就其发送警报。 这些级别是根据
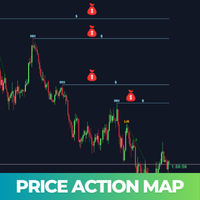
Price Action Map is an advanced trading indicator meticulously designed to provide clear visual insights into market structure by precisely labeling Higher Highs (HH) , Higher Lows (HL) , Lower Highs (LH) , and Lower Lows (LL) . Traders who find it challenging to accurately identify higher highs, lower lows, or understand different market phases will find this tool exceptionally valuable. Price Action Map significantly simplifies the analysis process, enabling traders at all skill levels to conf

MCDX is an indicator based on specific formula to detect Buy and Sell momentum Red Bar means Price go up and Buy momentum. Green Bar means Price go down and Sell momentum" Height of RED bar > 50% means Bull is in control. i.e. RED more than GREEN to go buy. Lower of Green bar < 50% means Bear is in control. i.e. GREEN more than RED to go sell. DARKER RED COLOR - STRONG Up Trend or Strong Bullish Power
LIGHTER RED COLOR - WEAK Up Trend or Weak Bullish Power
LIGHTER GREEN COLOR - STRONG Down Tr
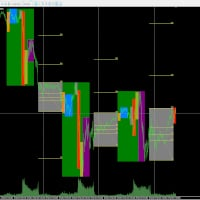
該指標是我們每天使用的最常見的指標,包括我們最常用的策略,ICT和SMC,交易所開盤和收盤時發生的止損限額和流動性限額,以及帶有斐波那契和放大和縮小的交易所交易量,以及您想要看到的最常見操作,例如選擇您想要看到的交易所走勢並拉動您想要的全波那契那,都是自動操作您想要的交易。我 100% 確信,一旦您學會使用此指標分析所有類型的交易,您將再也無法離開它。 該指標是我們每天使用的最常見的指標,包括我們最常用的策略,ICT和SMC,交易所開盤和收盤時發生的止損限額和流動性限額,以及帶有斐波那契和放大和縮小的交易所交易量,以及您想要看到的最常見操作,例如選擇您想要看到的交易所走勢並拉動您想要的全波那契那,都是自動操作您想要的交易。我 100% 確信,一旦您學會使用此指標分析所有類型的交易,您將再也無法離開它。

To get access to MT4 version please click here . This is the exact conversion from TradingView: "Supertrend" by " KivancOzbilgic ". The screenshot shows similar results from tradingview and Metatrader when tested on ICMarkets on both platforms. This is a light-load processing and non-repaint indicator. You can message in private chat for further changes you need. Here is the source code of a simple Expert Advisor operating based on signals from Supertrend . #include <Trade\Trade.mqh> CTrade tra
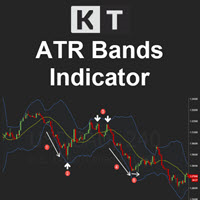
KT ATR Bands 利用平均真实波动范围(ATR)和移动平均线(MA)的组合绘制波动性通道和带状图。它们通常用于识别潜在的价格反转点以及高波动和低波动的时期。这个指标对趋势识别和风险管理都非常有帮助。
功能特点
多时间框架支持: 例如,您可以在 H1 图表上显示来自日线图的 ATR 带。 智能提醒: 可为每条带单独开启/关闭提醒,并设置提醒之间的最小时间间隔,以避免重复通知。 完全可自定义: 支持自定义 ATR 周期、MA 方法及配色方案。 从零开发: 指标从头编写,确保稳定性和性能,无常见Bug。
理解 ATR Bands 在外汇交易世界中,有许多旨在帮助交易者提高胜率的技术指标,其中一个非常有效的工具就是 ATR Bands。它能提供对市场波动性的深入分析。 我们将讨论如何在 MT4/MT5 平台上设置 ATR 带、制定进场策略,以及如何设定止损和止盈水平。
ATR Bands 背景
ATR Bands(平均真实波动范围带)是一种基于波动性的通道,绘制在价格上下方。 其计算基于 ATR 值,该值衡量某时间段内资产价格的整体波动幅度。 一般默认使用 14 个周期进行计算。

VWAP 波段视觉样式 1.0 金融市场指标是交易者和投资者用来分析金融市场和做出决策的重要工具。 VWAP 和布林带是交易者用来衡量市场趋势和价格波动的两种流行技术分析工具。在此产品中,我们建议结合这两个指标来创建一个独特的产品,提供对市场趋势和波动性的全面分析。该产品非常适合希望根据数据驱动分析做出明智决策的交易者和投资者。
背离策略是一种流行的技术分析技术,交易者使用它来识别市场中潜在的趋势逆转。该策略依赖于识别价格走势和技术指标之间的差异。在本节中,我们将使用视觉风格和布林带描述背离策略。
例如,使用 Visual Style 和 Bollinger Bands 的背离策略是一种流行的技术分析技术,交易者使用它来识别市场中潜在的趋势逆转。该策略依赖于识别 RSI 和证券价格行为之间的差异。通过使用此策略,交易者可以根据数据驱动的分析做出明智的决策,从而实现更有利可图的交易和投资。

像大玩家一样交易!ITZ 是交易者寻求与机构动向保持一致的终极工具。
它让您随时了解市场交易的开始和结束,同时利用高度优化的策略获取交易信号。
主要特点:
多币种支持——轻松跨不同资产进行交易。 针对 M1 至 M30 时间范围进行了优化——非常适合剥头皮者和日内交易者。 3 种强大的信号策略——专为高概率交易而设计。 交易标记和警报——通过悉尼、东京、伦敦和纽约市场交易通知保持领先。 自定义声音警报——通过独特的音频提示获得通知,以提高交易意识。 更高获胜概率信号——针对高峰时段的有效性进行过滤。 持续开发和更新——通过定期增强保持领先地位。 我们准备了一个包含有用指南的视频,以帮助您充分利用它。
视频空间: https://youtu.be/A4PpQ0NyEWs
如需咨询或个性化支持,请随时通过私人消息与我们联系。
有兴趣永久收购整个项目吗?让我们讨论一下——通过私人消息联系我们!”
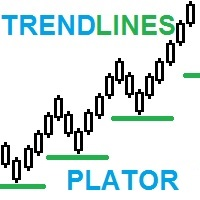
TrendPlator:一种用于优化交易策略的强大趋势预测指标 发现我们新指标的威力!它能够计算更大时间框架的趋势线并直接投射到当前时间框架,为您提供战略支持,吸引所有交易者的注意力。这些点将成为您交易操作中强大的支撑或阻力水平,推动您的交易策略。 想象一下拥有一个完美补充您价格行动指标集合的指标。我们的新指标就是这样的!测试它并惊讶于它的准确性。它可能是您策略中缺失的一部分,能够推动您的交易结果。 别浪费时间!抓住机会将这个令人惊叹的工具加入您的交易武器库。如果您认识到它的价值和潜力,不要犹豫,立即购买。通过我们的强大指标,提高您的交易准确率并达到新的成功高度! 及时了解我们的最新消息 立即订阅以获取我们独家发布的最新产品。将 Francisco Gomes da Silva 添加为好友,即可独家获得我们的新产品。 别再浪费时间了! 立即下载我们的 Metatrade指标 ,秒速获取准确高效的市场分析。 同样适用于MT4,请下载此工具 如果您在Metatrade 4中正在寻找此类工具,则可以通过此链接下载: Trendlines Plator MT4 。

揭示交易见解与自动锚定VWAP: 自动锚定VWAP 是您在交易世界中的指导伙伴。这些指标能够精准地定位市场关键转折点,并使用VWAP线在您的图表上进行标记。这对于采用锚定VWAP策略的交易者来说是一个改变游戏规则的工具。 它如何工作? 识别高点: 如果当前蜡烛的最高价格低于前一蜡烛的最高价格, 并且前一高点高于之前的高点, 我们就识别出了一个峰值。 这个重要的点位于这三根蜡烛的中间位置。 识别低点: 如果当前蜡烛的最低价格高于前一蜡烛的最低价格, 并且前一低点低于之前的低点, 我们就发现了一个底部。 这个底部的中心是我们的关注点。 绘制锚定VWAP: 每个顶部和底部都对应一个VWAP线。但有一个限制:由于指标的计算需求,图表上一次只能显示8条线。 随着更多的线条出现,旧线条让位给新线条。如果一个新的锚定VWAP线关闭,它将再次为旧的锚定VWAP线打开路径。 您有权掌控!根据您的节奏调整“时间框架”设置。请记住,在确认峰值或低谷之前,等待您选择的时间框架的蜡烛关闭。需要三根蜡烛来确认它们,我们会指向中间的那一根。 为了更平稳地交易,保持“当前时间框架”设置。如果您喜欢历史分析,请选择“更

KT Currency Strength Meter(货币强弱指标)通过对主要外汇货币对应用聚合数学公式来衡量各个货币的强弱。 该指标通过计算固定周期内的多头与空头K线来判断强弱。系统会根据这些数据进行实时排序,从而确定哪些货币最强、哪些最弱,并持续更新它们的排名。
优势
通过避免买入强势货币对抗弱势货币的信号,即刻优化您的交易策略。 帮助避免无意的对冲和过度交易行为。 规避高风险的逆趋势交易,即不要买入最弱的货币对抗最强的货币,反之亦然。 有助于剔除会互相抵消的交易持仓。 指标通过实时数据持续更新,确保最新表现。 程序代码轻量,不占用CPU资源,不影响其他策略或指标的正常运行。 每种货币都有专属颜色,便于快速识别与区分。 参数设置简单直观,无需复杂配置。
专业建议 由于数据来源为当前时间框架,请避免在低周期中使用,容易产生频繁且不稳定的波动。 在重要新闻事件期间,请勿过度依赖指标,因为基本面优先于技术面。 建议作为确认工具使用,而非主要交易信号源。 想要结合货币相关性分析?欢迎查看我们的进阶版 货币强度与相关性指标 ,它将更高级的强度算法与相关矩阵结合。
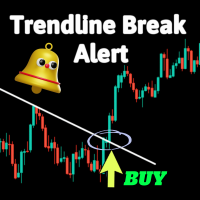
這是一個簡單的指標,可以提供趨勢線突破的警報。
如果您在交易中習慣使用趨勢線,它可能會很有用。 可調參數包括:
蠟燭標識:突破後何時發出信號 以及三種類型的警報: 發送郵件 聽得到的警報 推送通知
為了測試目的,我們建議使用 MetaTrader 4 而不是 MetaTrader 5 的策略測試器,因為它不支持繪製趨勢線。
MT4 版本在: https://www.mql5.com/en/market/product/111112?source=Site+Market+My+Products+Page
觀看此視頻以了解如何在您的手機上設置通知警報:
https://www.youtube.com/watch?v=4oO-3fMQ4QA
安裝指南:
https://www.mql5.com/en/blogs/post/739828
https://www.mql5.com/en/blogs/post/751762
我歡迎您對指標提供反饋或評論。
祝您交易成功!
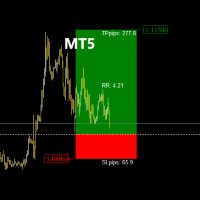
TradeManagerRR Visualizer MT5 是一个交易管理工具,旨在帮助交易者轻松地在图表上可视化他们的止损(SL)和获利(TP)水平。此初始版本提供了一个简单的图形表示,显示SL和TP区域以及入场价格。请注意,目前的版本仅专注于图形显示SL和TP区域的图形标记。 当前版本的特点: SL和TP区域显示: 清晰地显示止损和获利水平,支持自定义颜色。 可移动入场价格: 允许在图表上移动入场价格,以查看SL和TP水平的变化。 风险/回报比率计算: 动态显示基于设定水平的风险/回报比率。 使用方法: 设置入场价格: 点击图表以设置您的入场价格。 调整SL和TP水平: 移动SL和TP区域,以调整风险和回报水平。 查看区域: SL和TP区域将以不同的颜色显示,以方便可视化。 即将推出: 更新版本将在几天内发布,提供更多功能和改进,以实现更有效的交易管理。 请求: 如果您觉得 TradeManagerRR Visualizer MT5 有用,请在产品页面上进行评分。您的反馈对我们非常重要,有助于改进我们的工具。
MetaTrader市场提供了一个方便,安全的购买MetaTrader平台应用程序的场所。直接从您的程序端免费下载EA交易和指标的试用版在测试策略中进行测试。
在不同模式下测试应用程序来监视性能和为您想要使用MQL5.community支付系统的产品进行付款。
您错过了交易机会:
- 免费交易应用程序
- 8,000+信号可供复制
- 探索金融市场的经济新闻
注册
登录