Смотри обучающее видео по маркету на YouTube
Как купить торгового робота или индикатор
Запусти робота на
виртуальном хостинге
виртуальном хостинге
Протестируй индикатор/робота перед покупкой
Хочешь зарабатывать в Маркете?
Как подать продукт, чтобы его покупали
Платные технические индикаторы для MetaTrader 5 - 5

Currency Strength Meter - это самый простой способ определить сильные и слабые валюты. Этот индикатор показывает относительную силу 8 основных валют + Золото: AUD, CAD, CHF, EUR, GBP, JPY, NZD, USD, XAU . Символ золота может быть изменен на символ другого инструмента, например такого как XAG, XAU и т.д.
По умолчанию значение силы нормализовано в диапазоне от 0 до 100 для алгоритма RSI: Значение выше 60 означает сильную валюту; Значение ниже 40 означает слабую валюту;
Для работы данного инди

ADX индикатор используется для определения тренда и его силы. Направление цены показывают значения +DI и -DI, а величина ADX показывает силу тренда. Если +DI находится выше -DI, то на рынке восходящий тренд, если же наоборот, то нисходящий. Если ADX ниже 20 то на рынке нет определенного движения. Как только индикатор пробивает этот уровень, начинается средней силы тренд. Значения выше 40 говорит о наличии сильной тенденции, будь то нисходящей или восходящей.
Мультивалютный и мультитаймфреймо

Индикатор Elliott Wave Trend был разработан для научного подсчета волн на основе шаблонов и паттернов, впервые разработанных Чжон Хо Сео. Индикатор нацелен на максимальное устранение нечеткости классического подсчета волн Эллиотта с использованием шаблонов и паттернов. Таким образом индикатор Elliott Wave Trend в первую очередь предоставляет шаблон для подсчета волн. Во-вторых, он предлагает структурный подсчет волн Wave Structural Score, которые помогает определить точное формирование волны. Он

MT4 indicator version https://www.mql5.com/en/market/product/72342
I personally use this indicator to scalp. Accurate for accessing extremes and supports for buy positions primarily for 1 minute time frames. Other time frames can be used but the levels are different. Its a better oscillator and compare with others to see the difference. Day trade using neuro network concepts. This indicator uses elementary forms of neuro networks to generate signals to buy and sell. Use the indicat

IMPORTANT: The indicator will remain at the price of $34.90 until the release of the update scheduled for July 16, 2024. The New Price will be $49.90 (taxes excluded) FVG indicator. If you are an SMC trader this indicator will be very useful to you, it automatically identifies the FVGs on the graph distinguishing them into 2 types: bearish FVGs and bullish FVGs (see the photos to understand better). This indicator works on any Timeframe and on any market you want to use it. If you are interested

up down v6 for mt5 is no repaint all timeframe and all pairs indicator. red histogram cros trigger that is up point,and put a red point on histogram. and blue histogram cros trigger that is deep point.and put blue point on histogram. this indicator need to sometimes zoom out .for thise pres + button. if newly comes signal is too high makes before invisible.red and blue points are there.to see the signals. indicator is no repaint and can use all time frame and all pairs. only need minimum 500 bar

Live Trading Results MT4 Version Contact for Manual Guide Next Price $125 Free Scanner Dashboard (Contact me)
Strategy - Breakout / Retest / Aggressive Hello Everyone, We are excited to introduce one of the most reliable and high win rate patterns in trading: the Cup and Handle . This is the first time we are releasing this meticulously crafted indicator, boasting an impressive 95% success rate . It is versatile and effective across all types of pairs, stock

This indicator shows the engulfing pattern, which is the most direct manifestation of capital flow. Engulfing Pattern is a common price reversal pattern in technical analysis, which usually appears at the end of a price trend or at key support and resistance levels. It can be divided into two types: Bullish Engulfing Pattern and Bearish Engulfing Pattern. Bullish Engulfing Pattern feature: Previous K-line: This is the negative line of a small entity (the opening price is higher than the closing
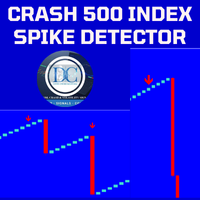
Spike Detector for Boom and Crash Indices
The Spike Detector is specifically designed to cater to the unique needs of traders in the Boom and Crash indices markets. Optimized for M1 (1-minute) and M5 (5-minute) timeframes, this tool ensures you receive timely and actionable insights. Below, you'll find a comprehensive guide on its key features, advantages, installation process, and how to use it effectively.
Key Features and Advantages
1. Non-Repainting: The Spike Detector guarantees accu

The Quantitative Qualitative Estimation (QQE) indicator is derived from Wilder’s famous Relative Strength Index (RSI). In essence, the QQE is a heavily smoothed RSI.
Modification of this version: ( converted from tradingview script by Mihkell00, original from Glaz)
So there are Two QQEs. One that is shown on the chart as columns, and the other "hidden" in the background which also has a 50 MA bollinger band acting as a zero line.
When both of them agree - you get a blue or a red bar.

Этот индикатор предназначен для более быстрого и легкого просмотра множества графиков в разных временных масштабах. Отслеживание времени и цены на нескольких графиках Измените символ на одном графике, и все остальные графики того же символа также будут изменены. Простота в использовании, быстрое освоение Индикатор позволяет определить цену и время, когда указатель мыши находится на текущем графике, на всех других графиках, открытых на том же символе. Это позволяет быстро просматривать информацию

White Weis Volume
This indicator shows the sum of the volume in each wave, bulish or bearish, as idealized by David Weis , but it brings an important addition , which is the marking of the bar with the highest volume of the wave (White Bar)!
In coding the indicator, it was sought to optimize the code to require minimal processing during use and not to overload mt5.
The indicator can be used for pre-trading analysis and study, where the trader analyzes possible points of support and resi

An indicator to draw a graph of account current and historical state such as Balance, Equity, Margin, Free Margin, Margin Level, Drawdown, Account Profit, Deposit and Withdrawals.
Indicator Inputs : Draw Balance Graph Draw Equity Graph Draw Margin Graph Draw Free Margin Graph Draw Margin Level Graph Draw Drawdown Graph Draw Account Profit Graph Hide Data on Chart and Buffers Connect Gaps by Lines Sign of DDs on Profit Sign of DDs on Loss
Tips : The Indicator will draw historical balance gra

The Crash and Boom VT indicator is a highly adaptable trading tool designed to operate across a wide range of market conditions, including Crash 300, Crash 500, Crash 1000, Boom 300, Boom 500, and Boom 1000. Engineered to blend Oversold (OS), Overbought (OB), and Macho periods, this advanced indicator generates reliable trading signals, especially when used on a 5-minute timeframe. For the best outcomes, it's recommended to set the Macho period between 4-5. While the indicator offers robust capa

Волны Вольфа - это естественные торговые модели, присутствующие на всех финансовых рынках и представляющие собой борьбу за равновесную цену. Эти модели могут развиваться в течение коротких и долгосрочных периодов времени и являются одной из самых надежных моделей прогнозного разворота из существующих, обычно предшествующих сильным и долгим движениям цены. [ Руководство по установке | Руководство по обновлению | Устранение неполадок | FAQ | Все продукты ] Четкие торговые сигналы Удивительно легк

We mark the fair value gap (FVG) and wait for the price to reach that zone, but sometimes it reverses before getting there. This can happen because we didn't notice the Balanced Price Range (BPR). My tools will enhance your analysis by displaying everything on the chart, helping you identify potential price reversal areas so you can make informed decisions about when to enter the market. MT4 - https://www.mql5.com/en/market/product/119216 So, what is BPR or Balanced Price Range? A Balanced Pri

A Swing Failure Pattern ( SFP ) is a trade setup in which big traders hunt stop-losses above a key swing high or below a key swing low for the purpose of generating the liquidity needed to push price in the opposite direction. When price 1) pierces above a key swing high but then 2) closes back below that swing high, we have a potential bearish SFP . Bearish SFPs offer opportunities for short trades. When price 1) dumps below a key swing low but then 2) closes back above that swing low, we have

Magic Candles это новый продукт, который позволяет идентифицировать текущую рыночную фазу (восходящий тренд, нисходящий тренд или флет). Данный индикатор раскрашивает бары в разные цвета в зависимости от текущего состояния рынка и сигнализирует пользователю о смене тенденции с помощью алерта. Magic Candles прекрасно подойдет для торговли валютами (в том числе и криптовалютами) и бинарными опционами.
Преимущества Подходит для скальпинга и торговли внутри дня. Отсутствует перерисовка (пересч

The ICT Concepts indicator regroups core concepts highlighted by trader and educator "The Inner Circle Trader" (ICT) into an all-in-one toolkit. Features include Market Structure (MSS & BOS), Order Blocks, Imbalances, Buyside/Sellside Liquidity, Displacements, ICT Killzones, and New Week/Day Opening Gaps. It’s one kind of Smart money concepts. USAGE: Please read this document ! DETAILS Market Structure Market structure labels are constructed from price breaking a prior extreme point. T

The ICT Silver Bullet indicator is inspired from the lectures of "The Inner Circle Trader" (ICT) and highlights the Silver Bullet (SB) window which is a specific 1-hour interval where a Fair Value Gap (FVG) pattern can be formed. A detail document about ICT Silver Bullet here . There are 3 different Silver Bullet windows (New York local time):
The London Open Silver Bullet (3 AM — 4 AM ~ 03:00 — 04:00)
The AM Session Silver Bullet (10 AM — 11 AM ~ 10:00 — 11:00)
The PM Session Silver Bulle

ICT Kill zone and Macros Indicator mark and display the following zone times on the chart: Kill zones Kill zone Forex Asian
London Open New York Open London Close Central Bank Dealing range
Kill zone Indices Asian London Open New York AM New York Lunch New York PM Power Hour
Macros London 1 London 2 New York Am 1 New York AM 2 New York Lunch New York PM 1 New York PM 2
Silver bullet London Open New York AM New York PM
Sessions Asian London New York
Chart The display of Kill zone ,

Ронал Кутрим в течение 14 лет был увлеченным математиком с более чем 10-летним опытом работы на финансовом рынке.
Концепция теории проста - найти дисбаланс между покупателями и продавцами. В этом есть большой смысл, потому что ничто не растет вечно, ничто не падает вечно. Когда вы находите актив с математической вероятностью неравновесного равновесия, это отличный способ заняться трейдингом: Включите субтитры, видео сопровождается субтитрами

MACD divergence signals MACD is called Convergence and Divergence Moving Average, which is developed from the double exponential moving average. The fast exponential moving average (EMA12) is subtracted from the slow exponential moving average (EMA26) to get the fast DIF, and then 2× (Express DIF-DIF's 9-day weighted moving average DEA) Get the MACD bar. The meaning of MACD is basically the same as the double moving average, that is, the dispersion and aggregation of the fast and slow moving a

Описание: Индикатор тиковых объемов Better Volume MT5 позволяет оценить общее настроение рынка и достаточно точно поймать моменты образования крупных движений. Индикатор представляет собой цветную гистограмму в дополнительном окне. В расчете Better Volume MT5 учитывается комбинации Price Action, отображаются значения объемов высотой столбцов и цветной маркировкой. Входные параметры: MAPeriod - период расчета скользящей средней для объема; LookBack - период за который ищется корректный и относи

The Multitimeframe-Candles (MCandles) - Indicator for MT5 shows the contour of an higher, free selectable, timeframe as an overlay on the current timeframe. You can freely choose the timeframe, number of candles and color of the overlays. The indicator only calculates the current candle frequently, so it saves computing capacities. If you like the indicator, please left a comment.

To download MT4 version please click here . - This is the exact conversion from TradingView: "Linear Regression Candles" By "ugurvu". - The overall look of the indicator is like Heiken Ashi. - It can be used as a trend confirmation indicator to detect the right trend direction. - This indicator lets you read the buffers for Candles' OHLC. - This is a non-repaint and light processing load indicator - You can message in private chat for further changes you need. Thanks

This indicator Displays current spread in the main window of the chart. You can modify the font parameters, indicator's position and the normalization of the spread value. The spread is redrawn after each tick, ensuring the most current and active spread value. This can be useful for brokers with variable spreads or with spreads that are widened often. You can also enable a spread label to be shown near the current Bid line. you can also set alert : Email, and push notifications.
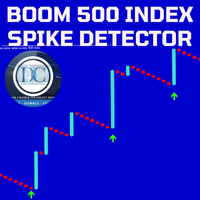
Our Spike Detector is specifically engineered to cater to the unique needs of traders in the Boom and Crash indices markets. This tool is optimized for M1 (1-minute) and M5 (5-minute) timeframes, ensuring you receive timely and actionable insights.
Key Features:
1. Non-Repainting**: Our detector guarantees accuracy with non-repainting signals, ensuring your data remains consistent and reliable. 2. Push Notifications**: Stay updated with real-time push notifications, so you never miss a cr

RTS5Pattern-touch-mouse -EN is a revolutionary statistical indicator designed for the MetaTrader 5 platform, bringing an innovative approach to technical analysis and market movement prediction. This indicator combines advanced mathematical methods, including normalization and historical data analysis, with a user-friendly interface and precise trading capabilities. RTS5Pattern-touch-mouse -EN is an ideal tool for traders looking to improve their trading strategies and achieve better results.

Offer 249 down from 350 for the next 1 copies. then back to 350 $
Are you tired of using outdated indicators that leave you guessing where to set your profit targets? Look no further than the AK CAP Opening Range Breakout Indicator. This powerful tool is backed by a US patent and has already helped countless traders pass funded challenges like FTMO. We use it daily on our prop traders and internal funds, and now it's available to you as well. The calculation behind the indicator is incredibly

Higher Timeframe Chart Overlay will display higher timeframe candles, including the number of candles high/low you specify.
You no longer need to switch timeframes to check the candles. Everything can be shown in one chart. MT4 Version : https://www.mql5.com/en/market/product/115680 Almost everything can be change as you want. You can change/set:
- Choose different colors for the body and top/bottom wicks.
- Panel's height and width.
- The width of the body and wicks
- Change backgrou

Индикатор осуществляет поиск и маркировку на графике торговых сигналов "Пятое измерение". Подробное описание графических моделей, формирующих торговые сигналы можно прочитать в главе 8 "Торговля с помощью линии баланса" книги Б. Вильямса "Новые измерения в биржевой торговле". Сигнальные уровни с указанием цены на вход в позицию или установку стоп-лосса, указываются непосредственно на графике. Эта функция создает дополнительные удобства трейдеру в момент выставления отложенных ордеров. Сплошная

Индикатор строит графики зафиксированной на момент закрытия свечи прибыли для закрытых (или частично закрытых) длинных и коротких позиции отдельно. Индикатор позволяет фильтровать сделки по текущему символу, заданному ID эксперта (магическому числу) и наличию (отсутствию) подстроки в комментарии к сделке, задавать начальное время и периодичность сброса прибыли (ежедневно, еженедельно или ежемесячно) для расчёта графика прибыли. Индикатор также отображает плавающую (не зафиксированную) прибыль от

Introducing a cutting-edge trading indicator, specifically designed to predict and signal upcoming spikes in Boom 1000 and Boom 500 markets. This innovative tool provides traders with timely alerts, enabling them to capitalize on market movements with precision. Key Features: Accurate Spike Prediction : The indicator utilizes advanced algorithms to identify potential spike occurrences in Boom 1000 and Boom 500 markets. User-Friendly Signals : The indicator generates clear buy signals, allowing t

Уникальный индикатор IceFX VelocityMeter Mini для платформы MetaTrader 4 измеряет скорость рынка форекс . Это не обычный индикатор объемов или других величин. IceFX VelocityMeter Mini способен понять скорость скрытых в тиках движений рынка, а эта ценная информация не доступна в обычных свечах, поэтому не может быть получена простым индикатором. Этот индикатор контролирует приход тиков (частоту и величину изменения) в пределах указанного диапазона времени, анализирует эти данные, определяет, запи

Royal Wave is a Trend-Power oscillator which has been programmed to locate and signal low-risk entry and exit zones. Its core algorithm statistically analyzes the market and generates trading signals for overbought, oversold and low volatile areas. By using a well-designed alerting system, this indicator makes it easier to make proper decisions regarding where to enter and where to exit trades. Features Trend-Power Algorithm Low risk Entry Zones and Exit Zones Predictions for Overbought and Over

This indicator can be considered as a trading system. It offers a different view to see the currency pair: full timeless indicator, can be used for manual trading or for automatized trading with some expert advisor. When the price reaches a threshold a new block is created according to the set mode. The indicator beside the Renko bars, shows also 3 moving averages.
Features renko mode median renko custom median renko 3 moving averages wicks datetime indicator for each block custom notificatio

Quarterly Cycles
Quarterly Cycles is based on the Quarterly Theory developed by Daye ( traderdaye on X ). This is an aid to the user to find Cycles and it is NOT automatic detected, user can select AMDX or XAMD in each Cycle and it will be visually drawn on the chart. Quarterly Cycles: Yearly, Monthly, Weekly, Daily, 6 Hour (90 minutes)
– Yearly Cycle : The year is divided in four sections of three months each Q1 - January, February, March Q2 - April, May, June Q3 - July, August, Sept

Хотели бы вы увидеть будущие линии индикатора ZigZag ? Этот индикатор поможет вам в этом, благодаря тому, что модель индикатора построена на основе двух индикаторов: Historical Memory и ZigZag . Благодаря этому индикатор предсказывает линии ZigZag'а. Весьма удобен в качестве помощника, служит ориентиром будущего характера движения цены. Прогноз рассчитывается методом поиска в истории наиболее похожего участка (паттерн) на текущий. Индикатор рисуется в виде линии, показывающей исторический и

MT4 Version Available Here: https://www.mql5.com/en/market/product/43438
Telegram Channel & Group : https://t.me/bluedigitsfx
V.I.P Group Access: Send Payment Proof to our Inbox
Recommended Broker: https://eb4.app/BDFXOsprey
* Breakthrough Solution For Reversal Trading And Filtering With All Important Features Built Inside One Tool! BlueDigitsFx Spike And Strike Reversal is a mixed oscillator that mixes the readings of a number of indicators, which makes it potential to preci

Паттерн 123 - один из самых популярных, мощных и гибких графических паттернов. Паттерн состоит из трех ценовых точек: дна, пика или долины и восстановления Фибоначчи между 38,2% и 71,8%. Паттерн считается действительным, когда цена выходит за пределы последнего пика или долины, в момент, когда индикатор строит стрелку, выдает предупреждение, и сделка может быть размещена. [ Руководство по установке | Руководство по обновлению | Устранение неполадок | FAQ | Все продукты ]
Четкие торговые сиг

PTS - Divergence Buy Finder от Precision Trading Systems Precision Divergence Finder был разработан для точного определения дна рынка и часто успешно справляется с этой задачей. В техническом анализе искусство выбора дна обычно намного проще, чем выбор вершины, и этот инструмент разработан именно для этой задачи. После обнаружения быстрой дивергенции мудро подождать, пока тренд не изменится вверх, прежде чем покупать. Для входа можно использовать высокий уровень за 10 или 20 баров или скользящее

PTS - Divergence Buy Finder от Precision Trading Systems Precision Divergence Finder был разработан для точного определения дна рынка и часто успешно справляется с этой задачей. В техническом анализе искусство выбора дна обычно намного проще, чем выбор вершины, и этот инструмент разработан именно для этой задачи. После обнаружения быстрой дивергенции мудро подождать, пока тренд не изменится вверх, прежде чем покупать. Для входа можно использовать высокий уровень за 10 или 20 баров или скользящее

Комбинация из двух осцилляторов. Первый отображает точки входа, второй - текущий тренд. Индикатор может отображать сигналы осцилляторов стрелками в двух режимах, все сигналы быстрого осциллятора или сигналы только по текущему тренду. Имеет мультитаймфреймовую панель и три типа уведомлений о появлении сигнала. Преимущества: Подходит для дневной и скальпирующей торговли Трендовая фильтрация Простая и чувствительная настройка Мультитаймфреймовая панель Подходит для интеграции в советник. Работае

Следующее поколение автоматизированных зон спроса и предложения. Новый инновационный алгоритм, работающий на любом графике. Все зоны создаются динамически в соответствии с ценовым действием рынка.
ДВА ТИПА СИГНАЛОВ --> 1) ПРИ ПОПАДАНИИ ЦЕНЫ В ЗОНУ 2) ПРИ ФОРМИРОВАНИИ НОВОЙ ЗОНЫ
Вы не получите еще один бесполезный индикатор. Вы получаете полную торговую стратегию с проверенными результатами.
Новые особенности:
Оповещения, когда цена достигает зоны спроса/предложения

This indicator, It can be applied to any financial assets: forex, cryptocurrencies, metals, stocks, indices . And This indicator base on Golden cross with custom length signal
Settings
FastSignalLength : Length of Fast Signal SlowSignalLength : Length of Slow Signal TimeFrame : Choose time frame to calculate ShowDeadCrossOnly : Show Dead Cross Channel Only ShowSignalMedianOnly : Show signal median line only when ShowDeadCrossOnly set to false alertOn : Send alert alertsOnCurrent : Alert

Pivots Points are significant levels traders can use to determine directional movement, support and resistance. Pivot Points use the prior period's high, low and close to formulate future support and resistance. In this regard, Pivot Points are predictive and leading indicators. Pivot Points were originally used by floor traders to set key levels. Floor traders are the original day traders. They deal in a very fast moving environment with a short-term focus. At the beginning of the trading day,

KDJ Index 4 交易实用必备工具指标 波浪自动计算指标,通道趋势交易 完美的趋势-波浪自动计算通道计算 , MT4版本 完美的趋势-波浪自动计算通道计算 , MT5版本 本地跟单复制交易 Easy And Fast Copy , MT4版本 Easy And Fast Copy , MT5版本 本地跟单复制交易 模拟试用 Easy And Fast Copy , MT4 模拟账号运行 Easy And Fast Copy , MT5 模拟账号运行 "Cooperative QQ:556024 " "Cooperation wechat:556024" "Cooperative email:556024@qq.com" 强烈推荐趋势指标, 波浪的标准自动计算 和 波浪的标准自动计算MT5版本
KDJ指标又叫 随机指标 ,是一种相当新颖、实用的技术分析指标,它起先用于期货市场的分析,后被广泛用于股市的中短期趋势分析,是期货和股票市场上最常用的技术分析工具。 随机指标KDJ一般是用于股票分析的统计体系,根据统计学原理,通过一个特定的周期(常为9日、9周等

Получите сигнал о следующем разворотном движении | Оптимизируйте статистику коэффициента усиления | Получить зоны, которые цена будет тестировать | Индикатор без перерисовки и задержек - идеально подходит для ручной и автоматической торговли - подходит для всех активов и всех временных единиц $ 69 на старте - затем снова $149 После покупки пожалуйста, свяжитесь с моим каналом для получения рекомендуемых настроек Версия МТ4 | Получите наш полный метод с TrendDECO

Профессиональный инструмент лучших биржевых трейдеров теперь доступен и на платформе MetaTrader 5 . Индикатор Actual depth of market chart визуализирует стакан биржевых заявок в виде гистограммы, помещенной на график цены и обновляющейся в реальном времени. Внимание! Свежее обновление сделано по просьбе наших пользователей!
Теперь индикатор Actual Depth of Market отображает текущее соотношение объемов заявок на покупку и продажу (B/S ratio). Показывается доля объема заявок каждого вида в общем

Тиковые графики показывают количество сделок на каждом баре. Например, если на вашем графике 233 тика, каждому бару соответствуют 233 сделки. После 233 сделок отрисовывается новый бар. Вы можете выбрать любое количество тиков за бар, но большинство трейдеров выбирают числа Фибоначчи (1, 2, 3, 5, 8, 13, 21, 34, 55, 89, 144, 233...). Индикатор использует тиковые данные для настройки, а реальные тики - для построения текущего графика. Данный метод расчета позволяет создавать очень точные графики бе

The Nadaraya Watson Envelop indicator for MT5 is a popular tool used by traders to identify trends and potential buy/sell signals. The indicator is based on a non-parametric regression model that uses kernel smoothing to estimate the underlying trend of the market. The resulting envelopes are then plotted around the trend line, providing traders with an indication of where prices are likely to fluctuate. One of the key features of this indicator is its ability to send alerts, emails, and notific

ENG-GOLD Scalper It is an auxiliary indicator that identifies potential targets and determines the place of entry with a stop loss that works on Heiken Ashi candles
The green lines are usually the targets, the red lines are the stop loss, and the yellow lines are the entry location.
This file is recognized on small and medium frames, usually less than the watch frame
I highly recommend using XAUUSD US100 US30 USOIL

Рынок несправедлив, хотя бы потому, что всего лишь 10% игроков управляют 90% капитала. У рядового трейдера мало шансов, чтобы противостоять этим «хищникам». Но выход есть, необходимо всего лишь перейти на другую сторону, необходимо находиться в числе этих 10% «акул», научиться распознавать их намерения и двигаться вместе с ними. Объем - это единственный опережающий фактор, который безупречно работает на любом периоде и любом торговом инструменте. Сначала зарождается и накапливается объем, и толь

Pinbar Outside Pattern indicator shows in a table symbol, time frame and direction of the last price candle if it matches outside pinbar input parameters. Outside pinbar means that the candle is extreme in the chosen time frame. By clicking ' Open chart ' button you can view drawn pattern. You can choose to scan through all the symbols in Market Watch or enter your favorite symbols, and also you can enter time frames you need to scan. ---------Main settings-------- Select all symbols from Market

Dark Support Resistance is an Indicator for intraday trading. This Indicator is programmed to identify Support and Resistance Lines , providing a high level of accuracy and reliability.
Key benefits
Easily visible lines Only the most important levels will be displayed Automated adjustment for each timeframe and instrument Easy to use even for beginners Never repaints, never backpaints, Not Lag 100% compatible with Expert Advisor development All types of alerts available: Pop-up, Email, Pus

After working during many months, with the help of Neural Networks, we have perfected the ultimate tool you are going to need for identifying key price levels (Supports and Resistances) and Supply and Demand zones. Perfectly suitable to trigger your trades, set up your future actions, decide your Take Profit and Stop Loss levels, and confirm the market direction. Price will always move between those levels, bouncing or breaking; from one zone to another, all the remaining movements are just mark

У вас действительно хороший индикатор... но вы хотели бы, чтобы у него были оповещения? Считаете ли вы утомительным внимательное изучение индикатора, чтобы увидеть, дал ли он вам сигнал? ... Тогда этот индикатор может быть для вас!
Universal Alerts анализирует один из ваших графических индикаторов и выдает оповещения, когда они подают сигнал в соответствии с вашими параметрами. После настройки этого индикатора значок будет отображаться каждый раз, когда будет сигнал на покупку/продажу, а любые

Advanced Stochastic Scalper MT5 - это профессиональный индикатор на базе известного индикатора Stochastic Oscillator. Advanced Stochastic Scalper представляет из себя осциллятор с динамическими уровнями перекупленности и перепроданности, у стандартного Stochastic Oscillator эти уровни статические и никогда не изменяются. Это позволяет Advanced Stochastic Scalper адаптироваться под постоянно меняющийся рынок. При появлении сигнала на покупку или продажу на графике рисуется стрелка и появляется ал

Critical Zones был создан специально для ручных трейдеров, которые ищут более точные входы в рынок. Этот индикатор использует передовые алгоритмы для обнаружения зон интереса, вычисляя наиболее значимые поддержки и сопротивления на графике, а также их прорывы и ретесты. Индикатор может быть настроен на отправку предупреждений и уведомлений при обнаружении потенциально выгодных возможностей для покупки/продажи, что позволяет трейдерам оставаться в курсе торговых возможностей, даже когда они не

Это версия MT5.
Получить MT4 версия здесь → https://www.mql5.com/en/market/product/52923
В третьем скриншоте (Daylight Mode) я отметил 7 элементов, которые мы собираемся объяснять шаг за шагом.
1 Три кнопки.
а) Ночной режим
б) Дневной режим
в) Шкала исправления / Скорректированная шкала
2 Четыре кнопки.
а) Нарисуйте стрелку покупки, линию покупки и соответствующую стоп-лосс на основе ATR.
б) Закрыть ранее нарисованные купить и сонливость чековой отметки.
в) Нар

Very powerful indicator! converted from TradingView with upgraded alerts and added notifications. Ideal use in EAs.
Use as a supplementary Indicator to confirm your entries, but it is as good on it's own.
The indicator consists of 3 different Trend Meters and a 2 Trend Bars which are used to confirm trend
How to Use:
The more Trend meters are lit up the better =>>
-more GREEN COLOR at one bar means more confirmation to open buy trade,
- more RED COLOR signals for one bar = more

BeST_Darvas Boxes is a Metatrader Indicator based on the trading method developed in the 50’s by the Hungarian Nicolas Darvas . BeST_Darvas Boxes indicator draws the Top and the Bottom of every Darvas Box that can be confirmed on the current Chart draws Buy and Sell Arrows for every confirmed Upwards or Downwards Breakout of the above levels draws always only after the bar closing and so is non-repainting or backpainting it can be used as a standalone trading system/method
Inputs
Basic Sett

The Key level wedge MT5 indicator automatically draws rising wedge pattern and falling wedge pattern for you on the chart. This pattern is really good when used as a confirmation entry at key support & resistance, supply & demand and reversal zones.
Advantages
The Key level wedge MT5 block DOES NOT RE-PAINT, giving you confidence when a signal appears and also helps when looking back. The Key level wedge MT5 includes an on/off button on the chart to easily keep the charts cle

Индикатор VR ATR Pro – это мощный профессиональный инструмент для определения целевых уровней на финансовом инструменте. Эффективность индикатора доказана тысячами тестов на реальных и демонстрационных счетах. VR ATR Pro индикатор, работающий на реальных данных с использованием живой настоящей статистики. Статистика вещь упрямая, использование реальных статистических данных в математических подсчетах позволяет рассчитать точные целевые уровни для финансового инструмента. Больше профессиональных

To get access to MT4 version please click here . This is the exact conversion from TradingView: "ZLSMA - Zero Lag LSMA" by "veryfid". This is a light-load processing indicator. This is a non-repaint indicator. Buffers are available for processing in EAs. All input fields are available. You can message in private chat for further changes you need. Thanks for downloading

To get access to MT4 version please click here . This is the exact conversion from TradingView: "SwingArm ATR Trend Indicator" by " vsnfnd ". Also known as : "Blackflag FTS" by "Jose Azcarate" This is a light-load processing and non-repaint indicator. All input options are available except multi time frame. Buffers are available for processing in EAs. Extra option to show buy and sell signal alerts. You can message in private chat for further changes you need.

Индикатор Price Action Finder это индикатор точек входа, который предназначен для поиска и отображения паттернов системы Price Action на графике цены. Индикатор оснащён системой трендовых фильтров, а также системой алертов и пуш уведомлений. Инструкция/Мануал ( Обязательно читайте перед приобретением ) | Версия для МТ4 Преимущества
1. Паттерны: Пин бар, Внешний бар, Внутренний бар, PPR, Бар силы, Повешенный, Перевёрнутый молот
2. Система фильтрации паттернов. Убирает с графика контртрендовые п
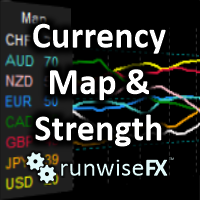
The first currency based indicator to draw a distinction between map and strength. The map shows the currencies in terms of oversold/overbought levels and gives the direction of travel. The currency strength calculates and shows the strength of that move. Alerts are included for changes in currency direction on the map (confirmed over two bars) and also when the strength reached the appropriate level. The currency map is useful for finding currency pairs to trade and in which direction. Look fo

Мультивалютный и мультитаймфреймовый индикатор Bollinger Bands. На панели вы можете видеть прорывы и касания (ценой) линий Боллинджера. В параметрах можете указать любые желаемые валюты и таймфреймы. Также индикатор может отправлять уведомления при касании Полос Боллинджера. По клику на ячейке будет открыт данный символ и период.
Параметры Настройки Bollinger Bands Averaging period — период усреднения для вычисления индикатора. Standard deviations — количество стандартных отклонений от основ
MetaTrader Маркет - единственный магазин, где можно скачать демоверсию торгового робота и подвергнуть его проверке и даже оптимизации на исторических данных.
Прочитайте описание и отзывы других покупателей на заинтересовавший вас продукт, скачайте его прямо в терминал и узнайте, как протестировать торгового робота перед покупкой. Только у нас вы можете получить представление о программе, не заплатив за неё.
Вы упускаете торговые возможности:
- Бесплатные приложения для трейдинга
- 8 000+ сигналов для копирования
- Экономические новости для анализа финансовых рынков
Регистрация
Вход
Если у вас нет учетной записи, зарегистрируйтесь
Для авторизации и пользования сайтом MQL5.com необходимо разрешить использование файлов Сookie.
Пожалуйста, включите в вашем браузере данную настройку, иначе вы не сможете авторизоваться.