适用于MetaTrader 5的付费技术指标 - 42

Before installing the HeatMap indicator make sure you are using a broker that gives you access to the Depth of market (DOM) !!
This indicator creates a heatmap on your chart allowing you to see the buy or sell limit orders easily and in real time. You have the possibility to change the setting and the colors of the HeatMap in order to adapt to all markets and all charts. Here is an example of a setting you can use with the NASDAQ100 on the AMPGlobal broker : https://www.youtube.com/watch?v=x0Y

Informações Importantes sobre o CryptoHacker (Não repinta! Não gera sinais atrasados!)
Se você está procurando um indicador que cumpre aquilo que promete, você acabou de encontrar! O CryptoHacker irá superar todas as suas expectativas com certeza! E o melhor de tudo, é só colocar na sua conta, ligar e já começar a lucrar!
O CryptoHacker é um sistema profissional de trade criado para as plataformas MT4 & MT5 e otimizado para trabalhar com CryptoMoedas.
Nosso sistema utiliza uma poderosa lógic

DYJ ChameleonTrend基于趋势跟踪和反趋势系统工作。 DYJ ChameleonTrend是一种高概率指标。该指标使用独特的混合指标,将复杂的指标与用户的判断力相结合。 该指标是一种最先进的Ma交叉和ATR和方差算法。 该指示器显示两个彩色方向箭头和趋势滚动球,指示交易者的最佳进入和退出位置。
参数
InpPeriod=50--指标周期 InpPrice=指标价格方法有7种:1.收盘价格 方法 ,2.开盘价格 方法 . 3. 最高价格 方法 , 4. 最低价格 方法 , 5.中间价格 方法 , 6. 典型价格 方法 ,7. 加权方法 InpAtrDevPeriod = 5 —— 标准偏差指标或者ATR指标周期 InpUseWhat = 使用atr计算方法

Всем привет. Представляю Вашему вниманию Индикатор TRUE ATR. Так же есть данный индикатор для mt4 https://www.mql5.com/ru/market/product/82414 Данный индикатор работает на всех рынках. TRUE ATR высчитывает среднестатистическое движение инструмента за 1 день и показывает сколько в инструменте осталось энергии внутри дня. В отличие от классического индикатора АТР которые без разбора учитывает все бары(свечи), TRUE ATR при расчете среднестатистического движения инструмента использует ближайших 5

The Market Entropy indicator was created to measure the order of price changes over time. consists of two lines and a histogram where the lines are responsible for measuring the price movement and the histogram measures the strength of the analyzed movement. It can be used to find a trend (Image 2) or price reversal (Image 3).
Blue Line: Buy Entropy Red Line: Sell Entropy Historgram: Market Entropy
Interpretation: Buy Line above the Sell Line indicates that in the analyzed period buyers were

使用 WolfeWaveBuilder 指标加入交易! 这是专门为获得最成功和最有利可图的投资决策而创建的独特工具。 它是真实账户的理想选择,并受益于经过全面测试和几乎有保证的交易策略。 不要错过你的机会! 开始使用 WolfeWaveBuilder 指标赚钱交易!
MT5版本 https://www.mql5.com/ru/market/product/8920
指标特点
为 Wolfe Waves 策略提供信号。 显示趋势。 自 1980 年以来一直使用的行之有效的策略! 简单的进入信号。 不重绘也不滞后。 有声音信号,E-Mail 和电话上的通知。
操作说明
等到箭头出现,终端中出现消息或通知邮件,电话。 你打开一个交易。 建议在价格越过 1-4 线时出场。 为了更好地理解策略,建议阅读理论。
基本设置
High_period - 用于计算高周期模型的最小柱数 Low_period - 用于计算低周期模型的最小柱数 Trigger_Sens - 计算分形的最小柱数

Informações Importantes sobre o ArrowHacker (Não repinta! Não gera sinais atrasados!)
Se você está procurando um indicador que cumpre aquilo que promete, você acabou de encontrar! O ArrowHacker irá superar todas as suas expectativas com certeza! E o melhor de tudo, é só colocar na sua conta, ligar e já começar a lucrar!
O ArrowHacker é um sistema profissional de trade criado para as plataformas MT4 & MT5 e otimizado para trabalhar com qualquer ativo na plataforma MetaTrader 5, sejam moedas, m

ImbaTrend Runner - is the trend following manual system for forex/crypto market. It defines medium-term trends and works with it in intraday mode. System shows enter points, profit and loss targets. As a rule profit targets are 2-3 X bigger than loss targets. Indicator is AutoAdaptive and it automatically updates it's settings during trading. Indicator is sensitive to market changes, regular updates helps to stay in relevant trend. Main Indicator's Features Signals are not repaint, late or disap
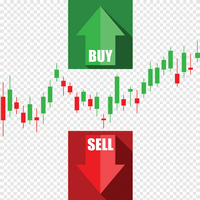
该指标使用价格序列的局部高点和低点。突出极值后,对它们的值进行平滑处理。因此,建立了两个通道 - 外部和内部。如果价格走势严格遵循线性趋势,则内部通道显示限制。外部通道以对数趋势显示价格变动的边界。 在计算通道后,该指标分析实际价格走势并提供开仓和平仓建议。蓝点 - 建立买入头寸,红色点 - 建立卖出头寸。相应的交叉盘建议关闭某些头寸,如果有的话。应该记住,并非所有信号都具有相同的强度和准确性。在某些情况下,正确方向的价格变动会很快结束,因此不可能获得大笔利润。在某些情况下,信号会导致损失(最后一张图片显示了此类信号的示例)。鉴于这些特点,我们可以推荐以下方法 - 使用浮动止盈,其值可以根据当前市场情况进行更改。还需要选择一个止损值,以便在出现关闭它们的信号之前关闭无利可图的头寸。 指标设置使用以下参数进行: iChannel - 调整通道的宽度。狭窄的通道会提供更多的信号,但也会增加误报的风险。 iSignal - 允许您配置信号的显示。默认情况下,仅显示最佳进入和退出信号。 iPeriod - 指标周期。该参数越大,通道宽度越大。因此,它也会影响信号的数量。 iFac

Divergence and Convergence are important harbingers of reversals in stock markets.
The Divergence Sync indicator is designed to automatically search for divergences on a large number of indicators with different parameters.
The search for divergences is carried out on these indicators: (CCI, CHO, DeMarker, MACD, MFI, Momentum, OBV, OsMA, RSI, Stochastic, WPR, Awesome Oscillator ).
To search for divergences, you can use one technical indicator or search simultaneously on any number of indicat

Market Conditions indicators can provide support to the trader so that he can identify market trends over a given period. The purpose of this model is to allow traders to have a global vision on the exchange markets. And the formula that we develop allow to scan the major currencies in the exchange market. The model uses a purely statistical formula which is based on the historical data of the major currencies "eur, usd, gbp, jpy, aud, nzd, cad, chd". Of which 28 currency pairs are traded. It

ROC 价格直方图警报是一种基于动量的技术指标,用于衡量当前价格与一定时期前价格之间的价格百分比变化。 ROC 以直方图对零绘制,如果价格变化向上,则指标向上移动到正区域,如果价格变化向下,则指标移动到负区域。
计算 ROC 周期的主要步骤是“计算周期”输入设置。短线交易者可能会选择一个较小的值,例如 9 或 12。长期投资者可能会选择更高的值,例如 200。“计算期”是与当前价格相比的多少个时期。较小的值将使 ROC 对价格变化的反应更快,但这也可能意味着更多的错误信号。较大的值意味着 ROC 反应较慢,但信号在出现时可能更有意义。 这种技术指标既有积极的一面,也有消极的一面
积极的 ROC 价格振荡器是技术分析中使用的无界动量指标,以零水平中点为基准 ROC 上升高于零通常确认上升趋势,而 ROC 下降低于零则表明下降趋势 五种警报类型,包括视觉买卖箭头 任何品种和时间框架 消极的 当价格整合时,ROC 将徘徊在零附近。在这种情况下,观察整体价格趋势很重要,因为 ROC 除了确认整合之外几乎不会提供任何洞察力。 指标菜单类别 主要配置 - ROC 计算周期/警报设置 - 应用
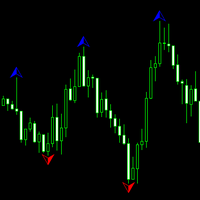
An indicator for all timeframes with a configurable number of bars for calculating fractals. Suitable for determining extremes of both lower and higher order, by which it is possible to determine the patterns of technical analysis, as well as divergences.
The indicator has one adjustable parameter - the number of bars for extremum calculation. It is also possible to change the color characteristics.
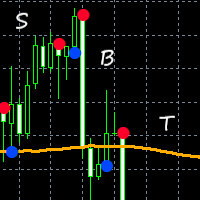
This indicator combines input from two trend filters and the ADX. You can change the trend line on chart to your preference. Great for scalping and channels. Features alert function and parameter TrendLinePeriod.
How to use: Simply attach to any chart. Sell on red bullets, with trend line above price. Enter on bullets closest to this line. Buy on blue bullets, with trend line below price. Enter on bullets closest to this line. Best results when checking the higher time frames before entering tr

The idea behind this indicator is very simple , First it contains 2 mechanisms to place your trades:
1- Enter the Pips you want to duplicate to price levels. 2- Automatically let the indicator specify the largest Buy / Sell Volume Candle and place duplicated levels based on the candle itself.
How it works: 1- Enter the Pips you want to duplicate to price levels: 1- once the indicator is loaded you will need first to Specify the number of pips in the indicator Configuration window ,you can g
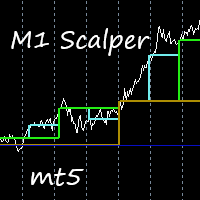
This indicator is excellent for scalping on the M1 or M5 chart. Uses a special algorithm for the lines. No need to set up the indicator. Does not feature any alerts and is best used manually after visually confirming the line displays. NB: Make sure to download M1 history before testing and use.
How to use: Simply attach to M1 or M5 chart. Zoom chart out completely. Sell when all lines above the white line (PriceLine). Sniper line crosses above white line. Buy when all lines below the white lin

The Price Elevator indicator is developed to help you figure out the general long-term trend of the market. If the price is above the Green separator line, this is a clear indication the bulls are in control. Similarly, the bears are in control if the price continues to trend below the red separator line. Download Price Elevator MT4
Trend Re-entry In this case you would plan your buy entries above the green dotted box (make sure to set the Buy / Sell Retracement Floor=30). The SL should be

The WAPV ADH Supply and Demand indicator is part of a set of indicators called (Wyckoff Academy Wave Market)
The WAPV ADH Supply and Demand indicator for MT5 is intended to identify the winning side between buyers and sellers.
Its reading is very simple, when the green line is above the red line the demand is in charge, when the red line is above the green line the supply is in charge.
The more positive the green and red lines, the greater the volume input, the closer to zero or negative, th

The WAPV ADH Supply and Demand Forex Indicator is part of a set of Indicators called (Wyckoff Academy Wave Market) The WAPV ADH Forex Supply and Demand Indicator for MT5 is intended to identify the winning side between buyers and sellers. Its reading is very simple, when the green line is above the red line demand is in command, when the red line is above the green line supply is in command. The more positive the green and red lines, the higher the volume input, the closer to zero or negative, t

WA_PV_BOX_EFFORT X MT5 的结果 WAPV Box Effort x Result Indicator 是 Package Indicators 组(Wyckoff Academy Wave Market)的一部分。 MT5 的 WAPV Box Effort x Result Indicator 可帮助您阅读价格和交易量。它的阅读包括协助识别努力x结果 在图表创建的波浪中。 当方框为绿色时,MT5 的 WAPV Box Effort x Result Indicator 表示交易量有利于需求,而当方框为红色时 量有利于供应。 方框越大,成交量相对于价格的位移越大。如果价格的上升波与 Box 的大小不成比例,则 努力x结果。 以一种非常直观的方式,我们可以识别出数量和价格之间的这种差异。 MT5 的 WAPV Box Effort x Result Indicator 还允许您通过将指标置于零轴下方来改善可视化。 以即时交易量和实际交易量在市场上运作 看图片:

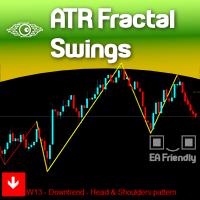
The concept of Fractals is everywhere in the respected Technical Analysis teaching and for a good reason: It Makes Sense! It is not a "self-fulfilling prophecy" like Fibonacci levels which we totally respect but we didn't explore yet, but this concept of Fractals can only be seen visually on your chart if we really SHOW that to you on your chart, right?
There are dozens of Zig-zag and Swing Legs indicators out there so you probably would be wondering: Why our indicator is different? Because we a

The Weis Wave Bouble Side Indicator for MT5 is part of the toolkit (Wyckoff Academy Wave Market) The Weis Wave Bouble side Indicator for MT5 was created based on the already established Weis Wave created by David Weis. The Weis Wave Double Side indicator reads the market in waves as it was done by R. Wyckoff in 1900. It helps in the identification of effort x result, cause and effect, and Supply and demand Its differential is that it can be used below the zero axis, further improving plus operat

The Weis Wave Bouble Side Indicator for MT5 is part of the toolkit (Wyckoff Academy Wave Market) The Weis Wave Bouble side Indicator for MT5 was created based on the already established Weis Wave created by David Weis. The Weis Wave Double Side indicator reads the market in waves as R. Wyckoff did in 1900. It helps in the identification of effort x result, cause and effect, and Supply and demand Its differential is that it can be used below the zero axis and has a breakout alert showing Who is s

The VSA Candle Signal for MT5 is part of the toolset (Wyckoff Academy Price and Volume). Its function is to identify the correlation of Price and Volume in the formation of the candle. Its creation is based on the premises of R.Wyckoff , a precursor in the analysis of Price and Volume. VSA Candle Signal for MT5 assists in decision making, leaving your reading clearer and more fluid. See the images below.

The Force and Weakness Indicator for MT5 Forex is part of the (Wyckoff Academy Price and Volume) Toolkit The Force and Weakness Indicator for MT5 Forex was developed to identify the Strength and Weakness of volume in an accumulated way. Enabling the vision of a panorama between price and volume. The Indicator can be used as an oscillator and as a histogram. As usual it has all the premises of R. Wyckoff's three laws when put together with the price: Cause and Effect, Effort x Result and Supply a

The Force and Weakness Indicator for MT5 Real Volume is part of the (Wyckoff Academy Price and Volume) toolset The Force and Weakness Indicator for MT5 Real Volume was developed to identify the Strength and Weakness of volume in an accumulated way. Enabling the vision of a panorama between price and volume. The Indicator can be used as an oscillator and as a histogram. As a fantasy it has all the premises of R. Wyckoff's three laws when put together with the price: Cause and Effect, Effort x Res
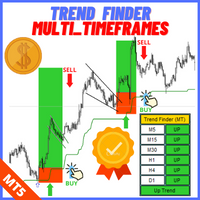
Description: The "Trend Finder Multi Time Frames multi pairs" indicator is a new technical analysis tool designed to assist traders in identifying and confirming trends across multiple timeframes and multiple pairs at the same time. By combining the strengths of various timeframes, this indicator offers a comprehensive view of the market's direction, helping traders make more informed decisions. Features: Multi-Timeframe Analysis: The indicator analyzes trends on different timeframes (e.g., M1
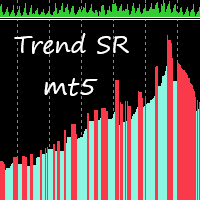
This indicator takes input from Support and Resistance levels, combined with a special trend filter. Easily spot tops and bottoms, and trade with more confidence. Great for scalping. This indicator can be used on all time frames and pairs. Features alert function.
No need to set up the indicator.
How to use: Simply attach to any chart. Zoom chart out completely. Red histogram line color = Selling opportunities. Blue histogram line color = Buying opportunities. See pictures below. To spot highs/
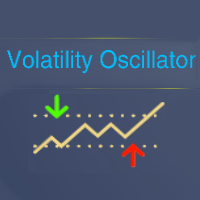
Tool converted from tradingview indicator. Modified version with pivot points calculated in a more intuitive way.
This tool displays relative volatility and directional trend. Excellent way to pickup diversions and reversals. Length can be lowered to 11 or 13 in settings to show price range.
Can be used to identify patterns such as parallel channels and likely direction of price action.

该指标使用所谓的“邪恶”数字作为权重系数。它们的对立面是“可憎”的数字,也出现在该指标中。将数字划分为这两类与汉明权重有关,汉明权重由特定数字的二进制表示法中的单位数确定。 使用这些数字作为加权因子会产生趋势跟踪指标。此外,可恶的数字给出了更敏感的指标,而邪恶的数字给出了保守的指标。它们之间的差异不是很大,只有在市场价格剧烈波动时才能注意到。使用该指标可以帮助确定新趋势的开始。这使得可以更准确地确定开仓时刻。 指标参数: Type numbers - 选择数字类型,Evil 或 Odious; iPeriod - 指标周期。指标的灵敏度取决于此参数。它越小,对价格变化和市场趋势变化的敏感度越高。 图中显示了指标操作的示例。
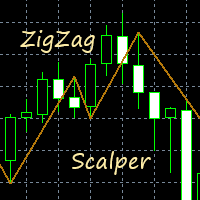
This indicator gives you a modified ZigZag, combined with a trend filter. Great for scalping. Perfect for channel trading. Features alert functions. No need to set up the indicator. How to use: Simply attach to any chart. Buy when the golden line stops below the price. Sell when the golden line stops above the price. It also helps to keep the audible alert set to true. Best results when checking two or more timeframes before entering trades on the lower time frames. Use as you see fit for your

本指标的目的是识别反转点. 蓝色箭头是做多信号,它对应的黄色星是止损. 红色箭头是多空信号,它对应的黄色星是止损.
报警功能: 如果产生了信号,指标会发送三种报警:弹窗,邮件,或者手机推送 Inputs: Popup Window Alert: 弹窗报警,默认是关闭的 Email Alert : 邮件报警,默认是关闭的 Mobile Push Alert: 手机推送报警,默认是关闭的. MetaTrader 4 Version : Reversal Point 请注意,这个信号是逆势的,可能会连续失败. 请注意,这个信号是逆势的,可能会连续失败. 请注意,这个信号是逆势的,可能会连续失败. 请注意,这个信号是逆势的,可能会连续失败. 请注意,这个信号是逆势的,可能会连续失败. 请注意,这个信号是逆势的,可能会连续失败.
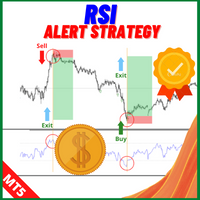
Description: For a comprehensive understanding of our indicators, we invite you to explore the entire Q&A section within this MQL5 blog post here . The RSI Cross Alert Indicator is a powerful technical analysis tool designed to assist traders in identifying potential trend reversals and generating timely buy or sell signals. This user-friendly indicator is suitable for both novice and experienced traders, providing valuable insights into market trends and price movements. Key Features: - RSI

ADX 指标(平均方向指数)是一种旨在衡量市场趋势强度的技术工具。 ADX 指标用于各种目的,例如测量趋势强度、寻找趋势和交易范围,以及作为各种外汇交易策略的过滤器。
一些最好的交易策略是基于跟随市场趋势。还有一些策略可以让交易者通过逆势交易来获利。无论如何,如果你能及时发现新出现的趋势,你赚钱的机会就会明显增加。
对于交易者来说,好消息是现代交易软件会自动为您进行这些计算。 在这种情况下,您无需单独下载 ADX 指标:ADX 会自动包含在平台指标列表中
如您所知,ADX 指标用于确定市场是否呈趋势。 但是你怎么知道趋势何时发生? 因此,ADX 的范围从 0 到 100。Wilder 认为高于 25 的值表明市场存在趋势,而低于 20 的值表明趋势较弱或根本没有趋势。 出于这个原因,许多现代技术分析师认为 25 的值是市场中“趋势”和“无趋势”之间的关键点。
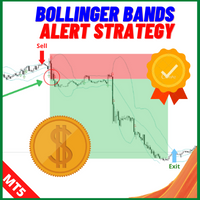
Description: For a comprehensive understanding of our indicators, we invite you to explore the entire Q&A section within this MQL5 blog post here . The Bollinger Bands Cross Alert Indicator is a versatile tool in the world of technical analysis, designed to assist traders in identifying potential trend reversals and significant price movements. This powerful indicator is based on Bollinger Bands, a popular volatility indicator, and offers real-time alerts for accurate and timely trading deci
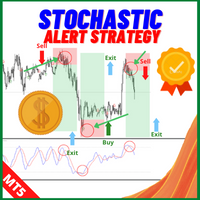
Description: For a comprehensive understanding of our indicators, we invite you to explore the entire Q&A section within this MQL5 blog post here . The Stochastic Cross Alert Indicator is a valuable technical analysis tool that helps traders with better signals for identifying potential trend reversals and momentum shifts. Designed to work seamlessly on various financial instruments, this indicator provides real-time alerts and customizable parameters, making it a versatile addition to your t
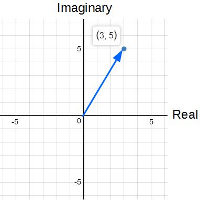
ComplexVector is an indicator based on market analysis using the mathematical apparatus of complex numbers. The essence of the indicator is that it, with clear impulses, indicates the points in time when it is necessary to make decisions. The impulses are like a cardiogram showing the heartbeat of the market.
For example: it may be the moment of planning a new entry. this may be the moment to exit the position. if you work with a series that is in a drawdown, you are recommended to close it in
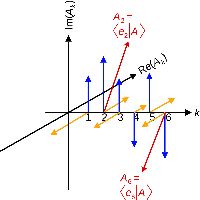
ComplexVectorHL is an indicator that characterizes the change in short-term market trends. The indicator is based on market analysis using the mathematical apparatus of complex numbers. The essence of the indicator is that it, with clear impulses, indicates the points in time when it is necessary to make decisions. The impulses are like a cardiogram showing the heartbeat of the market. The indicator has pulses only in one direction (unlike the previous development of ComplexVector), the pulses
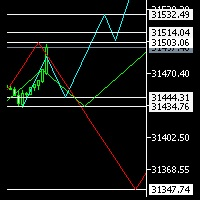
Hello Everyone ,
I am not an Elliot pro , but I promise to let you see it in a different way , have you ever considered to see 3 probabilities of different time frames on same chart ? this will not only enhance your trades entry , but will give you confidence and certainty when everything is not clear.
in my indicator you will be able to select 3 time frames of your choice , define number of candles per each time frame , give the color per each trend (Bearish or Bullish), not only that , you

Fundamentação teórica A VWAP é uma média móvel ajustada pelo volume, ou seja, o peso de cada preço corresponde ao volume de ações negociadas no período, dando mais importância ao período em que se tenha mais negociações. A Orion Vwap Bands permite que o usuário use plote 8 bandas que podem ser utilizadas como suportes e resistências para o preço. Cada banda é calculada a partir da Vwap Tradicional:
Ex.: Se escolhermos o valor 0.25 para a plotagem da Banda 1, pega-se o preço da Vwap e acrescent

AW 蜡烛形态指标是高级趋势指标与强大的蜡烛形态扫描仪的组合。它是识别和突出显示 30 个最可靠的烛台形态的有用工具。此外,它是一个基于彩色条的电流趋势分析器,带有 可调整大小和定位的插件多时间框架趋势面板。根据趋势过滤调整模式显示的独特能力。 优点: 轻松识别蜡烛形态 不重绘结果 内置多时间趋势面板 禁用模式类型(1、2、3 根蜡烛) 显示形态时趋势过滤的调整
显示模式列表: 锤模式 固定/固定 看跌 Harami / 看涨 Harami 看跌 Harami Cross / 看涨 Harami Cross 枢轴点反转向上/枢轴点反转向下 双柱低位收盘价较高/双柱低位收盘价较低 收盘价反转向上 / 收盘价反转向下 中性条 / 两个中性条 双内/内/外 向上推力杆/向下推力杆 晚星/晨星 晚上十字星 / 早上十字星 吞没看跌线/吞没看涨线 镜子酒吧 流星 乌云盖顶 十字星 输入变量: Main settings Trend Filtering Mode - Adjustment of trend filtering when displaying patterns Pat

Tape Reading, flow monitoring.
FabFlowInPrice is a powerful indicator for those who like Tape Reading (Times & Trades). It presents the volumes traded at each price level, considering the purchase, sale and direct aggressions for each level. Excellent tool for market flow analysis. Thought of flow so monitor who is attacking the most, buyers, sellers or direct exchanges, thought FabFlowInPrice. The indicator displays information in 4 distinct and fixed periods, on any timeframe: @Day - All t

该指标通过计算 RSI 超买/超卖区域上方和下方移动的柱数来显示市场的多头/空头趋势。绿色柱状图表示多头力量,而红色柱状图表示空头力量。
功能特点
可用于开启新交易,或验证来自其他策略或指标的交易信号。 配备多时间框架扫描仪,可扫描所有时间框架内的多头/空头力量。 是验证交易信号的完美工具,可增强新手交易者的信心。 包含所有 MetaTrader 4/5 预警功能。
输入参数 周期: 用于确定超买/超卖水平的 RSI 周期。 柱周期: 计算 RSI 超买/超卖区域上方/下方的柱数。 超卖水平: 用于确定 RSI 超卖水平的参数。 超买水平: 用于确定 RSI 超买水平的参数。 MTF 扫描仪: 多时间框架扫描仪,可从所有可用时间框架中获取信号。 预警设置
The indicator measures the buying and selling force between the buyers and sellers in the form of a histogram/oscillator by using a BOP equation:
BOP = Moving Average of [close – open)/(high – low)]
Igor Levshin first introduced the Balance of power in the August 2001 issue of Technical Analysis of Stocks & Commodities magazine.
Features
Quickly find the buying and selling pressure among the traders. It comes with simple inputs and an interface. All Metatrader alerts included.
Applications
SSL stands for Semaphore Signal Level channel. It consists of two moving averages applied to high and low, respectively, to form a price following envelope. Buy Signal: When the price closes above the higher moving average. Sell Signal: When the price closes below the lower moving average.
Features It comes with a multi-timeframe scanner that scans for the new signals across all the timeframes. A straightforward personal implementation of the classic SSL effortlessly finds the trend direction.

Back to the Future это индикатор который определяет направление тренда. Определяет четыре уровня для роста и падения 1-й уровень флета 2 -й уровень коррекции 3-й уровень продолжения тренда и 4-й уровень возможного разворота. Индикатор рисует трендовые линии краткострочного и долгострочного тренда. Так же индикатор определяет динамические сел и бай зоны в виде прямоугольников. От ближайшего максимума или минимума рисует фибо уровни для определения целей движения. В меню индикатора отключа

该指标基于椭圆形。这种形状用于空气动力学和空间技术。甚至子弹也有某种椭圆形。 在技术指标中使用这种形式可以在指标的灵敏度和稳定性之间实现折衷。这为其应用提供了额外的可能性。 指标参数: iType - ogive 表单的类型。 iPeriod - 指标周期。 iFactor 是用于抛物线和指数形式的附加参数。有效值为 0 - 255。如果 iFactor = 0,则指标退化为简单移动平均线。 iChannel - 一个允许您建立价格变动的上下通道的参数。有效值为-128到127。如果值为正,则绘制上通道,如果值为负,则绘制下通道。 通过组合这些参数,可以获得不同的结果。该指标可用于跟踪市场中的趋势价格变动。通过建立渠道,您可以获得价格可以移动的最近目标。通道边界值可以作为止盈止损。使用 iFactor,您可以实现金融时间序列所需的平滑程度。

place a vwap line starting from the line placed on the chart parameters: tick_mode: enable to use ticks instead of bars. this uses a lot more cpu processing power prefix: prefix to add for line created by indicator line_color: set the color of the line created line_style: set the line style of the line created applied_price: set the price of bar to use of the bar std_dev_ratio: set the multiplier for the std dev channel
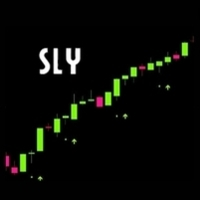
indicador para opciones binarias que siempre funciona en favor de la tendencia principal , por favor identifiquela en temporalidades altas para poder tomar operaciones en las temporalidades bajas , puede usar una media movil de cualquier periodo para identificarla , recomendada la de 50 periodos exponencial ideal para operar el mercado de indices sinteticos del broker deriv y/o divisas, se puede acompañar de cualquier oscilador usando unicamente el nivel 50 para validar tendencia alcista o baji

Indicator developed by the Brazilian and analyst Odir Aguiar (Didi), consists of "Moving Averages", famously known as "Didi needles", where it allows the viewing of reversal points.
The concept is very simple, when you enter 3 Moving Averages on display, a period equal to 3, one equal to 8 and the other equal to 20, then the formation of the indicator that works in axis or line center equal to 0 (zero) appears. ). Moving averages must intersect when approaching line 0.
The scanner monitors 10
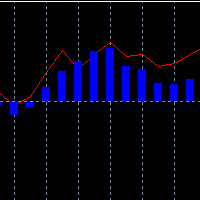
Klinger Volume Oscillator (KVO) - A Powerful Trend & Momentum Indicator This is an enhanced version of the Klinger Volume Oscillator (KVO) , a widely used indicator designed to help traders identify momentum shifts, trend direction, and overbought/oversold conditions in the market. How the KVO Indicator Works: Volume-Based Trend Identification – Unlike traditional oscillators that rely solely on price movements, the KVO uses both price and volume to detect market trends and momentum shifts .

HEIKEN PLUS is the only indicator you really need to be a successful trader , without in depth knowledge of the forex trading or any tools.
Also there is automatically trading EA available now: https://www.mql5.com/en/market/product/89517? with superb SL/TP management! and sky high profit targets !!!
Very suitable tool for new traders or advanced traders too. This is MT5 version. For MT4 version visit : https://www.mql5.com/en/market/product/85235?source=Site
HEIKEN+ is a combination of 2 i

This is the famous Sunflower indicator for Metatrader5. This indicator marks possible tops and bottoms on price charts. The indicator identifies tops and bottoms in the asset's price history, keep in mind that the current sunflower of the last candle repaints, as it is not possible to identify a top until the market reverses and it is also not possible to identify a bottom without the market stop falling and start rising. If you are looking for a professional programmer for Metatrader5, please

Volatility Vision: Essential for Forex and Stock Markets
发现Volatility Vision:您的交易革命 完美适合初学者和专业交易者 简单入门指南: 通过我们的 用户手册 ,学习如何有效使用它。
Volatility Vision 指标是一个强大的工具,可以在您的图表上精确描绘波动率水平。这个多功能工具是整合到您的交易策略中必不可少的,兼容所有货币对和股票市场。 利用 波动率阈值 ,自信地管理您在一周内的交易。 Volatility Vision的优势 增强准确性: 显著减少了常见于随机振荡器的误报。 早期信号: 比RSI更早捕捉交易信号,帮助您抓住错失的机会。 市场领先: 在MACD响应之前提供前瞻性见解。 可靠性: 避免了CCI常见的误信号陷阱。 轻松配置 输入ATR值以开始(默认值为15)。所有级别都是固定的,以保持一致的分析;切换时间框架以刷新数据。 指标指南 蓝线: 每日波动率。 红线: 每周波动率。 橙线: 每月波动率。 将Volatility Vision与传统的ATR结合使用,以获得更多战略机会。今天就增强

Do you like trade Technical Analysis like I do? Then you will like this indicator, because it automatically calculates the support and resistance of the asset in simultaneous timeframes, or the famous MTF (Multi Time Frame). In addition to support and resistance, it is possible to have alert signals when the price breaks or touches (or both). Its configuration is very simple. The visual is fully configurable. Enjoy it!

策略的基本原理 根据前一个交易日的收盘价、最高价和最低价数据通过一定方式计算出六个价位,从大到小依次为:突破买入价、观察卖出价、反转卖出价、反转买入、观察买入价、突破卖出价。以此来形成当前交易日盘中交易的触发条件。
追踪盘中价格走势,实时判断触发条件。具体条件如下: 突破 在空仓条件下,如果盘中价格超过突破买入价,则采取趋势策略,即在该点位开仓做多。 在空仓条件下,如果盘中价格跌破突破卖出价,则采取趋势策略,即在该点位开仓做空。 反转 持多单,当日内最高价超过观察卖出价后,盘中价格出现回落,且进一步跌破反转卖出价构成的支撑线时,采取反转策略,即在该点位反手做空。 持空单,当日内最低价低于观察买入价后,盘中价格出现反弹,且进一步超过反转买入价构成的阻力线时,采取反转策略,即在该点位反手做多。 设定止损条件。当亏损达到设定值后,平仓。 设定是否隔夜留仓。

!! FLASH SALE !! Over 80% off !! For ONE week only. Now only $47 - normally $297! >>> Ends on 30 June 2023 - Don't miss it!
Buy and Sell Arrows On The Chart According To Price Action Sends Alerts On MT5 To Your Phone To You Email
Does NOT repaint. Works on any pair, any timeframe.
10 Activations allowed so you are free from limitations. MT4 Version here . For spreads from a tiny 0.1 pips RAW/ECN Accounts, click here . Check out my Waka Esque EA signal here: >> High Risk Se

The indicator refers to the means of probabilistic analysis. Prediction is performed by the Monte Carlo method together with a mathematical model of a neuron. But, the modeling of samples for this method is made not artificially, but comes from the original "nature", that is, from history. The number of samples and the detail of their modeling is achieved using the lower (relative current) timeframe.
Indicator algorithm :
In general terms, the algorithm boils down to the fact that the indica


Un indicador bueno, fácil, legible y práctico. Da señales acotadas entre cero y uno. Fácil de comprender para los inversores. Brinda perspectivas comerciales cercanas y a más largo plazo a los inversores y los ayuda a encontrar buenas oportunidades. El indicador da una señal cero en las caídas de precios y el valor de la señal es igual a uno en las subidas de precios. Una vez más, un nuevo tipo de indicador y rango limitado entre cero y uno.

UR發散觀察儀
UR DivergenceSpotter 是多年經驗的結晶,有時最簡單的方法就是最好的。 一些指標之間存在良好的相關性,但當它們不匹配時 - 價格試圖“重新調整” - 正是在那個時刻我們通過 UR DivergenceSpotter 收到信號。
使用 UR Divergence Spotter 的優勢:
無參數 蠟燭創建後不重繪 當信號不再有效時發出信號(這意味著您可以持有更長時間的交易,將止損設置為 BE 並讓它運行,獲取部分利潤或完全關閉它!)。 該指標是多年經驗和觀察的結果。 它堅固且經過測試。 最好在更高的時間範圍 (h1/h4) 中使用以獲得更好的結果和更安全的信號。
另一種方法是將它與我的其他指標(如 UR TrendExhaustion 或 UR VolumeTrend)一起使用,以獲得更好的信號准確性。 有一個特殊的電報聊天,您可以在其中了解最新的工具更新,如果您覺得缺少什麼,也可以發送請求!
為什麼選擇 UR DivergenceSpotter?
如前所述 - 該指標是將體驗整合到一個指標中。 以某種方式對其進行編碼,以便每個人都可

UR 成交量趨勢
UR VolumeTrend 是顯示交易量持續趨勢的最清晰的交易量指標。 與 UR TrendExhaustion 等其他指標完美配合,以發出局部頂部和底部信號。
僅限於 2 個參數 - 值越高,顯示的趨勢越長。 梯度極端顯示成交量可能耗盡以捕捉潛在的逆轉。 兩條線 - 成交量趨勢和平均值。 最大優勢:簡單且可適應所有資產。 有一個特殊的電報聊天,您可以在其中了解最新的工具更新,如果您覺得缺少什麼,也可以發送請求!
為什麼選擇 UR VolumeTrend?
所有人都會同意,成交量是把握趨勢的關鍵。 這個震盪指標是我所有交易量工具的總和,壓縮成一個易於使用的指標。 它以易於查看的方式顯示正/負音量。 後面的界面顯示音量與過去相比是否可能會耗盡 - 或者它是否會推到新的水平。
如何使用 UR VolumeTrend?
請參閱下面的描述以更熟悉它:
設置 Volume Period:值越高,它會嘗試捕捉的趨勢越大 交易量趨勢:此附加行顯示僅基於交易量的潛在反轉條目 展示
漸變界面:顯示基於過去的極值水平。 成交量主線:顯示成交量是看漲*高於 0*
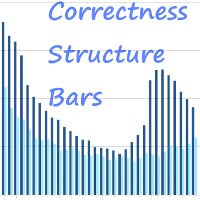
The Correctness Structure Bars indicator displays the bar structure in digital terms. How to Interpret the Information Provided by the Indicator It is very simple, all you have to do is analyze the chart. We will explain the work using an example, take the EURUSD instrument on the D1 timeframe, install this indicator and analyze the information provided by the indicator. The indicator works in the bottom of the chart and gives the result in the form of a histogram, that is, each bar (when a bar
The Correctness Complex Structure indicator displays the complex structure of the bar, taking into account tick volumes in digital terms. How to interpret the information provided by the indicator. It's very simple, it's enough to analyze the chart. We will explain the work using an example, take the EURUSD instrument on the D1 timeframe, install this indicator and analyze the information provided by the indicator. The indicator works in the bottom of the chart and gives the result in the form

Impulse Change is an indicator of impulses for decision making. The main task of this indicator is to warn the trader about the moment of price changes.
Do you often doubt when to make a decision? Leave the market or wait? This indicator is for you, Impulse Change will help you and provide a clearly defined correct hint.
There are always moments in history in which the behavior of the market differs sharply from what happens for the longest periods of time, such uncharacteristic behavior can

Impulse Creative is a more advanced indicator of impulses for making decisions (compared to the Impulse Change indicator). The main task of this indicator is to warn the trader about the moment of price changes and also to give a command to enter according to the current trend. To determine the trend, use any other tool, this development forms only an entry point but not the entry direction.
First, look at the screenshots and notice that we see clearly expressed figures that the indicator form
CalcFlat is a flat indicator.
At first glance, a simple indicator, but if you look at the screenshots for people who are not specialists, it may seem that the indicator is not very informative. But in fact, the indicator is very informationally active. It needs to be adjusted for each instrument and each timeframe. Very flexible in the settings there are two key settings, but they can significantly change the results of the display of the indicator. In addition to the main histogram, the indic
CalcFlat Creative is a flat indicator.
This is a more advanced version of the CalcFlat indicator. Three lines have been added for this indicator, which significantly improve the performance of the predecessor indicator. In addition to the two existing levels that the user reacted to and which were static, now the indicator has three dynamic lines on top of the main chart and interpreted as: signal line base, signal minimum, signal maximum.
These lines are formed due to the additional indicato

In the Apple is a stable indicator of exit points, no signal will change or redraw.
The indicator displays buy and sell signals with recommended markers for exiting a position. Each exit marker is accompanied by an information mark about the profit from the operation. The label consists of two parts. The first label displays the profit from the last operation in instrument points, and the second label displays the total balance. The total balance starts to be calculated from the moment when th
MetaTrader 市场 - 在您的交易程序端可以直接使用为交易者提供的自动交易和技术指标。
MQL5.community 支付系统 提供给MQL5.com 网站所有已注册用户用于MetaTrade服务方面的事务。您可以使用WebMoney,PayPal 或银行卡进行存取款。
您错过了交易机会:
- 免费交易应用程序
- 8,000+信号可供复制
- 探索金融市场的经济新闻
注册
登录