适用于MetaTrader 5的付费技术指标 - 9
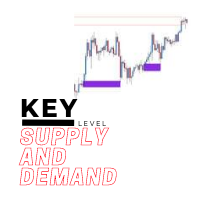
The key level supply and demand indicator is the first supply and demand indicator with options to change settings to show different zones, giving you the choice to pick the zones you see are being respected the most and saving the settings.
Advantages
The key level supply and demand DOES NOT REPAINT unlike other supply and demand currently in the market. This gives you a massive advantage to scroll back and see how price reacted on previous levels. The key level supply and demand
A brand new indicator from the developer of MOST (Moving Stop Loss) indicator Anıl Özekşi.
Optimized Trend Tracker OTT is an indicator that provides traders to find an existing trend or in another words to see which side of the current trend we are on.
We are under the effect of the uptrend in cases where the prices are above OTT ,
under the influence of a downward trend, when prices are below OTT
it is possible to say that we are.
The first parameter in the OTT indicator set by the

一個非常簡單但有效的指標。
它基於 Ichimoku 指標的 KijunSen 線,並在此基礎上建立移動平均線 MA。當這兩條線交叉時,就會出現買進或賣出的訊號。我經常在交易中使用 KijunSen 指標線:當價格高於該線時,我只專注於買入,而當價格低於該線時,我專注於賣出。
此外,在平均 KijunSen 線並創建 KijunSen 移動平均線後,這些線的主要交點變得重要,提供更明亮、更可靠的交易訊號。這些交叉點不僅預示著機會,而且可以作為在市場上做出明智決策的催化劑,使交易者能夠清晰而自信地感知變化。如此一來,KijunSen不僅成為了一個工具,也成為了金融波動海洋中的指路明燈。
MT4 版本指標的連結:
https://www.mql5.com/ru/market/product/96120
指標參數:
KijunSen - KijunSen 的計算週期。
KijunSen_MA - KijunSen MA 的計算週期。
MethodMA - KijunSen MA 價格的計算方法。
ArroyBuySell - 訊號箭頭類型
聲音

***** This is an indicator for MT5 providing accurate arrow signals without repainting. ***** Trade With Sam Simple Strategy Guide : https://www.mql5.com/en/blogs/post/740855
MT4 version of the indicator
Try Out and see the Difference
The Sam's Trend Blaster indicator tracks the market trend with an unmatched reliability, by ignoring sudden fluctuations and market noise. It has been designed to trend-trade intraday charts and small timeframes. Its winning ratio is around 85%. This is a

This indicator shows Pin Bar candlestick pattern on the chart.
The bearish pin bars have red color, the bullish pin bars have blue color. The indicator shows alert when Pin Bar candlestick pattern is formed. It's recommended to use it at timeframes H1 and higher. The best moment (strong signal) is when Pin Bar is formed close to the support/resistance level.
Zig Zag Multi Time Frame Indicator counts in how many consecutive candlesticks the current Zig Zag "lit" on the different Time Frames. It can be used for both trend signal strategies and range breakout strategies. Shows simultaneously on all Frames in how many candles we have had Zig Zag value in the current swing. The Zig Zag period can be adjusted in the Indicator settings.

The ICT Concepts indicator regroups core concepts highlighted by trader and educator "The Inner Circle Trader" (ICT) into an all-in-one toolkit. Features include Market Structure (MSS & BOS), Order Blocks, Imbalances, Buyside/Sellside Liquidity, Displacements, ICT Killzones, and New Week/Day Opening Gaps. It’s one kind of Smart money concepts. USAGE: Please read this document ! DETAILS Market Structure Market structure labels are constructed from price breaking a prior extreme point. T

For any trader, the result of market analysis is the correct determination of entry and exit points from the market. The ClearArrows indicator does not display any unnecessary information that may distract or mislead the trader, but only the most important thing. The indicator is very easy to use, when a down arrow appears, you need to open a SELL deal, when an up arrow appears you need to open a BUY deal.
The ClearArrows indicator, despite its outward simplicity, has a large analytical algor

The Volume Spread Analysis indicator is based on the original Volume Spread Analysis method. It was designed for quick and easy recognition of VSA patterns. Even though this indicator looks very simple, it is the most sophisticated tool we've ever made. It is a really powerful analytical tool that generates very reliable trading signals. Because it is very user-friendly and understandable, it is suitable for every type of trader, regardless of his experience.
What is VSA? VSA - Volume Spread

Here is a Live DEMO testing account for the indicator. ( Profit proofs ) Login (MT5) - 100246 Server - FusionMarkets-Demo Investor PW - VIPindicator@2024
Contact me through this email aaddress to download the FREE strategy PDF for this indicator tharindu999lakmal@gmail.com
Introduction The "Buy Sell Signals" is designed to provide BUY and SELL trade signals based on the current market conditions. A Profitable Trading Strategy (Chee sheet) is provided for this trading indicato

The ICT Silver Bullet indicator is inspired from the lectures of "The Inner Circle Trader" (ICT) and highlights the Silver Bullet (SB) window which is a specific 1-hour interval where a Fair Value Gap (FVG) pattern can be formed. A detail document about ICT Silver Bullet here . There are 3 different Silver Bullet windows (New York local time):
The London Open Silver Bullet (3 AM — 4 AM ~ 03:00 — 04:00)
The AM Session Silver Bullet (10 AM — 11 AM ~ 10:00 — 11:00)
The PM Session Silver Bulle

ICT Kill zone and Macros Indicator mark and display the following zone times on the chart: Kill zones Kill zone Forex Asian
London Open New York Open London Close Central Bank Dealing range
Kill zone Indices Asian London Open New York AM New York Lunch New York PM Power Hour
Macros London 1 London 2 New York Am 1 New York AM 2 New York Lunch New York PM 1 New York PM 2
Silver bullet London Open New York AM New York PM
Sessions Asian London New York
Chart The display of Kill zone ,

該指標的主要目的是確定交易進入和退出的時刻,因此 ExactArrow 除了顯示進入和退出市場的位置的箭頭之外不會繪製任何其他內容。
儘管該指標表面上很簡單,但其內部卻具有復雜的分析算法,系統藉助這些算法確定進入和退出的時刻。
該指標給出了當前蠟燭上出現的準確、及時的進入和退出交易信號。 該指標平均比同類指標早 1-2 個蠟燭發出信號。
使用該指標非常簡單。 當出現向上箭頭時,打開買入交易。 當出現向下箭頭時,打開賣出交易。
指標的輸入參數:
SoundAlert-啟用/禁用警報 period - 指標週期 EmailAlert - 發生警報時發送電子郵件 MobileAlert - 當信號出現時向移動終端發送消息
該指標不會重繪其值:如果箭頭出現在某個位置,則它會停留在那裡。

The indicator shows when there are overpricing and divergences over a normalized MACD Plus, it displays signals with configurable alerts, self-regulating dynamic overprice levels, and a simple setup and interface. The indicator that automatically calculates overprices ranges! MACDmaxmin is an indicator based on the MACD oscillator that effectively identifies trend changes in price, as it is a momentum indicator that captures the trend and shows the relationship between two moving averages of th

This indicator calculates support and resistance prices in multi-timeframe with different formulation and draw them on the chart that style do you choose. And If you want, Indicator can alert you when the current price arrive these pivot levels. Formulations: Classic, Camarilla, Woodie, Demark, Floor, Fibonacci
Alert Options: Send Mobil Message, Send E-mail, Show Message, Sound Alert
Levels: PP, S1, S2, S3, S4, S5, R1, R2, R3, R4, R5, TC, BC and Middle Points Why do you need this indicator:

趋势指标“ 超级趋势灵活警报 ”具有最少的设置。该指标旨在尽可能易于使用。指标用主色线显示趋势(“超级趋势”线,您可以在“数据窗口”窗口中看到)。此外,在趋势变化的地方,指标显示彩色箭头( “STBuy”和“ STSell”图标,您可以在“数据窗口”窗口中看到 )。 在趋势发生变化的地方,指标不会发出信号:它可能正在播放声音(或声音文件或警报),它可能正在向电子邮件发送消息,它可能正在 发送推送消息到移动端 信号设置: Sound Name - *.wav 格式的声音文件名(声音文件必须位于终端的“Sounds”文件夹中) 重复 - 信号重复次数 暂停,以秒为单位 - 信号之间的秒数(在一根柱内) Use Sound - 使用或不使用“ 声音名称” 中指定的声音文件的标志 使用警报 - 标记使用或不使用警报 使用发送邮件 - 标记是否使用电子邮件 使用发送通知 - 标记使用或不推送

该指标允许您确定当前的价格方向和市场波动。此版本的交易者动态指数消除了历史数据的重绘,优化了算法计算速度,更多的外部参数进行了更精确的调整,并扩展了其功能:增加了初始振荡器的选择和平均线的平滑方法. 参数: Mode Osc - 估计振荡器选择 Period Osc - 所用振荡器的计算周期 Price Osc - 振荡计算的应用价格 Osc volatility bands period - 振荡器的波动周期 Osc volatility bands multiplier - 振荡器的波动率乘数 Smoothing Osc price line period - 主线平滑期 Smoothing Osc price line method - 主线的平滑方法 Smoothing Osc signal line period - 信号线的平滑周期 Smoothing Osc signal line method - 信号线的平滑方法 Use original levels - 允许添加指标的初始水平水平
利用 MetaTrader 5 的终极仪表板指标 XDashboard MT5 充分发挥您的交易指标的潜力。 XDashboard MT5 专为追求精准和效率的交易者而设计,可提供跨多个符号和时间范围的任何指标的无与伦比的视图, 全部通过单一、可定制的界面进行。 ** 此价格为限时优惠 ** 特征: 自定义指标集成
全面的多符号监控 多时间框架分析 用户友好界面 实时更新 灵活的警报系统 性能优化
XDashboard MT5 不仅仅是一个指标;它是一个可提高您的交易效率和效力的强大工具。
通过提供市场的整体视图,它使您能够自信地做出明智的决策。
无论您是初学者还是经验丰富的专业人士, 指标仪表板(XDashboard MT5)都能适应您的需求并提升您的交易体验。

该指标根据 ZigZag 指标、交易时段、分形或蜡烛(包括非标准时间范围:年、6 个月、4 个月、3 个月、2 个月)自动绘制斐波那契水平(自动斐波那契回撤)。 您可以选择任何更高的时间范围进行斐波纳奇计算。 每次当前柱关闭时都会重新绘制级别。 当超过指定级别时可以启用警报。
您还可以分析历史水平。 为此,需要在“过去的斐波纳奇数”参数中指定斐波纳奇位的数量。
参数
Calculate Fibo according to — 根据斐波那契搜索模式计算斐波那契: Candles (High-Low) — 根据最高价-最低价构建斐波那契; Candles (Close-Close) — 基于收盘价-收盘价构建斐波那契; ZigZags — 通过 ZigZag 点构建斐波那契; Sessions — 通过交易会话构建斐波那契; Fractals — 通过分形点构建斐波那契。 Minimum fibo size, points (0-any) — 最小斐波那契尺寸,以点为单位。 如果斐波那契尺寸小于此大小,则忽略它。 TF for Candle — 用于构建斐波那契水平的

ZigZag 指标的多货币和多时间框架修改。 显示市场的当前方向、上次走势的高度、本次走势中的柱数以及锯齿形调整浪(水平线)的前一个点的突破。 这是 MTF 扫描仪。
您可以在参数中指定任何所需的货币和时间范围。 此外,当之字折线改变方向或突破前一点时,面板可以发送通知。 通过单击带有句点的单元格,将打开该符号和句点。
参数 Depth — 如果最后一根蜡烛的偏差小于(或大于)前一根,则 Zigzag 将不会绘制第二个最大值(或最小值)的烛台的最小数量; Deviation — 锯齿形形成局部顶部/底部的两个相邻烛台的最高点/最低点之间的最小点数; Backstep — 局部高点/低点之间的最小烛台数量; Bars to calculate ZZ — 历史中用于查找 ZigZag 点的柱的数量; ZZ-wave info — 表格中显示有关波形的哪些信息 — 仅当前波形或当前波形 + 上一个波形; Highlight the symbol when all periods are in the same direction — 方向时突出显示该符号; Symbol highl

标准偏差通道的多货币和多时间框架指标。 显示市场的当前方向。 在面板上,您可以看到线性回归通道水平的突破和触及(按价格)。 在参数中,您可以指定任何所需的货币和时间范围。 此外,该指标还可以在触及水平时发送通知。 通过单击单元格,将打开该符号和句点。 这是 MTF 扫描仪。
默认情况下,从图表中隐藏仪表板的键是“D”。 «标准偏差通道建立在线性回归趋势的基础上,代表使用最小二乘法在价格图表上的两点之间构建的常见趋势线。 结果,这条线被证明是价格变化的确切中线。 它可以被视为一条均衡价格线,任何向上或向下的偏转分别表明买家或卖家的超活跃性。
标准偏差通道由两条平行线组成,与线性回归趋势上下等距。 通道框架与回归线之间的距离等于收盘价与回归线的标准差值。 所有价格变化都发生在标准偏差通道内,其中下框作为支撑线,上框作为阻力线。 价格通常会在短时间内超过通道框架。 如果它们在通道框架之外停留的时间比平时更长,则预测趋势转向的可能性»
参数 Show Linear Regression on the chart — 在当前图表上绘制标准偏差通道。
Standard De

Spread Pulse MT5 指标是一种有效的工具,可为交易者提供有关图表上当前点差的信息。 点差是一种工具的买入价和卖出价之间的差额。
该指标以图表上显示的文本形式呈现。 这使得交易者可以轻松跟踪当前的点差。
Spread Pulse 指标的主要优点之一是其颜色可视化。 根据跨页大小,文本颜色会发生变化。 默认情况下,当点差较小时,文本将为绿色,这意味着点差较低,交易可能会更有利可图。 然而,当点差变高时,指示文字会自动变为红色。
此外,用户还可以自定义与高差和低差相关的颜色。 您还可以更改字体大小以使信息更易于阅读。
Spread Pulse 指标对于任何交易者来说都是理想的选择,无论经验水平和交易策略如何。 它可以快速、轻松地访问有关当前点差的信息,帮助交易者做出明智的决策并改善交易结果。
如果您发现该指标有用,请留下评论。 您的意见对我们非常重要,将帮助我们使指标变得更好。
选项 Spread size - 确定文本颜色的展开大小。 如果跨度大于跨度大小值,则文本为红色(默认情况下)。 当价差较高时,颜色为绿色。 High spread

This is Gekko's customizable version of the famous Heiken Ashi indicator. It extends the use of the famous Heiken Ashi and calculates strong entry and exit signals. Inputs Number of Bars to Plot Indicator: number of historical bars to plot the indicator, keep it low for better performance; Produce Arrow Signals: determine if the indicator will plot arrow signal for long/short; Produces Signal Only When a Bar Closes: wait for a bar to close to produce a signal (more accurate, by delayed entry

Boom Scalper Gold It is an indicator, programmed to scalp in a timeframe of 1/5 and 15 Minutes, perfect for hunting spikes and trend sails, where in the parameters of (70) it sends you a sale/sell alert and in the level parameter (8) it sends you a buy signal It is used for indices (BOOM) of synthetic indices (Deriv) It's easy and simple to use, it does all the work by sending you the alerts! the indicator during this period will remain on SALE! Without further ado, enjoy! Good profit. World Inv
Crash Scalper Gold It is an indicator, where it marks points of purchase and points of sale As the name says, it is used to scalp in the pairs of (Crash) 1000/500/300 where it sends you signals of sale/Sell and purchase/Buy at level points (90) he sends you the sell signal, (Spike) at the level point (27) it sends you the buy signal, (Trend Candles) It is very simple and easy to use. to make the best tickets possible! For this period it will remain on sale! Without further ado, enjoy! Good profi
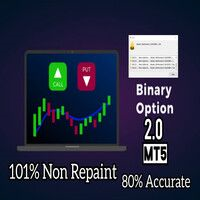
Alright. This indicator works on MT5 and is very easy to use. When you receive a signal from it, you wait for that candle with the signal to close and you enter your trade at the beginning of the next new candle. A red arrow means sell and a green arrow means buy. for easy identification of trade signal. Are you okay with that?
The indicator cost $500. We release new updates of the indicator every month and the updates are for free once you bought the indicator first time. This indicator was

This indicator is designed for M1 timeframe and shows: Sum of points when the price goes up (Green Histogram). Sum of points when the price goes down (Red Histogram). In other words, by the number and ratio of bullish points to bearish ones, you can do a technical analysis of the state of the market.
If the green histogram prevails over the red one, you can conclude that at the moment the buyers are stronger than the sellers, and vice versa, if the red histogram prevails over the green, the s

Hello Seasonal Traders! The seasonality trading strategy works because the smart money is doing the same thing every single year more often than not. The month of the year or the day of the week and the time of the day can call the shots in any market. The seasonal cycle is another useful tool in your trading arsenal. I'm not saying to trade solely off of seasonality and forget anything else. I'm only giving you another trading tool that you can incorporate into your own trading strategy to ga

The Session Volume Profile indicator displays the distribution of trade volume across price levels for a specific trading session. It visualizes areas of high and low trading activity, helping traders identify support and resistance zones. The profile's peak, known as the Point of Control (POC), represents the price with the highest traded volume.
The inputs of the indicator:
volumeBars(Row Size) : Determines the number of price bins or rows for the volume profile. A larger number results in

*Non-Repainting Indicator Arrow Indicator with Push Notification based on the Synthethic Savages strategy for synthethic indices on binary broker.
Signals will only fire when the Synthethic Savages Strategy Criteria is met BUT MUST be filtered.
Best Signals on Fresh Alerts after our Savage EMA's Cross. Synthethic Savage Alerts is an indicator that shows entry signals with the trend. A great tool to add to any chart. Best Signals occur on Fresh Alerts after our Savage EMA's Cross + Signal

"Piranha" - an autonomous trading system that determines overbought and oversold levels on the chart. Red and blue zones represent overbought and oversold levels respectively. Entry points are marked with arrows: a downward arrow in the red zone for "sell" and an upward arrow in the blue zone for "buy". The Take profit level is indicated by the green moving average. Key features: Adjusting the Take profit level as the green moving average changes position. Averaging ability when a new market e
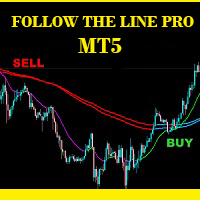
Follow The Line PRO FOLLOW THE LINE (PRO VERSION) This powerful indicator is the full and complete version of my free indicator called "Follow The Line". IT IS BASED ON the popular maxim that: "THE TREND IS YOUR FRIEND" It gives alarms and alerts of all kinds. IT DOES NOT REPAINT and can be used for all currency pairs and timeframes.
AVOID FALSE SIGNALS:
BUY ONLY when price closes above the green line and the green line is above the blue channel.
SELL ONLY when price closes below the pink

The intention of the dashboard is to provide a quick overview of the daily, weekly and monthly range of configured assets. In "single asset mode" the dashboard shows you possible reversal points directly in the chart, thus making statistics directly tradable. If a configured threshold is exceeded, the dashboard can send a screen alert, a notification (to the mobile MT5) or an email. There are various ways of using this information. One approach is that an asset that has completed nearly 100%

Heiken Ashi CE Filtered – Premium Buy/Sell Indicator with Advanced Filtering Introducing the "Heiken Ashi CE Filtered" – a high-quality custom indicator designed for traders seeking precision and clarity in their trading signals. This premium indicator combines the smooth visual simplicity of Heiken Ashi candles with the power of an ATR-based chandelier exit strategy and a zero-lag LSMA filter for highly reliable buy and sell signals. Key Features: Reliable Buy/Sell Signals: The indicator genera

Definition : VPO is a Volume Price Opportunity. Instead of using bars or candles with an Open, High, Low, and Close price, each "bar" in a Market Profile is represented by horizontal bars against the price It is called Market Profile terminology.
In other words volume-price-opportunity (VPO) profiles are histograms of how many volumes were traded at each price within the span of the profile.
By using a VPO chart, you are able to analyze the amount of trading activity, based on volume, for eac

this is an indicator to clarify seeing Low and High in the market and is very useful for facilitating those who are studying technical price action
this is a type of indicator that gives color to the candlestick where the indicator is divided into 3 colors red = bearish green = Bullish
Gray = base
this indicator can be used on the forex market or the mt5 binary market. https://t.me/SBA_FOREX_SIGNAL

Description :
VWAP (Volume-Weighted Average Price) is the ratio of the value traded to total volume traded over a particular time horizon. It is a measure of the average price at which pair is traded over the trading horizon. Read More.
All Symbols and All Timeframes are supported.
Indicator Inputs :
VWAP Mode : Mode of VWAP Calculation. Options can be selected : Single,Session,Daily,Weekly,Monthly
Volumes : Real Volumes,Tick Volumes
Price Type : Used price for cal

It predicts the most likely short-term price movement based on advanced mathematical calculations.
Features Estimation of immediate price movement; Calculation of the real market trend; Calculation of the most important support and resistance levels; Algorithms optimized for making complex mathematical calculations with a minimal drain of system resources; Self-adjusting for better performance, so it’s able to work properly at any symbol (no matter how exotic it is) and any timeframe; Compatib

Description
Bitcoin Manager is the best indicator for trading Bitcoin cryptocurrency. It is calculated based on the price deviation from the moving average line channel. Ascending and descending arrows indicate potential points and levels for opening buy and sell positions.
How to use?
We strongly recommend using this indicator on the H1 timeframe. An up arrow indicates a buy level. Down Arrow - Sell Level.
Parameters
Maximum History Bars - maximum count of history bars to calculate

40% off. Original price: $50
ATR Scanner Pro is a multi symbol multi timeframe volatility scanner that monitors and analyzes Average True Range indicator value in up to 28 symbols and 9 timeframes in 3 modes : ATR value: As a volatility dashboard it shows the ATR indicator value in all pairs and timeframes and signals when the ATR value reaches a maximum or minimum in a given duration. Short term ATR/Long term ATR ratio: It shows ratio of 2 ATRs with different periods. It's useful in detec

For those who need a Volume Profile / Market Profile indicator, here is the solution!
It contains the essential information:
Control Point (POC); Higher Value Area (VAH); Lower Value Area (VAL); You can choose to SHOW or NOT SHOW the volume Histogram, according to your wish. If you choose to show the histogram, note that according to the type of asset, it is necessary to adjust the scale of the indicator (last parameter of the indicator).
You can also choose from the data source of your h

The purpose of the Combo OnOff indicator is combine differerent tecniques and approachs to the market in order to spot signals that occur simultaneosly. A signal is more accurate if it is validate from more indicators as the adaptive expectations can be used to predict prices.The On-Off feature and alarms help to look for the better prices to enter/exit in the markets
Moving Averages are statistics that captures the average change in a data series over time
Bollinger Bands is formed by upp
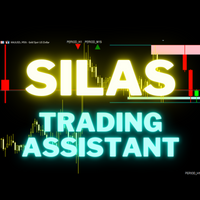
Silas is a trading assistant for multi-timeframes traders. It show on the screen, in a very clear way, all the informations needed to suits to your trading. It show : - Supply and demand zone from 2 timeframes of your choice - Setups based of market structure from 2 timeframes of your choice - Daily current high and low points - The last 2 closed candles and the current candle from an higher time frame on the right of the graph. - Actual daily candle on the left Everything is customisable !

HighQualityMap是一个很好的中长线交易指示器,这个指标可以单独使用,尤其是用在M30或者大于M30的时间框架下,它能很好的体现出趋势的走向,以及转折点,你可以很快的从这个指示器上寻找到最佳的buy和sell位置,同时也能很好根据指示器去坚守自己的持仓定订单。指标不含有未来函数,不会重新绘制,不仅能够应用到自己的手动交易过程中,还能完全可以写入到自己的EA中。(如果你感觉到这个指标能够帮助你进行更准确的交易,请帮忙给个好评,希望我的作品能够帮助更多有需要的人) ===================参数列表===================== 所有参数均采用默认参数即可,无需更改,若为激进型交易者,可以根据自己的需要来调整参数。 =================参考使用方法=================== 此指标可以适用于任何交易品种,使用周期框架大于M30相对更准确。

StartPoint是一个很好的短线交易指示器,这个指标可以单独使用,但是最好是配合 HighQualityMap 一起使用,适用于任何时间框架,喜欢超短线的朋友可以使用M5时间框架。它能很好的体现出短期趋势的启动点,你可以很快的从这个指示器上寻找到最佳的buy和sell位置,同时也能很好根据指示器去坚守自己的持仓定订单。指标不含有未来函数,不会重新绘制,不仅能够应用到自己的手动交易过程中,还能完全可以写入到自己的EA中。(如果你感觉到这个指标能够帮助你进行更准确的交易,请帮忙给个好评,希望我的作品能够帮助更多有需要的人) ===================参数列表===================== 所有参数均采用默认参数即可,无需更改,若为激进型交易者,可以根据自己的需要来调整参数。 =================参考使用方法=================== 此指标可以适用于任何交易品种。

The Market Structure Analyzer is a powerful tool designed for traders who follow market structure and smart money concepts. This comprehensive indicator provides a suite of features to assist in identifying key market levels, potential entry points, and areas of liquidity. Here's what it offers:
1. Swing High/Low Detection : Accurately identifies and marks swing highs and lows, providing a clear view of market structure.
2. Dynamic Supply and Demand Zones: Draws precise supply and demand zo
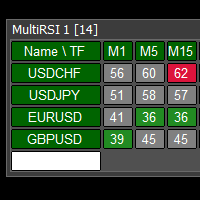
This tool monitors RSI indicators on all time frames in the selected markets. Displays a table with signals to open a BUY trade (green) or SELL trade (red). You can set the conditions for the signal. You can easily add or delete market names / symbols. If the conditions for opening a trade on multiple time frames are met, you can be notified by e-mail or phone message (according to the settings in MT5 menu Tools - Options…) You can also set the conditions for sending notifications. The list of s

This tool monitors MACD indicators on all time frames in the selected markets. Displays a table with signals to open a BUY trade (green) or SELL trade (red). You can set the conditions for the signal. You can easily add or delete market names / symbols. If the conditions for opening a trade on multiple time frames are met, you can be notified by e-mail or phone message (according to the settings in MT5 menu Tools - Options…) You can also set the conditions for sending notifications. The list of

金融指标 SolarTrade Suite:水星市场指标 - 您在金融市场世界中的可靠指南!
这是一种移动平均线,使用特殊的创新和先进算法来计算其值,并且具有令人赏心悦目的设计。
理解此指标的读数非常简单:蓝色 - 买入,红色 - 卖出。
颜色越亮,信号越强。
在说明底部查看我们的其他 SolarTrade Suite 产品。
您想自信地驾驭投资和金融市场的世界吗? SolarTrade Suite 金融指标:水星市场指标是一款创新软件,旨在帮助您做出明智的投资决策并增加利润。
SolarTrade Suite 金融指标:水星市场指标的优势:
- 准确预测:我们的指标使用先进的算法和分析方法来准确预测市场走势。
获取有关买卖资产最佳时机的信号。
- 用户友好界面:直观的界面将使您能够轻松掌握该程序并在安装后立即开始享受其好处。 您可以从设置中更改线条的颜色、粗细和样式,所有其他设置均自动完成。 - 专家支持:我们的专业团队随时准备为您解答任何问题,并为您提供有关使用该程序的建议。
为什么选择 SolarTrade Suite 财务指标:水星市场

指數波動趨勢指標。
主要特點:
它僅用於 Binary 或 Deriv 經紀商中的綜合指數,它們是相同的。 它有趨勢過濾器。 它有一個聲音警報來警告可能的價格下跌。 如果您將其放在 VPS 上,它可以向您發送移動警報。 它配置了 L566b12 算法,旨在提高效率。
如何使用指標
它在 M1 的時間性中起作用。 趨勢必須強勁。 等待信號蠟燭以與趨勢不同的顏色結束。 在 Deriv 時鐘的 57 秒處進入,以便在下一個燭台開始時進入交易。 您最多只能應用 2 個鞅。
聯繫以獲取更多信息:
WhatsApp: +5930962863284
購買後,請與我聯繫以向您發送有關如何從該工具中獲得最大好處的附加指南。
關於如何獲得最佳門票的 PDF 實用指南。 VIP模板引導您走向更好的趨勢。 個性化建議。

这是一个交易时段指标,可以显示四个交易时段的所有级别(开盘价-最高价-最低价-收盘价)。 该指标还可以预测会话级别。 会话可以用线条或矩形(空的或填充的)绘制,线条可以延伸到下一个会话。 您可以通过按热键(默认为“1”、“2”、“3”、“4”)轻松隐藏/显示每个会话。
您可以看到 ASR(平均会话范围)线(默认热键“A”) 。 这与 ADR 计算类似,只是它是根据最后一个 X 交易时段计算的,这使您可以看到当前(和之前)交易时段的潜在范围(今天价格可以移动多远)。 平均值的计算方式为之前会话的总和除以会话数(参数“ASR 周期(计算平均值的会话数)”),每个会话都有自己的 ASR 值。
该指标计算并绘制未来的会话及其大小。 正确识别报价历史记录中的漏洞。 它还可以在每个会话开始时绘制垂直分隔符。
指标自动确定图表的配色方案。
当价格触及会话水平或价格突破已关闭会话指定距离时,它还会发送警报。 可以禁用每个会话的警报。
参数“如果其他会话启动则停止会话”(热键“S”)允许您停止过时的会话,并在新会话中断时接收警报。
该指标可以绘制枢轴水平并就其发送警报。 这

Certainly. Here's the explanation in English: This program is a custom indicator that calculates the MACD (Moving Average Convergence Divergence) and shows the crossovers between the MACD and Signal lines. Here are the main functions of the program: MACD Calculation: Calculates the difference between the Fast EMA (Exponential Moving Average) and Slow EMA. This difference forms the MACD line. Signal Line Calculation: Creates the Signal line by taking a simple moving average (SMA) of the MACD valu

Do you already know the Start Midas indicator?
What about the Vwap Standard Deviation indicator?
And I need to speak again in the book MIDAS Technical Analysis ...
The Start Midas SD Channel indicator combines the two in one, bringing the practicality and efficiency of Midas with the statistical calculation of the standard deviation.
All of this with the practicality of the White Trader Start indicators, where you can plot the indicator and move them on the screen using keyboard s

This indicator can identify more than 60 candlestick patterns on the chart, including their bullish and bearish variants. Just choose the pattern you want in the settings.
Available Patterns 2 Crows Gravestone Doji On Neck 3 Black Crows Hammer Piercing 3 Inside Hanging Man Rick Shawman 3 Line Strike Harami Rising and Falling Three Method 3 Outside Harami Cross Separating Lines 3 Stars in South High Wave Shooting Star 3 White Soldiers Hikkake Short Line Abandoned Baby Hikkake Modified Spinning

该指标可有效跟踪您想要在同一图表上跟踪的任何其他时间范围烛台
1. 选择任何更高的时间范围来加载同一图表上的柱形图
2.自定义烛台的颜色和样式
3. 选择绘制烛台的柱数
4. 跟踪更高时间范围的完整蜡烛以及烛芯和实体
5. 对于那些不想切换图表的人来说,简单方便。
该指标可有效跟踪您想要在同一图表上跟踪的任何其他时间范围烛台
1. 选择任何更高的时间范围来加载同一图表上的柱形图
2.自定义烛台的颜色和样式
3. 选择绘制烛台的柱数
4. 跟踪更高时间范围的完整蜡烛以及烛芯和实体
5. 对于那些不想切换图表的人来说,简单方便。
该指标可有效跟踪您想要在同一图表上跟踪的任何其他时间范围烛台
1. 选择任何更高的时间范围来加载同一图表上的柱形图
2.自定义烛台的颜色和样式
3. 选择绘制烛台的柱数
4. 跟踪更高时间范围的完整蜡烛以及烛芯和实体
5. 对于那些不想切换图表的人来说,简单方便。

金融指标 SolarTrade Suite:冥王星市场指标 - 您在金融市场世界中的可靠指南!
它是一个波动率振荡器,使用特殊的创新和高级算法来计算其值,并且设计美观。
理解此指标的读数非常简单:绿色 - 低波动性和开立交易的最佳时间,橙色 - 高波动性和考虑平仓的时间。
颜色越亮,信号越强。
为方便起见,可以通过单击此指标的窗口来反转信号。
在说明底部查看我们的其他 SolarTrade Suite 产品。
您想自信地驾驭投资和金融市场的世界吗? SolarTrade Suite 金融指标:冥王星市场指标是一款创新软件,旨在帮助您做出明智的投资决策并增加您的利润。
SolarTrade Suite 金融指标:冥王星市场指标的优势:
- 准确预测:我们的指标使用先进的算法和分析方法来准确预测市场走势。 获取有关购买和出售资产的最佳时机的信号。 - 用户友好界面:直观的界面将使您能够轻松掌握程序并在安装后立即开始享受其优势。 从设置中,您可以更改线条的颜色、粗细和样式,所有其他设置均自动完成。 - 专家支持:我们的专业团队随时准备帮助您解决任何问题并提供

該指標生成二元期權的入場信號,在圖表上繪製箭頭並發出聲音警報。
營業時間: 6.00 GMT/ 17.00 GMT(不建議在 17.00 GMT 之後和夜間進行,因為波動性太低且成交量不足)
貨幣對:歐元/美元 (@EU6)、英鎊/美元 (BP6)。
時間範圍:1、2、3、5、10、15 分鐘 最佳時間範圍:3分鐘
到期: 1 支蠟燭
該指標需要真實交易量(無報價交易量)才能發揮作用:它不適用於 EUR/USD、GBP/USD ECC 現貨對,但適用於參考期貨合約(股票代碼):因此有必要在 Metatrader 5 上使用經紀商實時提供期貨合約的實際交易量。
歐元/美元的參考未來:是@EU6 英鎊/美元的參考期貨是 BP6
AMP GLOBAL 是一家免費實時提供期貨真實交易量的經紀商 (在 mt5 中,選擇:文件/新賬戶/查找 APM GLOBAL CLEARING 經紀商並開設模擬賬戶。模擬賬戶持續 1 個月。30 天后,需要重複該過程並重新打開,始終免費。
該指標會自動在圖表上安裝累積德爾塔,需要它才能發揮作用,因為如前所述,該指標基於價格與趨勢

這是一個基於燭台價格行為的機械設計指標。 它適用於任何給定的交易工具,每當產生買入或賣出衝動時都會發出警報,但是有一個視頻和解釋文件用於驗證信號,還提供入場和出場技術。 在 youtube benjc trade Advisor 上搜尋並找到該產品的解釋影片。
最新版本具有趨勢和振盪器約束功能,可過濾訊號並使其更加準確。 它還呼籲提高無限使用和租賃產品的價格。
未來的升級將要求價格上漲。
該系統使您在訊號產生後立即進行交易。 優點是執行交易時系統訊號遭受的回撤較少。 當設定無效時,損失非常嚴重。
目的是減少您的眼睛疲勞,因為計算機會為您觀看圖表,並在設定準備就緒時向您發出警報。 它還支援推播通知,以便即使在遠端情況下也可以向您的手機電錶 ID 提供訊號,此時電腦必須在線且指示器運行。
最終該指標可以無限使用。 我建議在狙擊手進入的較小時間範圍內使用該指標,也可以降低風險的大小。

这种用于从无穷远衡量货币强弱的创新指标是长期交易的黄牛和交易者不可或缺的助手。 分析货币强弱的系统早已被世界领先的交易者所熟知并在市场上使用。 没有这种分析,任何套利交易都是不完整的。 我们的指标很容易确定基础货币相对于彼此的强弱。 它显示所有或当前货币对的折线图,允许即时分析和搜索最强的入口点。 该指标直观,允许您快速找到并切换到任何一对,具有可放置在地下室和主图表上的移动面板。 通知货币强度变化的计时器模式使交易者有机会在手机上收到通知。
使用货币功率计无穷大指示器的几种策略:
1. 使用货币强度的线性显示图表搜索交叉点作为新兴趋势的信号 2. 在趋势反转信号出现后,向强势货币方向反弹 3. 使用货币强度发散分析扭转当前趋势 4. 使用其他无限指标向强势货币方向交易
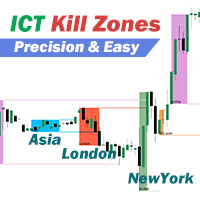
ICT killzones是市场中特定的时间段,在这个时间段内,交易量和波动性往往会增加,为了帮助交易者全面了解市场情况并更好地制定交易策略,我们开发了这个指标。 该指标用不同颜色识别ICT killzones的5个时间段,并跟踪标识出时间段内价格区域,高低支点参考线将会自动延伸,直到支点价格被突破或者交易时间段结束。该指标可以帮助您找到交易突破点以进行顺势交易。 5个killzones都是可以自行定制颜色和时间段的,可以根据您的喜好进行细微调整,或者调整为完全不同的时间区域。指标将会自动跟踪调整。 第一次使用时需要设置时差偏移,在Current Broker UTC Shift填入 MetaTrader 经纪人时间的UTC时差(例如MetaTrader默认使用莫斯科时区为UTC+3,则填入3。如已经更改为北京时间,则填入8) 使用夏令时的地区,在实施夏令时的时候,Current NY to UTC Shift填入-4,在实施冬令时的时候, Current NY to UTC Shift填入-5. 相关话题标签: 交易时段,市场时间,外汇交易时间,交易时间表,市场开盘/收盘时间,交易时

The Rubdfx swing indicator is a useful tool for traders looking to identify trend changes in a particular instrument they are trading. It is designed to draw a line on the main chart, and the signals are indicated by color changes with signal alerts. The color green is used to indicate a bullish trend, while the color pink is used to indicate a bearish trend. These colors can be customized to fit the trader's preferences or theme. The Rubdfx swing indicator has the ability to spot both long-te

该指标检测平仓,并在发现的区域画上一个彩色的矩形。
该指标的主要思想是,当价格填满图表上的某个区域时,检测出一个平盘。
输入参数:
Color rectangle - 要着色的矩形的颜色。
Bars in rectangle - 矩形中允许的最小条数。
Density in % - 扁平的密度,设置为矩形区域的百分比。 __________________________________________________________________ __________________________________________________________________ ________________________
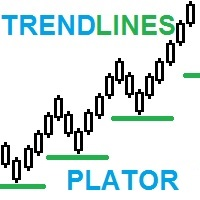
TrendPlator:一种用于优化交易策略的强大趋势预测指标 发现我们新指标的威力!它能够计算更大时间框架的趋势线并直接投射到当前时间框架,为您提供战略支持,吸引所有交易者的注意力。这些点将成为您交易操作中强大的支撑或阻力水平,推动您的交易策略。 想象一下拥有一个完美补充您价格行动指标集合的指标。我们的新指标就是这样的!测试它并惊讶于它的准确性。它可能是您策略中缺失的一部分,能够推动您的交易结果。 别浪费时间!抓住机会将这个令人惊叹的工具加入您的交易武器库。如果您认识到它的价值和潜力,不要犹豫,立即购买。通过我们的强大指标,提高您的交易准确率并达到新的成功高度! 及时了解我们的最新消息 立即订阅以获取我们独家发布的最新产品。将 Francisco Gomes da Silva 添加为好友,即可独家获得我们的新产品。 别再浪费时间了! 立即下载我们的 Metatrade指标 ,秒速获取准确高效的市场分析。 同样适用于MT4,请下载此工具 如果您在Metatrade 4中正在寻找此类工具,则可以通过此链接下载: Trendlines Plator MT4 。

The DR IDR Range Indicator PRO plots ADR, ODR and RDR ranges for a given amount of days in the past. A key feature that appears is that it calculates the success rate of the ranges for the shown days. This indicator is perfect for backtest since it shows ranges for all of the calculated days, not just the most recent sessions. In the PRO version you can now: use fully customizable advanced statistics to base your trades on get an edge via calculating statistics on up to 3 different day period

这个多时间框架和多符号指示器提醒 Heiken Ashi 平滑颜色变化。作为奖励,它还可以扫描赫尔移动平均线颜色(趋势)变化。结合您自己的规则和技术,该指标将允许您创建(或增强)您自己的强大系统。 特征
可以同时监控您的市场报价窗口中可见的所有交易品种。仅将指标应用于一张图表并立即监控整个市场。 可以监控从 M1 到 MN 的每个时间范围,并在识别出颜色变化时向您发送实时警报。支持所有类型的警报。 该指示器包括一个交互式面板。当您单击面板中的信号时,将打开带有相关交易品种和时间范围的新图表。请看下面的截图。 选择延迟一个或多个条形的警报以确认颜色(趋势)变化。 指标可以将信号写入一个文件,EA 可以使用该文件进行自动交易。比如 这个产品 。
输入参数
输入参数的描述和解释可以在 这里 找到。 重要的
请注意,由于具有多功能性,既不会在安装指标的图表上绘制买入/卖出建议,也不会绘制线条和箭头。 强烈建议将指标放在干净(空)图表上,不要在其上放置任何其他可能干扰扫描仪的指标或智能交易系统。

该多时间框架和多交易品种指标可识别随机指标信号线何时穿过随机指标主线。作为替代方案,它还可以在随机指标离开(没有信号线穿过主线)超买/超卖区域时发出警报。作为奖励,它还可以扫描布林带和 RSI 超买/超卖交叉。结合您自己的规则和技术,该指标将允许您创建(或增强)您自己的强大系统。 特征 可以同时监控市场报价窗口中可见的所有交易品种。仅将指标应用于一张图表即可立即监控整个市场。 可以监控从 M1 到 MN 的每个时间范围,并在识别出交叉时向您发送实时警报。支持所有 Metatrader 本机警报类型。 该指示器包括一个交互式面板。请参阅单独的屏幕截图以获取解释。 指标可以将信号写入文本文件 或全局变量 专家顾问 (EA) 可以使用它 进行自动交易。比如 这个产品 。 输入参数
输入参数的描述和解释可以 在这里 找到 。 重要的
请注意,由于多功能性,安装指标的图表上不会绘制买入和卖出建议,也不会绘制线条和箭头。相反,这些对象将绘制在单击图表面板中的信号时打开的图表上。 强烈建议将指标放在干净(空)的图表上,上面不要有任何其他可能干扰扫描仪的指标或 EA 交易。

由於經紀公司的技術和邏輯操作,我花了很長時間才推出了這個後方指標,它結合了具有以下功能的眾多策略:
市場趨勢識別:了解市場的整體趨勢。
反轉點:辨識市場可能改變方向的潛在點。
進入和退出點:確定進入和退出交易的最佳時間。
若要全面了解如何使用該指標,請觀看隨附的影片。此外,下載提供的指標以進行完整分析。 ------------------------------------------------------------------------ https://www.mql5.com/en/market/product/92909
AND https://www.mql5.com/en/market/product/109519

使用 WolfeWaveBuilder 指标加入交易! 这是专门为获得最成功和最有利可图的投资决策而创建的独特工具。 它是真实账户的理想选择,并受益于经过全面测试和几乎有保证的交易策略。 不要错过你的机会! 开始使用 WolfeWaveBuilder 指标赚钱交易!
MT5版本 https://www.mql5.com/ru/market/product/8920
指标特点
为 Wolfe Waves 策略提供信号。 显示趋势。 自 1980 年以来一直使用的行之有效的策略! 简单的进入信号。 不重绘也不滞后。 有声音信号,E-Mail 和电话上的通知。
操作说明
等到箭头出现,终端中出现消息或通知邮件,电话。 你打开一个交易。 建议在价格越过 1-4 线时出场。 为了更好地理解策略,建议阅读理论。
基本设置
High_period - 用于计算高周期模型的最小柱数 Low_period - 用于计算低周期模型的最小柱数 Trigger_Sens - 计算分

这是一个 MTF 指标,它基于 带有价格标签的 Advanced ZigZag Dynamic 和/或 Extended Fractals 指标极值(可以禁用)。可以为 MTF 模式选择更多更高的 TF。默认情况下,级别是基于 ZigZag 指标点生成的。分形指标点也可以与 ZigZag 一起使用或代替它。为了简化使用并节省 CPU 时间,每根柱线在开盘时执行一次计算。 参数: ForcedTF - 水平计算的图表时间范围(可能等于或超过当前时间) MinPipsLevelWidth - 以点为单位的最小关卡宽度(用于非常紧凑的关卡) Use ZigZag Extremums points - 启用/禁用使用 ZigZag 峰值计算支撑/阻力水平 Fixed pips range - 计算 ZigZag 指标的最小值和最大值之间的距离 UseDynamicRange - 启用/禁用 ZigZag 指标最小值和最大值之间距离的动态计算 Dynamic volatility period - 用于计算 ZigZag 指标最小值和最大值之间的动态距离的波动期 Dynamic vola

RSI 交叉警报 是一个功能强大的通知系统,专为在其交易策略中使用 相对强度指数 (RSI) 的交易者而设计。该指标侧重于识别 RSI 交叉,当快速 RSI 线穿过慢速 RSI 线上方或下方时发生。通过结合这些交叉点,该指标可以有效地过滤掉错误信号,让交易者做出更准确的交易决策。 RSI 交叉警报提供了几个增强其功能和可用性的关键功能。它适用于任何时间框架和交易品种,为交易者提供灵活的交易方式。该指标还拥有用户友好的参数,允许交易者根据自己的喜好和交易策略轻松定制其设置。此外,该指标可以在图表上绘制之前的信号,使交易者能够分析历史交叉模式。 为确保交易者不错过重要的交易机会,RSI Crossover Alert 包含一个快速通知系统。该系统提供及时的弹出消息提醒,让交易者了解潜在的 RSI 交叉和信号机会。通过及时收到这些警报,交易者可以立即采取行动并利用有利的市场条件。 该指标的参数设置包括调整快速RSI周期、慢速RSI周期、RSI应用价格、起始蜡烛指数、历史计算周期、箭头距离、买入箭头字符、卖出箭头字符、买入颜色、卖出颜色和警报重置周期的选项.交易者可以微调这些参数以符合他们个
学习如何在MetaTrader AppStore上购买EA交易,MetaTrader平台的应用程序商店。
MQL5.community支付系统支持通过PayPay、银行卡和热门付款系统进行交易。为更好的客户体验我们强烈建议您在购买前测试EA交易。
您错过了交易机会:
- 免费交易应用程序
- 8,000+信号可供复制
- 探索金融市场的经济新闻
注册
登录