Kostenpflichtige technische Indikatoren für den MetaTrader 5 - 5

Phi Cubic Fractals Pack1A with FuTuRe PACK 1A é uma melhoria sobre o Pack 1 que inclui a possibilidade de selecionar as linhas LINE 4/8/17/34/72/144/305/610 individualmente. Este produto contém os indicadores do PACK 1A (Lines + LineSAR + Channels + BTL + Ladder) + MODO FUTURO Phi Lines - medias moveis especiais, semelhantes às MIMAs do Phicube, capazes de indicar com muita clareza tanto a tendencia como a consolidação; Phi LineSAR - apaga ou destaca as Phi Lines para mostrar apenas as linha

I recommend you to read the product's blog (manual) from start to end so that it is clear from the beginning what the indicactor offers. This multi time frame and multi symbol divergence dashboard indicator sends an alert when one or two different divergences have been identified. It can be used with all time frames from M1 to MN. Maximum 9 time frames can be shown in the dashboard at the same time. It is possible to enable moving average, RSI or Bollinger bands trend filter to filter out on

BeST_Hull Single MA Strategy is an Metatrader Indicator based on the famous indicator Hull Mov.Average . This indicator can display the Single HMA Strategy of just 1 Hull MAvg. It uses added internal filters locating the most likely Entries while it can be used as a standalone system or as an add-on to other ones.
Generally the Hull Moving Average (HMA - developed by Alan Hull) is a directional trend indicator . It captures the current state of the market and uses recent price action to determi

*Non-Repainting Indicator Bruce Webb Explains How To Use Bruce's Price Predictor In Detail And Free Forex Strategy https://youtu.be/hfoB1tZZpTo Bruce's Price Predictor is an indicator that shows precise price reversals. A great arsenal to add to any chart. Bruce's Price Predictor points price reversals with high degree of accuracy and it is great for scalping on the 1min time frame, Or swing trading on the 1hr time frame. Buy and sell arrows are shown on the chart as for entry signals. They do

MT4 indicator version https://www.mql5.com/en/market/product/72342
I personally use this indicator to scalp. Accurate for accessing extremes and supports for buy positions primarily for 1 minute time frames. Other time frames can be used but the levels are different. Its a better oscillator and compare with others to see the difference. Day trade using neuro network concepts. This indicator uses elementary forms of neuro networks to generate signals to buy and sell. Use the indicat

Introduction to X3 Chart Pattern Scanner X3 Cherart Pattern Scanner is the non-repainting and non-lagging indicator detecting X3 chart patterns including Harmonic pattern, Elliott Wave pattern, X3 patterns, and Japanese Candlestick patterns. Historical patterns match with signal patterns. Hence, you can readily develop the solid trading strategy in your chart. More importantly, this superb pattern scanner can detect the optimal pattern of its kind. In addition, you can switch on and off individu

The Advanced Trend Scalper MT5 indicator is designed to help both novices and professional traders. The indicator analyses the market and gives you buy and sell signals. It does not use any other indicators, it works only with the market actions. The signal appears right after the candle close and it does not repaint. The efficient algorithm provides a high degree of reliability of such signals. Advanced Trend Scalpe r for the MetaTrader 4 terminal : https://www.mql5.com/en/market/product/

Multi timeframe ZigZag indicator. It displays the support/resistance horizontal lines and their breakouts, as well as draws the current targets of the market. It can also display lines of the Fractals indicator and candles from other periods (up to Quarterly).
The indicator redraws the last (current) point, and in some cases can change the last 2-3 points.
All lines are drawn as objects (not indicator buffers, but there is a possibility to receive the data for the EA ). When used in an Exp
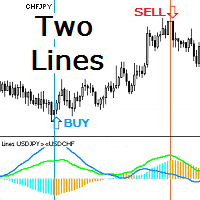
Индикатор показывает две линии динамики движения двух инструментов. Если один из коррелирующих инструментов убегает, другой будет его догонять. Этот принцип даёт точки входа в сделку по их кроссу или для синхронной покупки и продажи в парном трейдинге. Гистограмма индикатора показывает значение дистанции между линиями инструментов. При уменьшении и увеличении дистанции гистограмма принимает разные цвета. Треугольный значок показывает текущее состояние линий: расхождение ( Divergence ) или схо

The Heikin Ashi Delta Pro leverages the refined elegance of Heikin Ashi candlesticks, renowned for their ability to filter market noise and highlight clearer trends and reversals. Building on a solid foundation, this advanced indicator integrates the Hull Moving Average method, enhancing its precision and responsiveness. Alongside an intuitive alert system, it transforms raw market data into actionable trading insights, empowering traders to make more informed decisions swiftly. Learn more about

The indicator is designed for pair trading with 2 highly correlated instruments.
Indicator charts can be displayed as lines or histograms. There is an MTF mode, the maximum and minimum deltas for the calculated number of bars are displayed with a check for a specified minimum value. It is possible to enable the calculation of trade operations with checking the current correlation coefficient for the minimum specified, the current delta in points or percent of the maximum (minimum) delta and

An indicator to draw a graph of account current and historical state such as Balance, Equity, Margin, Free Margin, Margin Level, Drawdown, Account Profit, Deposit and Withdrawals.
Indicator Inputs : Draw Balance Graph Draw Equity Graph Draw Margin Graph Draw Free Margin Graph Draw Margin Level Graph Draw Drawdown Graph Draw Account Profit Graph Hide Data on Chart and Buffers Connect Gaps by Lines Sign of DDs on Profit Sign of DDs on Loss
Tips : The Indicator will draw historical balance gra

I'm excited to introduce you to the fifth bar on Martin Armstrong's Forecast Array - The Trading Cycle .
This innovative tool represents a transverse form of cyclical frequency analysis, offering a unique perspective on market trends.
The model employs a color-coded system for easy interpretation. In this model, green signals the ideal timing for highs, red indicates ideal lows, and yellow signifies a convergence of highs and lows occurring simultaneously. This intuitive approach allows

Documentation for connecting Metatrader 5 with Python with a simple drag and drop EA.
A full end-to-end solution ,fully tested ,fast and efficient!
The Pytrader ecosystem consists of a python script and a MT5 or MT4 version EA.
Further for the licensing an indicator is used.
The communication between the python script and the EA is based on sockets.
EA is the Server and the python script the Client .
It is always query(function / python script) and output(data / serv

Wolfe Waves sind natürlich vorkommende Handelsmuster, die an allen Finanzmärkten vorhanden sind und einen Kampf um einen Gleichgewichtspreis darstellen. Diese Muster können sich über kurze und lange Zeiträume entwickeln und sind eines der zuverlässigsten prädiktiven Umkehrmuster, die es gibt und die normalerweise starken und langen Kursbewegungen vorausgehen. [ Installationsanleitung | Update-Anleitung | Fehlerbehebung | FAQ | Alle Produkte ] Klare Handelssignale Erstaunlich einfach zu handeln

Heiken Ashi Smoothed Strategy is a very simple but powerful system to get forex market trend direction. This indicator is actually 2 indicators in 1 pack, Heiken Ashi and Heiken Ashi Smoothed Moving Average both included. Because HA (Heiken Ashi) and HAS (Heiken Ashi Smoothed) are calculated in the same one system event with necessary buffers and loop only, so it is the FAST, OPTIMIZED and EFFICIENT HA having the combined indicator of MetaTrader 5. You can choose to display HA and HAS in the sam

Heikin Ashi candlesticks are a powerful tool for traders, offering a clear and smooth visualization of market trends. Unlike traditional candlesticks, they filter out market noise, providing a cleaner view of the market's direction and strength, which helps traders make more informed decisions. The Hull Heikin Ashi Smoothed indicator from Minions Labs takes this a step further by integrating the Hull Moving Average for enhanced smoothing and precision. This indicator not only simplifies trend id

The ICT Unicorn Model indicator highlights the presence of "unicorn" patterns on the user's chart which is derived from the lectures of "The Inner Circle Trader" (ICT) .
Detected patterns are followed by targets with a distance controlled by the user.
USAGE (image 2) At its core, the ICT Unicorn Model relies on two popular concepts, Fair Value Gaps and Breaker Blocks. This combination highlights a future area of support/resistance.
A Bullish Unicorn Pattern consists ou

MACD (short for Moving Average Convergence/Divergence) is one of the most famous and oldest indicators ever created and is widely used among beginners . However, there is a newer version of the MACD that is named Impulse MACD which have less false signals than the standard MACD. Classic MACD helps us to identify potential trends by displaying crossovers between two lines. If MACD line crosses above the Signal line it shows us that the market is potentially up trending and that

Stochastic: It was developed by George Lane in the early 1950s. It is based on the principle that the price closes close to the maximum if the asset is on an uptrend, and close to the minimum if it is on a downtrend. Following the idea of the inercial movement of prices. This indicator can generate possible signals of overbought moments or about asset sales. In a usual way it can used according to some standards;
Slow Stochastic: A moving average of 3 periods is calculated on the stochastic i

This indicator shows the engulfing pattern, which is the most direct manifestation of capital flow. Engulfing Pattern is a common price reversal pattern in technical analysis, which usually appears at the end of a price trend or at key support and resistance levels. It can be divided into two types: Bullish Engulfing Pattern and Bearish Engulfing Pattern. Bullish Engulfing Pattern feature: Previous K-line: This is the negative line of a small entity (the opening price is higher than the closing
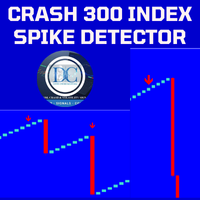
Spike Detector for Boom and Crash Indices
The Spike Detector is specifically designed to cater to the unique needs of traders in the Boom and Crash indices markets. Optimized for M1 (1-minute) and M5 (5-minute) timeframes, this tool ensures you receive timely and actionable insights. Below, you'll find a comprehensive guide on its key features, advantages, installation process, and how to use it effectively.
Key Features and Advantages
1. Non-Repainting: The Spike Detector guarantees accu

This indicator determines the short-term and long-term trend. The analysis is based on the selected timeframe. Indicator shows the points of opening deals for sale or purchase, and also indicates the direction of the trend at: Short term Long term
This indicator not only signals an immediate purchase or sale. It indicates short term and long term trend. The indicator allows you to examine in more detail the real and historical market trends!

MetaCOT 2 is a set of indicators and specialized utilities for the analysis of the U.S. Commodity Futures Trading Commission reports. Thanks to the reports issued by the Commission, it is possible to analyze the size and direction of the positions of the major market participants, which brings the long-term price prediction accuracy to a new higher-quality level, inaccessible to most traders. These indicators, related to the fundamental analysis, can also be used as an effective long-term filter

The GGP Chandelier Exit Alert MT5 Indicator is a volatility-based indicator that identifies stop loss exit points for long and short trading positions. Chandelier Exit is based on the Average True Range (ATR) indicator. It is designed to keep traders in the trend until a defined trend reversal happens. Traders use CE to maximize their returns in a trade and make stop loss exit decisions. It is based on the principle that a trend reversal is highly probable when the price of an asset moves agains
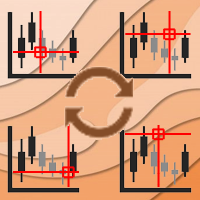
Async Charts is an indicator to synchronize charts and display a customized crosshair (cursor) on all selected charts. This is a useful utility for traders using multiple timeframes of analyzing multiple symbols for trade entry or exit.
Main Features : Real time Crosshair Synchronization on All Selected Charts
Supports Multiple Timeframes and Multiple Symbols at the same time
Auto Scroll Option
Graphical Adjustment of Color, Font, Size, ...
Locking All or Locking Specific Charts
More and

The double top bottom pattern is arguably one of the technical analysis's most popular chart patterns. These patterns are used to capitalize on recurring patterns and identify trend reversal patterns, thereby creating well-placed entry and exit levels. The KT Double Top Bottom is based on these patterns and fine-tunes the trade signal development process for traders.
Features
It's based on one of the most reliable trading patterns and brings some fine-tuning and automation to the process. A

Trend Scanner is a trend indicator that helps to determine the current and forecast market direction using an advanced algorithm. Thanks to flexible alert settings, the indicator will promptly warn you about a trend reversal. The indicator is intuitive and easy to use, and will be an excellent filter in your trending trading strategies. The lines of this indicator are also an excellent dynamic level for stop loss, and is used as one of the types of trailing stop in Trading Panel . To fine-tune t

Addition to the standard Relative Strength Index (RSI) indicator, which allows to configure various notifications about the events related with the indicator. For those who don't know what this indicator is useful for, read here . This version is for MetaTrader 5, MetaTrader 4 version - here . Currently implemented events: Crossing from top to bottom - of the upper signal level (default - 70) - sell signal. Crossing from bottom to top - of the upper signal level (default - 70) - sell signal. Cro

White Weis Volume
This indicator shows the sum of the volume in each wave, bulish or bearish, as idealized by David Weis , but it brings an important addition , which is the marking of the bar with the highest volume of the wave (White Bar)!
In coding the indicator, it was sought to optimize the code to require minimal processing during use and not to overload mt5.
The indicator can be used for pre-trading analysis and study, where the trader analyzes possible points of support and resi

The indicator displays the "Three white soldiers and Three black crows" candlestick model on a chart. Three white soldiers are color in blue. Three black crows are colored in red. Input parameters: Max Bars - maximum number of bars calculated on the chart. Make Signal Alert - use alert. Type of pattern rules - use a strict model of determining the pattern (short lower shadows for the three soldiers, short upper shadows for the three crows), or a simplified model. Max Shadow Ratio - coefficient o

Your search for a perfectly simple ICT Killzone indicator for MT5 is now over because here it is. If you trade ICT concepts, then you know what ICT Killzones are. ICT Killzones (by default is adjusted to EST New York Time, no recalibrating to your timezone needed. Just load it onto your chart and you're good to go): Asian Open Killzone (06:00PM - 12:00AM EST New York Time) London Open Killzone (02:00AM - 05:00AM EST New York Time ) New York Open Killzone (07:00AM - 9:00AM EST New York Time )
Any MA
Any Moving Average draws a moving average of * any indicator in a sub-window. Many Indicators included with MT5 are supported by default. You can add custom indicators as well. Settings Name Description Timeframe Select timeframe for calculation Source Indicator Select Indicator Custom Indicator Name Enter Custom Indicator Name ( when Source Indicator is set to Custom) Indicator Settings Source Indicator parameters ( separated by comma ) Moving Average Settings Moving Average pa

The KT 4 Time Frame Trend is an invaluable forex indicator for traders seeking to identify the trend direction across 4-time frames accurately. This innovative indicator allows users to simultaneously observe and analyze price trends across four different timeframes. Whether you're a beginner or an experienced trader, this tool offers an enhanced understanding of trend dynamics, leading to improved trading strategies on your trading platform. The capability to concurrently monitor multiple timef
The KT Risk Management Indicator provides a comprehensive overview of the profit/loss and risk management characteristics of your Metatrader account, offering valuable insights and information. It efficiently categorizes the displayed information at account and symbol levels, ensuring a clear and organized presentation of crucial data. Risk is inherent when trading the Forex market - a reality that seasoned traders acknowledge and beginners quickly realize. To succeed in this volatile market, t

Classic RSL This is the classic indicator "Relative Strength Levy" (RSL), according to Dr. Robert Levy's study, called "The Relative Strength Concept of Common Stock Pricing", which was released as a hardcover book in late 60's of the last century.
Key concept Use this indicator on various instruments to compare their relative strength: The resulting analysis values will fluctuate around 1 The strongest instruments will have the highest RSL values (above 1) and the weakest instruments

Swing Points are those places on the chart where price changes direction. This is an MT5 version of my MT4 Swing Points Indicator. Found on the code base at https://www.mql5.com/en/code/15616 and in the market at https://www.mql5.com/en/market/product/22918
The beginning input parameters allow you to configure your alerts. Turn on screen alerts allows you to turn on and off screen alerts. True is on, false is off. Turn on push to phone alerts allows you to turn on and off push to phone ale

This is the MT5 version of Extreme Reversal Sniper MT4 Indicator Extreme Value Sniper is a detrended price indicator Indicator finds the potential reversal levels by checking value ranges and price cycles.
***Indicator does NOT repaint so it provides accurate NO REPAINT REVERSAL SIGNALS***
MT4 Version of the Indicator: https://www.mql5.com/en/market/product/114426
It shows the overbought and oversold levels using the average range. Overbought Levels are between 4 and 10 Oversold levels a

Laguerre SuperTrend Clouds adds an Adaptive Laguerre averaging algorithm and alerts to the widely popular SuperTrend indicator. As the name suggests, Laguerre SuperTrend Clouds (LSC) is a trending indicator which works best in trendy (not choppy) markets. The SuperTrend is an extremely popular indicator for intraday and daily trading, and can be used on any timeframe. Incorporating Laguerre's equation to this can facilitate more robust trend detection and smoother filters. The LSC uses the

If you use the MFI (Money Flow Index) indicator, the waiting time till the next signal can be long enough. Now you can avoid sitting in front of the monitor by using MFI Alerts. This is an addition or a replacement to the standard MFI oscillator . Once there appears an MFI signal on the required level, the indicator will notify you with a sound or push, so you will never miss a signal. This is especially significant if you follow the indicator in different timeframes and currency pairs, which ca
The first currency based indicator to draw a distinction between map and strength. The map shows the currencies in terms of oversold/overbought levels and gives the direction of travel. The currency strength calculates and shows the strength of that move. Alerts are included for changes in currency direction on the map (confirmed over two bars) and also when the strength reached the appropriate level. The currency map is useful for finding currency pairs to trade and in which direction. Look fo

Dieser Indikator ist ein perfekter automatischer Wellenanalyse-Indikator für den praktischen Handel! Die standardisierte Definition des Bandes ist nicht mehr eine Welle von verschiedenen Leuten, und das Ziehen von menschengemachten Interferenzen wird eliminiert, was eine Schlüsselrolle bei der gründlichen Analyse des Ansatzes spielt. =>Increase the choice of international style mode, (red fall green rise style) Derzeit Kaufrabatt! Inhalt des Index: 1. Grundwelle: Zue
The Breakout Indicator That Has Been Proven & Tested! Breakout Analyzer uses an advanced algorithm based on high probability price patterns. Each trade is analyzed on the statistics panel to help you evaluate the best breakout setups.
Bonus Strategy 1
Breakout Analyzer with Volume Critical Watch Video: (Click Here)
Bonus Strategy 2
Breakout Analyzer with Strength Meter
Watch Video: (Click Here)
Features Universal compatibility to different trading systems Analyzes statistics of breako

Dieses Dashboard entdeckt und zeigt die Angebots- und Nachfragezonen auf dem Chart an, sowohl im Scalping- als auch im Long-Term-Modus, je nach Ihrer Handelsstrategie für die ausgewählten Symbole. Darüber hinaus hilft Ihnen der Scanner-Modus des Dashboards, alle gewünschten Symbole auf einen Blick zu überprüfen und keine geeigneten Positionen zu verpassen / MT4-Version Kostenloser Indikator: Basic Supply Demand
Merkmale
Ermöglicht Ihnen die Anzeige von Handelsmöglichkeiten für mehre

Das 123-Muster ist eines der beliebtesten, leistungsstärksten und flexibelsten Diagrammmuster. Das Muster besteht aus drei Preispunkten: einem Boden, einem Gipfel oder Tal und einem Fibonacci-Retracement zwischen 38,2% und 71,8%. Ein Muster gilt als gültig, wenn der Preis jenseits des letzten Gipfels oder Tals abbricht, in dem der Indikator einen Pfeil zeichnet, einen Alarm auslöst und der Handel platziert werden kann. [ Installationsanleitung | Update-Anleitung | Fehlerbehebung | FAQ | Alle Pr

PTS - Divergence Buy Finder von Precision Trading Systems
Der Precision Divergence Finder wurde entwickelt, um Markt-Tiefpunkte mit höchster Genauigkeit zu finden und tut dies häufig.
In der technischen Analyse ist das Aufspüren von Tiefpunkten im Allgemeinen viel einfacher als das Aufspüren von Höchstpunkten. Dieses Tool wurde genau für diese Aufgabe entwickelt. Nachdem eine bullische Divergenz identifiziert wurde, ist es ratsam, auf die Trendwende zu warten, bevor Sie kaufen. Sie können e

"Sentiments of traders" in the financial markets is a topic that has been of interest to us for a long time. In time, we could not find the right formula to define these sentiments. We went through many stages in the search for the right methodology - from taking data from external sources to calculate open positions of buyers and sellers to calculating tick volumes, but still we were not satisfied with the results. The calculation of open positions of buyers and sellers from external sources ha

In the "Masters of Risk" trading system, one of the main concepts is related to places where markets change direction. In fact, this is a change in priority and a violation of the trend structure at the extremes of the market, where supposedly there are or would be stop-losses of "smart" participants who are outside the boundaries of the accumulation of volume. For this reason, we call them "Reversal Patterns" - places with a lot of weight for the start of a new and strong trend.
Some of the im

The most crucial price level in any "Volume Profile" is the "Point of Control" . Is the price level with the highest traded volume. And mainly, is the level where the big guys start there their positions, so it's an accumulation/distribution level for smart money.
The idea of the indicator arose after the "MR Volume Profile Rectangles" indicator was made. When creating the "MR Volume Profile Rectangles" indicator, we spent a lot of time comparing the volumes with those from the volume profil

## Arbeiten Sie professionell mit WAPV Full und verfolgen Sie Wo ist das Geld der großen Spieler? Stellen Sie sich vor, Sie hätten ein Werkzeug in der Hand, das allein das Lesen übernimmt der wichtigsten Marktteilnehmer mit den besten Handelsregionen basierend auf Preis- und Volumenanalyse. WAPV Full ist ein komplettes Tool, das sich zu 100 % auf den Betrieb von R. Wyckoff konzentriert Neben der Abbildung von Marktbewegungen in Handelswellen werden auch Abbildungen erstellt den Markt, indem Sie

One of the most powerful and important ICT concepts is the Power of 3. It explains the IPDA (Interbank Price Delivery Algorithm) phases. PO3 simply means there are 3 things that the market maker's algorithm do with price:
Accumulation, Manipulation and Distribution
ICT tells us how its important to identify the weekly candle expansion and then try to enter above or below the daily open, in the direction of the weekly expansion.
This handy indicator here helps you keep track of the weekly

Full implementation of Directional Movement System for trading, originally developed by Welles Wilder, with modifications to improve profitability, to reduce the number of unfavorable signals, and with Stop Loss lines.
No re-paint
Features
Buy/sell signals displayed on the chart Stop levels visually indicated on the chart Profit-taking points presented in the indicator window Exit points for unfavorable positions presented in the indicator window Signal confirmation through high/low swing c

The Ultimate Trend and Reversals Detector The Ultimate Trend and Reversals Detector is a powerful tool designed to identify potential trend reversal zones in the financial markets. Here are the key features: Objective : Detect trend directions and reversals. Signal Colors : Green : Indicates a potential bullish trend reversal. Red : Signals a potential bearish trend reversal. Non-Repainting : The indicator’s signals are not redrawn, providing reliable information. Suitable for All Styles : Scal

The most crucial price level in any "Volume Profile" is the "Point of Control" . Is the price level with the highest traded volume. And mainly, is the level where the big guys start there their positions, so it's an accumulation/distribution level for smart money.
The idea of the indicator arose after the "MR Volume Profile Rectangles" indicator was made. When creating the "MR Volume Profile Rectangles" indicator, we spent a lot of time comparing the volumes with those from the volume profil

The indicator combines the features of both the Tick charts and Volume Bar charts. The mode can be selected in the indicator's settings.
Tick charts measure the number of transactions per bar. To give you an example if you have a 233 tick chart, each bar measures 233 transactions per bar and a new bar is plotted after 233 transactions. You can choose any number of ticks per bar but most traders choose Fibonacci numbers (1, 2, 3, 5, 8, 13, 21, 34, 55, 89, 144, 233...). Volume bar charts are desi

ENG-GOLD Scalper It is an auxiliary indicator that identifies potential targets and determines the place of entry with a stop loss that works on Heiken Ashi candles
The green lines are usually the targets, the red lines are the stop loss, and the yellow lines are the entry location.
This file is recognized on small and medium frames, usually less than the watch frame
I highly recommend using XAUUSD US100 US30 USOIL

Good day!
I present to you a trading technical indicator for Deriv broker synthetic indices. This indicator ONLY works with the following indices: Boom 300 Index Boom 500 Index Boom 1000 Index Crash 300 Index Crash 500 Index Crash 1000 Index The indicator was created to give signals to open medium-term trades in the direction of Spikes. But you can open trades in the opposite direction to Spikes, at your own risk. Trade only on M1. Other TFs do not guarantee the correct operation of the indic

The indicator is a trading system for short-term trading.
Scalper Assistant helps to determine the direction of the transaction, and also shows the entry and exit points.
The indicator draws two lines (possible points for opening positions).
At the moment of the breakdown of the upper line up (and when all trading conditions are met), an up arrow appears (a buy signal), as well as 2 goals.
At the moment of the breakdown of the lower line down (and when all trading conditions are met), a do

The market is unfair if only because 10% of participants manage 90% of funds. An ordinary trader has slim changes to stand against these "vultures". This problem can be solved. You just need to be among these 10%, learn to predict their intentions and move with them. Volume is the only preemptive factor that faultlessly works on any timeframe and symbol. First, the volume appears and is accumulated, and only then the price moves. The price moves from one volume to another. Areas of volume accumu

** All Symbols x All Timeframes scan just by pressing scanner button ** *** Contact me immediately after the purchase to send you instructions and add you in "Market Structure group" for sharing or seeing experiences with other users. Introduction: Market structure is important for both new and professional traders since it can influence the liquidity and price action of a market. It’s also one of the most commonly used techniques to understand trends, identify potential reversal points,

I recommend you to read the product's blog (manual) from start to end so that it is clear from the beginning what the indicator offers. This multi time frame and multi symbol supply and demand zone dashboard indicator sends alerts when the price has reached a supply/demand zone. It is also possible to use it to be alerted about regular double tops/bottoms instead of zones. It can be used with all time frames from M1 to MN. Maximum 9 time frames can be shown in the dashboard at the same time.

The Missing Edge You Need To Catch Breakouts Like A Pro. Follow a step-by-step system that detects the most powerful breakouts!
Discover market patterns that generate massive rewards based on a proven and tested strategy.
Unlock Your Serious Edge
Important information here www.mql5.com/en/blogs/post/723208
The Reliable Expert Advisor Version
Automate Breakout EDGE signals using "EA Breakout EDGE" Click Here Have access to the game changing strategy that will take your trading to the n

Der Indikator zeigt die am besten geeigneten Einstiegs- und Ausstiegspunkte an. Er zeigt auch statistische Daten zu allen Signalen an, um den Handel besser analysieren zu können.
Mit Hilfe dieses Indikators werden Sie den Markt besser verstehen können.
Sobald sich die Kraft des Trends abzuschwächen beginnt (dies wird auf dem Panel angezeigt), bewegt sich die Trendlinie in die Horizontale - dies ist das Signal zum Ausstieg aus dem Handel. Oder Sie können aussteigen, wenn das durchschnittliche

I've combined two trading strategies, the Order Block Strategy and the FVG Trading Strategy, by utilizing a combination of the FVG indicators and Order Blocks. The results have been surprisingly effective.
This is a two-in-one solution that makes it easy for traders to identify critical trading zones. I've optimized the settings so that all you need to do is install and trade; it's not overly complex to explain further. No need for any usage instructions regarding the trading method. You shou

Haben Sie einen wirklich guten Indikator ... aber Sie wünschen sich Alarme? Finden Sie es anstrengend, einen Indikator genau zu betrachten, um zu sehen, ob er Ihnen ein Signal gegeben hat? ... Dann ist dieser Indikator vielleicht etwas für Sie!
Universal Alerts analysiert einen Ihrer Chart-Indikatoren und gibt Warnungen aus, wenn sie gemäß Ihren eigenen Parametern ein Signal geben. Nach der Konfiguration dieses Indikators wird jedes Mal, wenn es ein Kauf-/Verkaufssignal gab, ein Symbol angezei

Dieser Multi-Time-Frame- und Multi-Symbol-Indikator kann die folgenden 5 Kreuze identifizieren: wenn ein sich schnell bewegender Durchschnitt eine Linie des langsamen gleitenden Durchschnitts kreuzt. wenn der Preis einen einzelnen gleitenden Durchschnitt erreicht hat (oben/unten geschlossen oder gerade abgesprungen). wenn eine Triple Moving Average Formation aufgetreten ist (alle 3 MA:s in aufeinanderfolgender Ausrichtung) wenn die MACD-Hauptlinie die Signallinie kreuzt. wenn die Signallinie die

RubdFx Perfect Reversal , The reversal indicator is used to determine areas of support and resistance by Drawing an arrow with a level of supply and demand ( ReversalZones ). - You will catch more swings by reducing the period, and less swings if you increase period - Mobile, computer and email alerts available . it is not pushed by price which means the arrow will stay in one place,suitable for scalping and long term trading Also Compatible with all forex paris , BUY RULES; open a buy positio

Critical Zones wurde speziell für manuelle Händler entwickelt, die nach präziseren Markteinstiegen suchen. Dieser Indikator nutzt fortschrittliche Algorithmen, um interessante Bereiche zu erkennen, indem er die wichtigsten Unterstützungs- und Widerstandszonen auf dem Chart sowie deren Ausbrüche und Wiederholungen berechnet. Dieser Indikator kann so konfiguriert werden, dass er Warnungen und Benachrichtigungen sendet, wenn potenziell lukrative Kauf-/Verkaufsgelegenheiten erkannt werden, so das
Der MetaTrader Market ist die beste Plattform für den Verkauf von Handelsroboter und technischen Indikatoren.
Sie brauchen nur ein gefragtes Programm für die MetaTrader Plattform schreiben und schön gestalten sowie eine Beschreibung hinzufügen. Wir helfen Ihnen, das Produkt im Market Service zu veröffentlichen, wo Millionen von MetaTrader Benutzern es kaufen können. Konzentrieren Sie sich auf dem Wesentlichen - schreiben Sie Programme für Autotrading.
Sie verpassen Handelsmöglichkeiten:
- Freie Handelsapplikationen
- Über 8.000 Signale zum Kopieren
- Wirtschaftsnachrichten für die Lage an den Finanzmärkte
Registrierung
Einloggen
Wenn Sie kein Benutzerkonto haben, registrieren Sie sich
Erlauben Sie die Verwendung von Cookies, um sich auf der Website MQL5.com anzumelden.
Bitte aktivieren Sie die notwendige Einstellung in Ihrem Browser, da Sie sich sonst nicht einloggen können.