适用于MetaTrader 5的付费技术指标 - 11

Introducing the revolutionary ICT Silver Bullet Strategy Indicator for MT5, a groundbreaking tool designed to usher in a new era of trading for beginners and experienced traders alike. This advanced indicator seamlessly translates the intricate ICT Silver Bullet strategy into a simplified visual representation on your charts, offering not just comprehension but a path to profitable trading. A Strategy Simplified: Navigating the complexities of the ICT Silver Bullet strategy has never been easie

Addition to the standard Relative Strength Index (RSI) indicator, which allows to configure various notifications about the events related with the indicator. For those who don't know what this indicator is useful for, read here . This version is for MetaTrader 5, MetaTrader 4 version - here . Currently implemented events: Crossing from top to bottom - of the upper signal level (default - 70) - sell signal. Crossing from bottom to top - of the upper signal level (default - 70) - sell signal. Cro

Call/Put Ratio is one of the most well-known indicators of the market sentiment. The indicator has been developed by Martin Zweig. It is based on real volumes of the CBOE option market. As we know, a Call option gives its owner the right to buy the underlying asset at a predetermined price. A Put option gives the right to sell it. Thus, increasing volumes for Call options indicate the increasing demand. The growth of Put option volumes shows that supply starts exceeding demand. If we divide the

The indicator displays the "Three white soldiers and Three black crows" candlestick model on a chart. Three white soldiers are color in blue. Three black crows are colored in red. Input parameters: Max Bars - maximum number of bars calculated on the chart. Make Signal Alert - use alert. Type of pattern rules - use a strict model of determining the pattern (short lower shadows for the three soldiers, short upper shadows for the three crows), or a simplified model. Max Shadow Ratio - coefficient o

Your search for a perfectly simple ICT Killzone indicator for MT5 is now over because here it is. If you trade ICT concepts, then you know what ICT Killzones are. ICT Killzones (by default is adjusted to EST New York Time, no recalibrating to your timezone needed. Just load it onto your chart and you're good to go): Asian Open Killzone (06:00PM - 12:00AM EST New York Time) London Open Killzone (02:00AM - 05:00AM EST New York Time ) New York Open Killzone (07:00AM - 9:00AM EST New York Time )

Imbalance / FVG MTF Mark Imbalance on chart of Selected Multi Time frames. Trend is Manually set to filter signals in the chosen direction by a button on the chart. .
Futures Auto Mark Imbalance / FVG on chart on selected time frames
Select time frames by buttons on chart
Popup Alert, Push Notification or email when New Imbalance Form
Popup Alert, Push Notification or email when Imbalance is Taken out
Select Alert Mode to be a single or multiple Imbalance ( OR / AND option ) when Imbalan
Any MA
Any Moving Average draws a moving average of * any indicator in a sub-window. Many Indicators included with MT5 are supported by default. You can add custom indicators as well. Settings Name Description Timeframe Select timeframe for calculation Source Indicator Select Indicator Custom Indicator Name Enter Custom Indicator Name ( when Source Indicator is set to Custom) Indicator Settings Source Indicator parameters ( separated by comma ) Moving Average Settings Moving Average pa
MT5. Определяет торговые каналы и флет актуальные на текущий момент. Принцип построения канала основан на волновой теории поведения цены. Индивидуальная разработка. Канал можно рассматривать как тренд. С закрашенным фоном это основные импульсные каналы. Коррекционные каналы без фона. Границы пробитых каналов выделены трендовыми линиями. Они будут являться линиями поддержки и сопротивления. Это не стандартные каналы. Они вычисляются по новому принципу. В алгоритм заложена закономерность пове
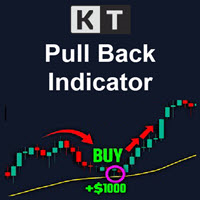
The KT Pull Back Arrows shows the pull back arrows using the RSI (Relative Strength Index) to identify suitable pull-back entry areas within the overbought and oversold zones. The indicator effectively pinpoints favorable moments for initiating pull-back trades by leveraging these RSI thresholds. Trend trading is often considered the most profitable strategy in the Forex market. It is the equivalent of riding the wave, going with the flow, and capitalizing on market momentum. However, timing is

This indicator informs the user when the ATR is above a certain value defined by the user, as well as when the ATR prints a percentage increase or percentage decrease in its value, in order to offer the user information about the occurrence of spikes or drops in volatility which can be widely used within volatility-based trading systems or, especially, in Recovery Zone or Grid Hedge systems. Furthermore, as the volatility aspect is extremely determining for the success rate of any system based o

The KT 4 Time Frame Trend is an invaluable forex indicator for traders seeking to identify the trend direction across 4-time frames accurately. This innovative indicator allows users to simultaneously observe and analyze price trends across four different timeframes. Whether you're a beginner or an experienced trader, this tool offers an enhanced understanding of trend dynamics, leading to improved trading strategies on your trading platform. The capability to concurrently monitor multiple timef
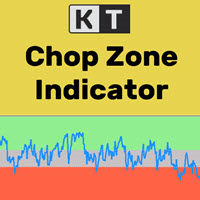
It's a well-known fact that most of the financial markets trend only 30% of the time while moving in a closed range rest 70% of the time. However, most beginner traders find it difficult to see whether the markets are trending or stuck in a range. KT Chop Zone solves this problem by explicitly highlighting the market phase into three zones as Bearish Zone, Bullish Zone, and Chop Zone.
Features
Instantly improve your trading by avoiding trade during the sideways market (Chop Zone). You can al

KT Trend Magic shows the trend depiction on chart using the combination of market momentum and volatility. A smoothing coefficient is used to smooth out the noise from the signal.It can be used to find out the new entries or confirm the trades produced by other EA or indicator.
Features
Drag n drop MTF scanner which scans for the new signals across multiple time-frames. Find new entries in the trend direction. Improve the accuracy of other indicators when used in conjunction. Can be used as a
The KT QQE Advanced is a modified version of the classic QQE oscillator to depict it more accurately using the colored histogram with fast and slow Trailing Line(TL).
Unlike the classic QQE, the KT QQE Advanced consists of a histogram with overbought/oversold levels.
Applications
Find quick buy/sell signals across all the timeframes using the MTF scanner. Find the trend direction more accurately. Detects overbought/oversold market. Shows the price momentum.
Inputs RSI Period Smooth Per

50% Off Today Only! Price Goes Back Up at 11 PM (EST)
uGenesys Volume Indicator: Your Key to Mastering Market Volume Analysis What Traders Are Saying: "A must-have indicator...really a game-changer." – wuzzy66 "Amazing indicator...strongly recommend to beginners." – joinbehar Understanding Market Volume: Volume in the market is a critical indicator of movement and opportunity. The uGenesys Volume Indicator is specially crafted to pinpoint when the market has the most volume, allowing you t
The KT Risk Management Indicator provides a comprehensive overview of the profit/loss and risk management characteristics of your Metatrader account, offering valuable insights and information. It efficiently categorizes the displayed information at account and symbol levels, ensuring a clear and organized presentation of crucial data. Risk is inherent when trading the Forex market - a reality that seasoned traders acknowledge and beginners quickly realize. To succeed in this volatile market, t

Classic RSL This is the classic indicator "Relative Strength Levy" (RSL), according to Dr. Robert Levy's study, called "The Relative Strength Concept of Common Stock Pricing", which was released as a hardcover book in late 60's of the last century.
Key concept Use this indicator on various instruments to compare their relative strength: The resulting analysis values will fluctuate around 1 The strongest instruments will have the highest RSL values (above 1) and the weakest instruments

KT Volume Profile shows the volume accumulation data as a histogram on the y-axis providing an ability to find out the trading activity over specified time periods and price levels.
Point of Control (POC) in a Volume Profile
POC represents a price level that coincides with the highest traded volume within the whole volume profile histogram. POC is mostly used as a support/resistance or as an essential price level where market retest before going in a specific direction.
Features Very easy

Swing Points are those places on the chart where price changes direction. This is an MT5 version of my MT4 Swing Points Indicator. Found on the code base at https://www.mql5.com/en/code/15616 and in the market at https://www.mql5.com/en/market/product/22918
The beginning input parameters allow you to configure your alerts. Turn on screen alerts allows you to turn on and off screen alerts. True is on, false is off. Turn on push to phone alerts allows you to turn on and off push to phone ale
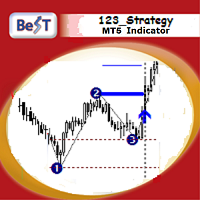
BeST_123 Strategy is clearly based on the 123 Pattern which is a frequent Reversal Chart Pattern of a very high Success Ratio .It occurs at the end of trends and swings and it’s a serious indication of high probability for a change in trend.Theoretically an 123_pattern is valid when the price closes beyond the level of #2 local top/bottom, a moment when the indicator draws an Entry Arrow, raises an Alert, and a corresponding Position can be opened.
The BeST 123_Strategy Indicator is non-repai

KT XMaster Formula is a buy & sell signal indicator that works magically on most of the timeframes and currency pairs when used correctly.
The indicator uses calculations based on moving averages, RSI, and MACD. It is usually appropriate for scalping and trend trading - whether you are a novice or an experienced trader, the signals generated by this indicator are simple to understand and implement.
Overview The indicator comprises green and red dots arranged in wavy lines. These dots corre

This indicator recognizes all support and resistance levels. A number of unique high-performance techniques have been applied, which made the existence of this indicator possible.
All formed channels are naturally visible: horizontal linear linear parabolic cubic (Polynomial 3 degrees - Wave) This is due to a bundle of approximating channels. The formed channels form "standing waves" in a hierarchical sequence. Thus, all support and resistance levels are visible.
All parameter management is

Divergence is one of the vital signals that depicts the upcoming price reversal in the market. KT Stoch Divergence shows the regular and hidden divergences build between the price and stochastic oscillator.
Limitations of KT Stoch Divergence
Using the Stochastic divergence as a standalone entry signal can be risky. Every divergence can't be interpreted as a strong reversal signal. For better results, try to combine it with price action and trend direction.
Features
Marks regular and hidde

KT Auto Fibo draws Fibonacci retracement levels based on the ongoing trend direction. The Highs and Lows are automatically selected using the Maximum and Minimum points available on the chart. You can zoom in/out and scroll to adjust the Fibonacci levels accordingly.
Modes
Auto: It draws the Fibonacci levels automatically based on the chart area. Manual: It draws the Fibonacci levels only one time. After that, you can change the anchor points manually.
Usage: Helps to predict the future p

This indicator is a conventional analytical tool for tick volumes changes. It calculates tick volumes for buys and sells separately, and their delta on every bar, and displays volumes by price clusters (cells) within a specified bar (usually the latest one). The algorithm used internally is the same as in the indicator VolumeDeltaMT5 , but results are shown as cumulative volume delta bars (candlesticks). Analogous indicator for MetaTrader 4 exists - CumulativeDeltaBars . This is a limited substi

Laguerre SuperTrend Clouds adds an Adaptive Laguerre averaging algorithm and alerts to the widely popular SuperTrend indicator. As the name suggests, Laguerre SuperTrend Clouds (LSC) is a trending indicator which works best in trendy (not choppy) markets. The SuperTrend is an extremely popular indicator for intraday and daily trading, and can be used on any timeframe. Incorporating Laguerre's equation to this can facilitate more robust trend detection and smoother filters. The LSC uses the

If you use the MFI (Money Flow Index) indicator, the waiting time till the next signal can be long enough. Now you can avoid sitting in front of the monitor by using MFI Alerts. This is an addition or a replacement to the standard MFI oscillator . Once there appears an MFI signal on the required level, the indicator will notify you with a sound or push, so you will never miss a signal. This is especially significant if you follow the indicator in different timeframes and currency pairs, which ca

Advanced Bollinger Bands Scanner is a multi symbol multi timeframe Bollinger bands dashboard that monitors and analyzes the Bollinger Bands indicator from one chart. This panel scans the Bollinger bands indicator in up to 28 configurable instruments and 9 timeframes for price overbought/oversold, price consolidation (Bollinger bands squeeze), and consolidation breakout (squeeze break) with a deep scan feature to scan all market watch symbols (up to 1000 instruments!).
Download Demo here

Moving Average Trend Scanner is a multi symbol multi timeframe triple MA crossover dashboard that helps traders to monitor, and identify potential market trends from one chart. This panel scans 3 moving averages in up to 28 configurable instruments and 9 timeframes for triple moving average alignment and moving average crossover with a deep scan feature to scan all market watch symbols (up to 1000 instruments!).
Download Demo here (Scans only M1 and M6) Settings description here MT4 v

When using CCI (Commodity Channel Index) oscillator, the waiting time till the next signal can be long enough depending on a timeframe. CCI Alerts indicator prevents you from missing the indicator signals. It is a good alternative for the standard CCI indicator. Once there appears a CCI signal on the required level, the indicator will notify you with a sound or push, so you will never miss an entry. This is especially significant if you follow the indicator in different timeframes and currency p

Trend Line Finder will project forward a support and resistance lines using 2 previous highs for resistance and 2 previous lows for support. It will then signal to the trader by alert making the trader more aware that a possible good move is about to happen. This is not a stand-alone trading system but is very useful in finding key areas of support resistance levels where price will usually either rebound from or breakthrough. Its down to the trader to decide what to do with use of other s

BreakHarmony Multi-Timeframe Breakout Indicator for MT5
The BreakHarmony Multi-Timeframe Breakout Indicator for MT5 is a highly advanced tool providing information on breakout points across different timeframes, aiding traders in decision-making and understanding market movements. [ Features and Manual | MT4 version | All Products ] The indicator tracks breakout points on price charts across 6 timeframes. Breakout prices are indicated with the closing price of the correspond

The RSI Advanced tool will help traders capture trends and optimal entry points by:
- Enter a Buy order when the green line crosses the yellow line. Provided that the yellow line is near line 32 or 20 - Enter a Sell order when the green line crosses the yellow line. Provided that the yellow line is near line 68 or 80
Additionally, you can combine it with the convergence divergence that occurs at the green line.
**When you purchase the Mastering the RSI MT4 or Mastering the RSI MT5 indicat

Tape Reading, flow monitoring.
FabFlowInPrice is a powerful indicator for those who like Tape Reading (Times & Trades). It presents the volumes traded at each price level, considering the purchase, sale and direct aggressions for each level. Excellent tool for market flow analysis. Thought of flow so monitor who is attacking the most, buyers, sellers or direct exchanges, thought FabFlowInPrice. The indicator displays information in 4 distinct and fixed periods, on any timeframe: @Day - All

BeST_Hull MAs Directional Strategy is a Metatrader Indicator based on the corresponding Hull Moving Average.It timely locates the most likely points for Entering the Market as well as the most suitable Exit points and can be used either as a standalone Trading System or as an add-on to any Trading System for finding/confirming the most appropriate Entry or Exit points. This indicator does use only the directional slope and its turning points of Hull MAs to locate the Entry/Exit points while it

***** This is an indicator for MT5 providing accurate arrow signals without repainting. ***** Trade With Sam Simple Strategy Guide : https://www.mql5.com/en/blogs/post/740855
MT4 version of the indicator
Try Out and see the Difference
The Sam's Trend Blaster indicator tracks the market trend with an unmatched reliability, by ignoring sudden fluctuations and market noise. It has been designed to trend-trade intraday charts and small timeframes. Its winning ratio is around 85%. This is a

MT4 Version Wave Trend MT5 Wave Trend is an oscillator, which helps identifing in a extremely accurate manner market reversals. The Oscillator being obove the overbought level and a cross down of the fast into the slow MA usually indicates a good SELL signal. If the oscillators is below the oversold level and the fast MA crosses over the slower MA usually highlights a good BUY signal. The Wave Trend indicator can be also used when divergences appear against the price, indicating the current move

The indicator automatically plots significant trend lines and displays buy and sell signals. Signals are generated for reflection and breakdown from support and resistance lines. When a signal appears, the indicator displays it as an arrow of the specified color and also sends the message type specified in the input parameters. In the indicator settings, you can set the signal type, the maximum distance to the trend line, the type of notifications, as well as the settings for lines and ar

The Relative Strength Index indicator drawn using a tick chart. After launching it, wait for enough ticks to come. Parameters: RSI Period - period of averaging. overbuying level - overbought level. overselling level - oversold level. calculated bar - number of bars on the chart for the indicator calculation. The following parameters are intended for adjusting the weight of RSI signals (from 0 to 100). You can find their description in the Signals of the Oscillator Relative Strength Index section

"Sentiments of traders" in the financial markets is a topic that has been of interest to us for a long time. In time, we could not find the right formula to define these sentiments. We went through many stages in the search for the right methodology - from taking data from external sources to calculate open positions of buyers and sellers to calculating tick volumes, but still we were not satisfied with the results. The calculation of open positions of buyers and sellers from external sources ha

This is a multi-timeframe indicator that detects and displays support and resistance (S&R) lines using the ZigZag indicator.
Features
The support and resistance lines are not redrawing. The indicator is capable of adding new support and resistance levels as they appear. Each S&R line has a tooltip that displays the price level and start time. Save time for multi-timeframe analysis on trades. All types of alerts (sound, pop-up, email, mobile push notification) are available. Working with al

In the "Masters of Risk" trading system, one of the main concepts is related to places where markets change direction. In fact, this is a change in priority and a violation of the trend structure at the extremes of the market, where supposedly there are or would be stop-losses of "smart" participants who are outside the boundaries of the accumulation of volume. For this reason, we call them "Reversal Patterns" - places with a lot of weight for the start of a new and strong trend.
Some of the im

The most crucial price level in any "Volume Profile" is the "Point of Control" . Is the price level with the highest traded volume. And mainly, is the level where the big guys start there their positions, so it's an accumulation/distribution level for smart money.
The idea of the indicator arose after the "MR Volume Profile Rectangles" indicator was made. When creating the "MR Volume Profile Rectangles" indicator, we spent a lot of time comparing the volumes with those from the volume profil
You probably won't see the power of the indicator in the backtest, because it uses 3 windows, something you can't do, in the DEMO version that the site offers. I trust 100% on my work and on my indicator, if you want a test version, send me a message, different from other sellers, who just want to "sell", I want whether you have a full version before renting and deciding. Christmas Discount 30% off until the 25th As you can imagine, it was a failure, I'm not saying that any indicator doesn't w

本指标是实践实战交易完善的波浪自动分析的指标 ! 黄金实战 案例... 注:波浪分级用西方叫法不习惯,因 受到缠论(缠中说禅)命名方式习惯的影响,我是将基础波浪命名为 笔 , 将二级波段命名为 段 , 同时具有趋势方向的段命名为 主趋段 (以后笔记中都是这种命名方式,先告知大家),但是算法上和缠论关系不大切勿混淆.反映的是本人分析盘面总结的 千变万化纷繁复杂的运行规律 .
对波段进行了标准化定义,不再是不同人不同的浪 , 对人为干扰的画法进行了排除 , 在严格分析进场起到了关键的作用 . 指标内容 1. 基础波浪(笔): 首先我们找出了价格波动过程中的基础波动拐点,当然他的有序性还不算太强,为下一步的计算提供基础 . 2. 二级波段(段) :在基础波浪的基础上,通过算法分析得到层级更明显的二级波段,二级波段为波浪提供了分析基础 3. 波浪(浪): 有着更清晰的趋势,更清晰直观的方向.分析一个波浪是否延续,需要看二级波段的形态,分析二级的构成,可以得出波浪后续的预测. 4. 通道: 通道计算采用了线性回归的方式进行计算. 5. 回撤: 波浪中的两个重要回

The Ultimate Trend and Reversals Detector The Ultimate Trend and Reversals Detector is a powerful tool designed to identify potential trend reversal zones in the financial markets. Here are the key features: Objective : Detect trend directions and reversals. Signal Colors : Green : Indicates a potential bullish trend reversal. Red : Signals a potential bearish trend reversal. Non-Repainting : The indicator’s signals are not redrawn, providing reliable information. Suitable for All Styles : Scal

The most crucial price level in any "Volume Profile" is the "Point of Control" . Is the price level with the highest traded volume. And mainly, is the level where the big guys start there their positions, so it's an accumulation/distribution level for smart money.
The idea of the indicator arose after the "MR Volume Profile Rectangles" indicator was made. When creating the "MR Volume Profile Rectangles" indicator, we spent a lot of time comparing the volumes with those from the volume profil

Support and Resistance zones indicator for MT5 is a multi-timeframe panel and alert that finds support and resistance zones and pivot points for all timeframes of MetaTrader 5 and gives alert when price has interaction with them. Download demo version (works on GBPUSD, EURJPY and NZDUSD symbols) Read the full description of scanner parameters in the blog page . Many unique features in one indicator: Integrating support and resistance zones and pivot points in one indicator with powerful filteri
BW Dance - Bill Williams Trading Chaos Signal MTF Indicator for MetaTrader 5
!!! This indicator is not a trading system !!!
This is only a convenient tool for receiving signals of the Bill Williams trading system in visual and sound mode - Signals are not redrawn/ not repainting
The main idea of the indicator:
display current signals of the BW system on the right edge of the chart, according to the principle HERE and NOW output signals in three ways:
next to the price scale unde

This product contains following indicators: (Lines + LineSAR + Channels + BTL + Ladder) Phi Lines - special EMAs, similar to MIMAs from Phicube; Phi LineSAR - erase and highlight Phi Lines in support or resistance. Similart to MIMASAR from Phicube; Phi Channels - show support and resistance, similar to Phibo from Phicube (Green and Read Lines); Phi BTL - candles color following Phi Lines alignment; Phi LADDER - Indicator that allow you to visualize possible targets.
FUTURO Tool Future to

FXC iRSI-DivergencE MT5 指示符
這是一個高級RSI指標,可找到當前交易品種上的趨勢轉折差異。 該指標將RSI和價格走勢之間的背離檢測為強烈的趨勢轉變模式。
主要特點: 高級發散設置
價格基於收盤價,開盤價或最高價/最低價 發出買/賣開放信號
推送通知
郵件發送
彈出警報
可定制的信息面板
輸入參數: RSI Period: RSI指標的周期大小。
RSI Applied Price: RSI指標的適用價格。 可以是:關閉,打開,高,低,中位,典型,加權。
Symbol Applied Price: 當前符號的適用價格。 可以是:關閉,打開,低(B)/高(S)。
Minimum A-B Price Movements (pip): 確定差異的A點和B點之間的最小價格變動。
Minimum A-B RSI Movements (point): 確定散度的A點和B點之間的最小RSI值移動。
Minimum Bars Between A' and B' (bars): A點和B點之間允許的最小條形數量。
Maximum Bars Betw
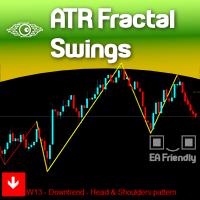
The concept of Fractals is everywhere in the respected Technical Analysis teaching and for a good reason: It Makes Sense! It is not a "self-fulfilling prophecy" like Fibonacci levels which we totally respect but we didn't explore yet, but this concept of Fractals can only be seen visually on your chart if we really SHOW that to you on your chart, right?
There are dozens of Zig-zag and Swing Legs indicators out there so you probably would be wondering: Why our indicator is different? Because we

Course Crystal是一種幫助交易者確定市場趨勢方向的指標。 它使用獨特的演算法來分析價格變動,並將結果顯示在圖表上的彩色區域中。 藍色表示買入機會,紅色表示賣出機會。 使用說明 - https://www.mql5.com/en/blogs/post/757800 手動交易系統:
趨勢確定:Course Crystal 指標分析當前和過去的價格資料以確定趨勢的總體方向。 如果大多數數據顯示價格上漲,則該指標會變成藍色。 如果數據顯示價格下跌,則指示器變為紅色。 進入交易的訊號:當指標的顏色從紅色變為藍色時,這可能是買入訊號。 當指標顏色從藍色變成紅色時,可能是賣出訊號。 風險管理:始終為每筆交易設定停損和獲利來管理風險非常重要。 建議將停損設定在高於(買入)或低於(賣出)最後高點或低點的水平。 退出交易:當達到停盈或停損水準或指標向相反方向改變顏色時,交易關閉。 請記住,沒有任何指標是 100% 準確的,將指標與其他技術分析和風險管理工具結合使用始終很重要。 交易愉快!

The Trend Quality Indicator (by David Sepiashvili) is intended to measure trend activity. Some benchmarks can be used to determine the strength of a trend.
In the range of values from -1 to +1 ( Ignored zone parameter) , the trend is buried beneath noise. It is preferable to stay out of this zone.
The greater the value, the less the risk of trading with a trend, and the more reliable the trading opportunity.
The range from +1 to +2, or from -1 to -2, may be treated as zone of weak tr

A scalping indicator based on mathematical patterns, which on average gives signals with relatively small SL, and also occasionally helps to catch big moves in the markets (more information in the video)
This indicator has three main types of notifications: The first type warns of a possible/upcoming signal on the next bar The second type indicates the presence of a ready signal to enter the market/open a position The third type is for SL and TP levels - you will be notified every time price r

Overview
The Volume SuperTrend AI is an advanced technical indicator used to predict trends in price movements by utilizing a combination of traditional SuperTrend calculation and AI techniques, particularly the k-nearest neighbors (KNN) algorithm.
The Volume SuperTrend AI is designed to provide traders with insights into potential market trends, using both volume-weighted moving averages (VWMA) and the k-nearest neighbors (KNN) algorithm. By combining these approaches, the indicat

Introduction
"Smart money" is money invested by knowledgeable individuals at the right time, and this investment can yield the highest returns.
The concept we focus on in this indicator is whether the market is in an uptrend or downtrend. The market briefly takes a weak and reversal trend with "Minor BoS" without being able to break the major pivot.
In the next step, it returns to its main trend with a strong bullish move and continues its trend with a "Major BoS". The "order bloc

这个多时间框架和多品种指标扫描 pin bar。结合您自己的规则和技术,该指标将允许您创建(或增强)您自己的强大系统。 特征 可以同时监控您的市场报价窗口中可见的所有交易品种。将该指标仅应用于一张图表,并立即监控整个市场。 可以监控从 M1 到 MN 的每个时间范围,并在识别出 pin bar 时向您发送实时警报。支持所有 Metatrader 原生警报类型。 可以使用 RSI 或布林带作为趋势过滤器,以便正确识别潜在的逆转。 该指示器包括一个交互式面板。请参阅单独的屏幕截图。 可以配置为显示买入/卖出线和 TP/SL 线(基于 ATR 乘数)。这些线将显示在您通过单击面板中的信号打开的图表上。请看下面的截图
该指标可以将信号写入一个文件,EA 可以使用该文件进行自动交易。
输入参数
输入参数的描述和解释可以在 这里 找到。 重要的
请注意,由于具有多功能性,既不会在安装指标的图表上绘制买入/卖出建议,也不会绘制线条和箭头。它们将绘制在图表上,该图表将在单击面板中的信号时打开。强烈建议将指标放在干净(空)图表上,不要在其上放置任何其他可能干扰扫描仪的指标或智能交易系统。
Stochastic Crossover Dashboard Pro uses the value of Stochastic indicator. The Stochastic's parameters can be adjusted via the Edit boxes of this dashboard. The monitoring pairs will be selected by adding to the Market Watch (no need to set prefixes or suffixes) , you can monitor many pairs as you like. This dashboard will check almost popular time frame (M1,M5,M15,M30,H1,H4 and D1). The colors can be customized. The parameters of Stochastic can be set at the input. Crossover signal can be sent

Introducing Moon Spiker – Your Lunar Gateway to Precision Trading on MetaTrader 5! Elevate your trading experience to astronomical heights with Moon Spiker, a cutting-edge indicator designed to harness the celestial powers for precise analysis and decision-making. Say hello to an innovative tool that will send your trading strategy rocketing to the next level! Designed exclusively for MetaTrader 5, Moon Spiker is meticulously crafted to cater to the discerning trader focused on the 1-hou
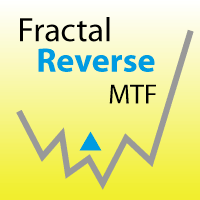
Fractal Reverse MTF - Indicator for determining the fractal signal to change the direction of the trend for МetaТrader 5.
The signal is determined according to the rules described in the third book of B. Williams:
- In order to become a signal to BUY, the fractal must WORK ABOVE the red line
- In order to become a signal for SALE, the fractal must WORK BELOW the red line
- Signals are not redrawn/ not repainting The main idea of the indicator:
- Determine the change in the directio

The indicator measures and displays the difference in the number of "Bid" and "Ask" prices changes in the form of digital, analog and graphic indicators. Designed for market research and for determine the moments of position closing during scalping trade with H1 or less timeframe. Use with bigger timeframe is not prohibited, but it is not informative because of a large number of accumulated values. Theory
"Bid" and "Ask" prices do not change simultaneously for most symbols. Often you can see h

Support Resistance View draws horizontal lines in the current chart that define in real time the values of Supports/Resistances for the timeframe tha you choose. Inputs: Lines color: color of the lines. Timeframe: timeframe for calculations. Support and Resistance are values at which the currency usually inverts the trend or have a breakthrought, so you can use this values to define a strategy for trading.
Exclusive Stairs is a trend indicator for the MetaTrader 5 platform. Its operation algorithm is based on moving averages, processed by special filters and price smoothing methods. This allows the Exclusive Stairs to generate signals much earlier than the conventional Moving Average. This indicator is suitable both for scalpers when used on the smaller timeframes and for traders willing to wait for a couple of days to get a good trade. Exclusive Stairs for the MetaTrader 4 terminal : https://ww

This incicator shows you when a pin bar is formed, and aid you perform a inversion strategy or a trend continuation based on resistence support and or channel. Typically a pin bar shows you a price rejection from the market and the signal most of time is profitable. So i suggest to use buy/sell limit order over ratrace SL little bit over or below bar and take profit based on your strategy and money management.
Best timeframe are D H4 H1

Индикатор RSI magic kjuta5 .
Пользовательский Индикатор ( RSI magic kjuta ) на основе стандартного Индикатора Силы ( Relative Strength Index, RSI ) с дополнительными настройками и функциями. К стандартной линии RSI добавлены линии максимального и минимального значения RSI на графике. Теперь можно визуально наблюдать прошедшие максимумы и минимумы RSI , а не только значения по закрытию баров, что позволяет избежать путаницы при анализе торгов. Например, советник открыл или закрыл ордер, но

Time And Sales Layout indicator shows traded buy and sell volumes right on the chart. It provides a graphical representation of most important events in the time and sales table. The indicator downloads and processes a history of real trade ticks. Depending from selected depth of history, the process may take quite some time. During history processing the indicator displays a comment with progress percentage. When the history is processed, the indicator starts analyzing ticks in real time. The l
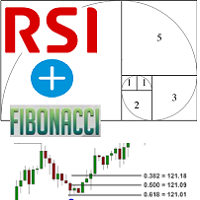
Fibonacci and RSI.
The indicator is a combination of the Fibonacci and RSI indicators.
Every time the price touches one of the fibonacci levels and the rsi condition is met, an audible alert and a text alert are generated.
Parameters number_of_candles : It is the number of candles that will be calculated. If you put 100, the indicator will give you the maximum and minimum of the last 100 candles.
sound_signal: If you want the indicator to notify you that the conditions are met using

Classical ADX revamped to provide faster and more solid trading signals. This indicator calculates ADX values using standard formulae, but excludes operation of taking the module of ADX values, which is forcedly added into ADX for some reason. In other words, the indicator preserves natural signs of ADX values, which makes it more consistent, easy to use, and gives signals earlier than standard ADX. Strictly speaking, any conversion to an absolute value destroys a part of information, and it mak

The Chandelier Exit, introduced by Charles LeBeau, is described in "Come into My Trading Room" book.
It calculates each stop on a long position in an uptrend from the highest point reached during that rally, and gets its name from the chandelier, which hangs from the highest point in the room. The Chandelier Exit uses a multiple of the Average True Range (ATR), subtracting it from the highest high since the trade was entered. It creates a new trade whenever the previous trade is stopped out. Ch
MetaTrader市场提供了一个方便,安全的购买MetaTrader平台应用程序的场所。直接从您的程序端免费下载EA交易和指标的试用版在测试策略中进行测试。
在不同模式下测试应用程序来监视性能和为您想要使用MQL5.community支付系统的产品进行付款。
您错过了交易机会:
- 免费交易应用程序
- 8,000+信号可供复制
- 探索金融市场的经济新闻
注册
登录