Guarda i video tutorial del Market su YouTube
Come acquistare un Robot di Trading o un indicatore
Esegui il tuo EA
hosting virtuale
hosting virtuale
Prova un indicatore/robot di trading prima di acquistarlo
Vuoi guadagnare nel Market?
Come presentare un prodotto per venderlo con successo
Nuovi indicatori tecnici per MetaTrader 4 - 8

This indicator is the translated version of Anıl ÖZEKŞİ's MOST Indicator, developed on the Matriks Data Terminal, into the MQL4 language. It is a trend-following indicator and quite successful. Its usage will be free and unlimited for a lifetime. You can click on my profile to access the MQL5 version of this indicator. You can also get your programming requests for MQL4 and MQL5 languages done at İpek Bilgisayar with an invoiced service. You can reach İpek Bilgisayar at www.ipekbilgisayar.org .
FREE
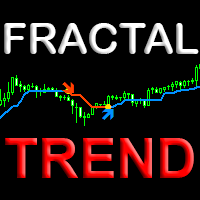
The Fractal Trend indicator visually displays trend changes in price fractals based on the Price Action (PA) principle. The unique algorithm uses the fractal principle of determining a trend change and a new proprietary method of filtering fractals, which gives an advantage in relation to other similar indicators based on MA moving averages. This new approach to trend determination helps to determine with high confidence the trend change points on any financial instrument and on any time frame

USDLFX is a currency index of US dollar formulated by LiteForex broker. It is an attempt to create an indicator for USD currency power. The idea has been further extended to other major Forex currencies. These indices are not available on other brokers. There are other currencies AUD CAD EUR CHF GBP NZD JPY Thanks to this indicator, you have an objective view of the selected currency

This comprehensive technical indicator calculates and plots up to 3 moving averages with 3 different periods. By employing three moving averages of distinct lookback periods, the trader can confirm whether the market has indeed experienced a change in trend or whether it is merely pausing momentarily before resuming its prior state. SX Golden MA Pack for MT5 is available here . The shorter the moving average period, the more closely it tracks the price curve. When a security initiates an upt
FREE
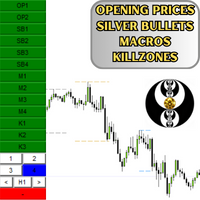
This is an Indicator that plots Time & Price . This is a good ICT Starter Indicator especially if you're new. This also has 4 Silver Bullets and 4 Macros. If you liked this one, you can purchase the updated version of this which has CBDR and Asian Range . Updated Version: https://www.mql5.com/en/market/product/109904 Please leave a review about your experience with this Indicator
FREE

Advanced Currency Strength Indicator
The Advanced Divergence Currency Strength Indicator. Not only it breaks down all 28 forex currency pairs and calculates the strength of individual currencies across all timeframes , but, You'll be analyzing the WHOLE forex market in 1 window (In just 1 minute) . This indicator is very powerful because it reveals the true movements of the market. It is highly recommended to analyze charts knowing the performance of individual currencies or

First of all, it is worth highlighting here that this Trading Indicator is Non Repainting, Non Redrawing and Non Lagging, which makes it ideal for manual trading. Never repaint and recalculate Once an arrow appears it never disappears, the signal comes at the opening of the new candle You will now be more profitable with this indicator The indicator will alert you when an arrow appears You can do swing trading or scalping trading The indicator helps you identify the trend Can be optimized acros

テクニカル指標開発の第一人者であるトム・デマークが考案した TDシーケンシャルは、 トレンドの転換点を判断するのに有用なインディケータです。このインディケータは TDシーケンシャルを裁量およびEAで実際に利用してきた私自身の経験から、より手軽に、かつ効果的に活用できるよう作成された裁量トレード用サインツールです。
強いトレンドが生じている際に多くのだましが生じるのはTDシーケンシャルの弱点と思われますが、これを克服するために強力なフィルターを装備しています。また、最も有効と思われるセットアップ9に絞ってサインを発信します。
全通貨ペア、全タイムフレームで利用できます。勝敗判定機能により、このインディケータの直近の相場環境に対する有効性を確認できます。
設定項目は下記のとおりです。 Enable Protect Mode...強いトレンドが発生した際の連敗を回避します Box Filter...下で設定する3つのタイムフレームでの移動平均でパーフェクト・オーダーが発生していない状態をボックス相場と判定し、サインを限定します Moving Average Time Frame1

Introducing the Reversal and Breakout Signals
This innovative tool is crafted to enhance your chart analysis by identifying potential reversal and breakout opportunities directly on your charts. It's designed with both novice and experienced traders in mind, providing intuitive visual cues for better decision-making. Let's dive into the key features and how it operates:
### Key Features:
Dynamic Period Settings: Customize the sensitivity of the indicator with use

History VT Информационный индикатор. Показывает на графике, сразу после открытия сделки, стрелку именно на той японской свече, где позиция открыта.
То есть там, где появилась штрихпунктирная линия открытой сделки, в терминале.
Далее, после открытия сделки, как обычно, трейдер ставит SL и TP и ждёт итога своего выбора направления движения.
После того как сделка закрылась, по « sl » или « tp » или «вручную», индикатор отображает на графике уровни и текстовые сноски параметров сделки.
С

Introduction
One of the patterns in "RTM" is the "QM" pattern, also known as "Quasimodo". Its name is derived from the appearance of "Hunchback of Notre-Dame" from Victor Hugo's novel. It is a type of "Head and Shoulders" pattern.
Formation Method
Upward Trend
In an upward trend, the left shoulder is formed, and the price creates a new peak higher than the left shoulder peak . After a decline, it manages to break the previous low and move upward again. We expect the pric
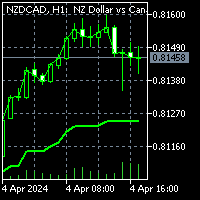
To get access to MT5 version please click here . This is the exact conversion from TradingView: "G-Channel Trend Detection" by "jaggedsoft". This is a light-load processing and non-repaint indicator. You can message in private chat for further changes you need. All input options are available. Buffers are available for processing within EAs. Highlight option is omitted as does not show good in Metatrader.

Once upon a time, in the bustling streets of Gotham City, there lived a mysterious figure known only as the Joker. With his enigmatic grin and unpredictable nature, the Joker roamed the city's financial district, leaving chaos and uncertainty in his wake. One fateful day, a group of traders stumbled upon a peculiar artifact hidden deep within the dark alleys of Gotham. It was a cryptic indicator known as the "Joker Arrow," rumored to possess the power to predict market movements with uncanny acc
TeconLab Indicator User Guide Overview The TeconLab Indicator is a tool for MetaTrader 4 (MT4) users, fine-tuned to gather price information, including Date, Time, Open, High, Low, Close, and Volume, and update this data in real-time. Uniquely, this indicator autonomously refreshes the CSV file every minute or less, meaning there's no need for manual restarts—just activate it once, and it will continuously collect data as long as MT4 is running. It maintains the latest data according to the size
Based on unique formulas and calculations, this indicator analyses every price move on the chart then applies its unique formulas on them to indicate the currently dominant direction. This indicator works on all instruments but best with GOLD (XAUUSD). It can also work as an entry confirmation tool and can also serves highlighting the worthy and noticeable moves on the chart. The Oppo Signals Indicator can work alongside any other strategy and can also help traders devise their own strategies u

The indicator is based on the calculation of liquidity on the market and thus shows where the market can most likely turn.. It shows the places of liquidity where the price will reach sooner or later... The indicator can be set to several types of liquidity and therefore can display several levels on the graph.. It is a unique tool that can help you very well in your trading The indicator is suitable for currency pairs with the most liquidity (EURUSD/GBPUSD...)

Indicator : RealValueIndicator Description : RealValueIndicator is a powerful tool designed specifically for trading on the EURUSD pair. This indicator analyzes all EUR and USD pairs, calculates their real currency strength values, and displays them as a single realistic value to give you a head start on price. This indicator will tell you moves before they happen if you use it right. RealValueIndicator allows you to get a quick and accurate overview of the EURUSD currency pair tops and bottoms,

AVVISO DI ACQUISTO E VENDITA MULTIVALUTA e MULTITIMEFRAME. AUTO TAILING STOP E RISCHIO PREMIO TAKEPROFIT! L'INDICATORE SCANSIONA E ANALIZZA IL MERCATO COSÌ NON HAI NULLA DA FARE! SCAMBIA TUTTE LE TUE VALUTE SU 1 TABELLA!
Dopo l'acquisto lascia un commento contattami e ti invierò l'assistente commerciale EA.
L'indicatore utilizza diversi oscillatori e filtri allegati per trovare i migliori punti di ingresso CONFERMATI, quindi non devi preoccuparti di questo! Ti avviserà e disegnerà un pu

このインディケータはボリンジャーバンドを裁量およびEAで実際に利用してきた私自身の経験から、より手軽に、かつ効果的に活用できるよう作成された裁量トレード用サインツールです。 ブレイクアウトでの順張り、リバウンドでの逆張りの両面で利用でき、各種のフィルター機能でより精度の高いサインを発信します 勝敗判定機能により、このインディケータの直近の相場環境に対する有効性を確認できます 全通貨ペア、全タイムフレームで利用できます。リペイントはしません
設定項目は以下の通りです。 Bollinger Bands Period
Bollinger Bands Deviation
Bollinger Bands Shift
Entry Mode ...ボリンジャーバンドにタッチしてからのBreakout(順張り), Rebound(逆張り)のどちらかを指定 Plus Filter ...独自アルゴリズムによるフィルターでシグナルの精度を高めます(Reboundモード専用) Trend Filter ...下で設定する移動平均のトレンド方向でのシグナルに限定します Moving Aver

L'indicatore Spread Pulse è uno strumento efficace che fornisce ai trader informazioni sullo spread corrente sul grafico. Lo spread è la differenza tra il prezzo di acquisto e il prezzo di vendita di uno strumento.
L'indicatore è presentato sotto forma di testo visualizzato sul grafico. Ciò consente al trader di monitorare facilmente lo spread corrente.
Uno dei principali vantaggi dell'indicatore Spread Pulse è la sua visualizzazione a colori. A seconda della dimensione dello spread, il
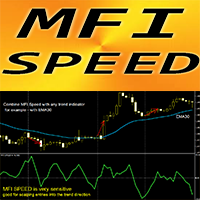
Forex Indicator "MFI Speed" for MT4 The calculation of this indicator is based on equations from physics . MFI Speed is the 1st derivative of MFI itself Money Flow Index (MFI) is a technical oscillator which uses price and volume data for identifying oversold and overbought zones
MFI Speed is good for scalping momentum entries into the direction of main trend Use it in combination with suitable trend indicator , for example standard EMA (as on pictures) MFI Speed indicator

"Adjustable Fractals" - is an advanced version of fractal indicator, very useful trading tool! As we know Standard fractals mt4 indicator does not have settings at all - this is very inconvenient for traders Adjustable Fractals has resolved that issue - it has all necessary settings: Adjustable period of indicator (recommended values - above 7) Adjustable distance from Highs/Lows of price Adjustable design af fractal arrows // More great Expert Advisors and Indicators are available he

Trop is a trend indicator that has several important advantages. It helps to pinpoint both new and existing trends in the market. One of its key advantages is its quick adjustment and responsiveness to changes in schedule. The effectiveness of the indicator depends on the set CalcBars period. The longer this period, the smoother the indicator displays the trend line. On the other hand, as the period decreases, the indicator takes into account more market noise, which can be useful in generating

Trend Filter Pro
Trend filter indicator.
Very good filter for your trading system, I recommend to use it together with - System Trend Pro and Professional Trade Arrow
The indicator no repaint!!!
Settings:
Change the Period parameter for better filtering ( default is 90)
Any questions? Need help?, I am always happy to help, write me in private messages or
In Telegram: https://t.me/Trader35_Admin
FREE

Adaptive Market Dynamics Indicator (AMDI) is an innovative tool for traders across all financial markets. This indicator is designed to provide traders with a deep understanding of market dynamics and adaptive trading signals based on current market conditions. Key Features and Benefits: Adaptive Analytics : AMDI can automatically adapt to changing market conditions, allowing traders to effectively adjust their strategies in real-time. Multifactor Analysis : The indicator offers a comprehensiv

In the world of trading, one of the main concerns is finding a reliable trading system. Meet the TrendEdge Channel indicator - your reliable companion in this search. Developed based on complex mathematical calculations, this indicator predicts the most likely short-term price movements.
TrendEdge Channel is designed specifically to identify trends in price movements. Thanks to it, you can quickly determine not only the direction of the trend, but also the levels of interaction between buyers

This indicator is a simple trend line indicator.
The upper trend line is the highest price of 60 past candlesticks, the highest price of 30 past candlesticks,
The bottom line is the trend line that connects the lowest price of 60 past candlesticks and the lowest price of 30 past candlesticks.
*The color of the trend line is white.
Notes
This indicator is created with the above configuration, so if the highest and lowest prices of the past 60 candlesticks and 30 candlesticks are the s
FREE
This indicator collects and organizes spread data. It is an organic add-on to my news robot, ExpertNews , which can be downloaded here .
You can also watch a video about news trading using the ExpertNews robot. It is available on youtube .
Unfortunately, it is not possible to place the robot in the mql5.com store, because the automatic validation of ExpertNews by the mql5 service ends in failure. In reality, there are no errors in the robot.
Testing fails due to the fact that the advisor
FREE

This indicator shows the strength of each currency compared to the US dollar by calculating the rate of change in price over a specified time period. When you open the indicator, you'll see a list of different currencies on the price chart. Each currency will have a numerical value indicating its strength level compared to the US dollar, where: If the value is higher than the US dollar, it will be displayed in green, meaning that currency is stronger than the dollar. If the value is lower than
FREE

OVERVIEW
K-means is a clustering algorithm commonly used in machine learning to group data points into distinct clusters based on their similarities. While K-means is not typically used directly for identifying support and resistance levels in financial markets, it can serve as a tool in a broader analysis approach.
Support and resistance levels are price levels in financial markets where the price tends to react or reverse. Support is a level where the price tends to stop falling
'Zoro LITE' is a reversal strategy based MT4 indicator with advance pre-alert system. Its an 100% non repaint indicator with an average accuracy of about 70-95% in a ranging market. --------------------------------------------------------- Features: Neural Network based Advance price action algorithms Pre-alert (get ready) signals Non-delay indications 24/7 signals OTC markets supported Auto-trading supported 100% Non repaint 100% No lag No recalculating Lifetime license -----------------------
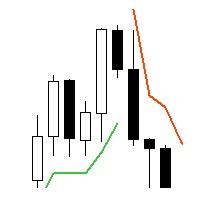
Supertrend - невероятно мощный и универсальный индикатор, предназначенный для помощи трейдерам в определении текущего тренда на конкретном торговом инструменте. С помощью двух встроенных индикаторов, Average True Range и Standard Deviation, трейдеры могут выбрать наиболее подходящий индикатор для своей стратегии торговли. Пользователи также могут настроить период этих индикаторов и выбрать цену (Close, High, Low, Open, Weighted), к которой он должен быть применен, с Typical price в качестве опци

Innanzitutto, vale la pena sottolineare che questo indicatore di trading non è repaint, non è ridisegno e non presenta ritardi, il che lo rende ideale sia per il trading manuale che per quello automatico. Manuale utente: impostazioni, input e strategia. L'Analista Atomico è un indicatore di azione del prezzo PA che utilizza la forza e il momentum del prezzo per trovare un miglior vantaggio sul mercato. Dotato di filtri avanzati che aiutano a rimuovere rumori e segnali falsi, e aumentare il pote

This indicator is unstoppable when combined with our other indicator called Katana. After purchase, send us a message and you could get Katana for FREE as a BONUS After purchase, send us a private message for your instructions.
MT5 version: click here
$55 for a limited time!
The Trend Forecasting indicator is a very unique & easy tool that is able to make prediction about future price movement based on the signals generated by MACD . It helps you have an estimation on the areas t

Thise indicator is up down v6 comes with tradingwiev pinescript. purchased people, after installed on terminal ,contact me on mql5 to get BONUS TradingView pinescript.
up-down indicator is no repaint and works all pairs and lower than weekly time frames charts. it is suitable also 1 m charts for all pairs. and hold long way to signal. dont gives too many signals. when red histogram cross trigger line that is up signal.and price probably will down when blue histogram cross trigger line that

System Trend Pro - This is the best trend trading indicator!!!
The indicator no repaint!!! The indicator has MTF mode, which adds confidence to trading on the trend ( no repaint ). How to trade? Everything is very simple, we wait for the first signal (big arrow), then wait for the second signal (small arrow) and enter the market in the direction of the arrow.
(See screens 1 and 2.) Exit on the opposite signal or take 20-30 pips, close half of it, and keep the rest until the oppo

SmartSignal Sniper: Il Tuo Compagno di Trading Definitivo Scopri il potere del trading preciso con SmartSignal Sniper. Progettato per fornire segnali di acquisto e vendita precisi, questo strumento avanzato consente ai trader di tutti i livelli di navigare nei mercati finanziari con fiducia e chiarezza. Principali Caratteristiche: Precisione Millimetrica: SmartSignal Sniper utilizza algoritmi avanzati per fornire segnali di acquisto e vendita precisi, aiutando i trader a individuare opportunità
L'indicatore per il trading sul mercato Forex e le Opzioni Binarie è scritto sulla base dell'indicatore standard MT4 della media mobile semplice. Ma la differenza dall'indicatore standard è che le sue linee sono ridipinte in colori diversi a seconda dello Stato della tendenza. Se il colore è verde, la tendenza per l'acquisto. Se rosso, poi in vendita. Durante il cambiamento di fase di tendenza, viene visualizzato un avviso sonoro insieme a un buffer sul grafico al centro delle linee. Pertanto, è
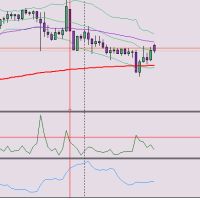
quante volte è il range della candela proporzionato all'atr?
QUESTO è L'INDICATORE DI CUI AVEVI BISOGNO!!!
ti aiuterà a capire meglio il mercato con informazioni utili. fammi sapere nei commenti se ti piace l'indicatore e fammi sapere se ci sono migliorie che posso applicare, sarò felice di apportarle!
l'indicatore restituisce un rapporto tra RANGE e ATR.

The Practitioner indicator is based on a unique algorithm for analyzing price behavior and presents the result of this complex work in the form of lines. One of the advantages of this indicator is that it automatically changes the color of the line according to the current direction of the price movement.
It is important to note that the indicator has an option to enable alerts when the line color changes. This gives the trader the opportunity to quickly respond to changes and identify new tr

The " YK Find Support And Resistance " indicator is a technical analysis tool used to identify key support and resistance levels on a price chart. Its features and functions are as follows:
1. Displays support and resistance levels using arrow lines and colored bands, with resistance in red and support in green.
2. Can be adjusted to calculate and display results from a specified timeframe using the forced_tf variable. If set to 0, it will use the current timeframe of the chart.
3. Uses t
FREE

Overview
The Volume SuperTrend AI is an advanced technical indicator used to predict trends in price movements by utilizing a combination of traditional SuperTrend calculation and AI techniques, particularly the k-nearest neighbors (KNN) algorithm.
The Volume SuperTrend AI is designed to provide traders with insights into potential market trends, using both volume-weighted moving averages (VWMA) and the k-nearest neighbors (KNN) algorithm. By combining these approaches, the indicat
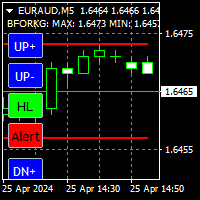
Very useful indicator, you won't be able to be without it. Essential for scalping. It shows rebound levels, top and bottom, forming a fork that surrounds the price. Each level has two blue controls associated to change it, has one green control for rebound mode: High/Low or Open/Close, and has a red breakage alert control. The values of each level, and the distance between levels in pips, are shown at the top left. Features: -T wo independent modes of operation: High/Low, Open/Close. -When on

UPDATED VERSION INCORPERATES FIBONACCI FOR BETTER LEVELS AI Powered Price Clustering" is a custom indicator that integrates k means and Fibonacci. This powerful tool provides traders with valuable insights into price clustering patterns, facilitating more informed trading decisions. How it works: With "AI Powered Price Clustering," traders gain access to: A K means algorithm for precise analysis of price clustering patterns. Identification of key Fibonacci levels and centroids for enhanced tech

The RSI Advanced tool will help traders capture trends and optimal entry points by:
- Enter a Buy order when the green line crosses the yellow line. Provided that the yellow line is near line 32 or 20 - Enter a Sell order when the green line crosses the yellow line. Provided that the yellow line is near line 68 or 80
Additionally, you can combine it with the convergence divergence that occurs at the green line. **When you purchase the Mastering the RSI MT4 or Mastering the RSI MT5 indicator
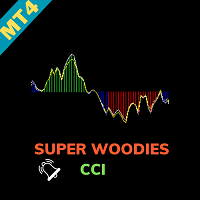
Super Woodies CCI Indicator - Enhance Your Trading Precision Step into the realm of precision trading with the "Super Woodies CCI Indicator" for MetaTrader 4. This advanced tool, inspired by Woodie's CCI, is designed to provide you with clear insights into market trends, enabling you to make well-informed trading decisions. Basic Details : Indicator Type : Super Woodies CCI Indicator Key Metrics : Real-time CCI (Commodity Channel Index) analysis for price trends. Customization : Fully customizab

This powerful tool combines the Zigzag algorithm with Fibonacci retracement levels, enhancing your trading experience in the MetaTrader 4 (MT4) platform. Zigzag with Fibo Indicator Time Frame :- 1H and above The Zigzag with Fibo Indicator is designed to identify trend direction and provide precise entry and exit points for forex trading. Here’s what makes it stand out: Zigzag Algorithm Integration : The indicator utilizes the Zigzag algorithm, which helps filter out market noise and highligh
FREE

Indicator Name: TrendMaster Description: TrendMaster is a powerful NONREPAINT Trading indicator designed to identify and capitalize on market trends with high accuracy. By analyzing a combination of technical indicators including Relative Strength Index (RSI), Stochastic Oscillator, and Average Directional Index (ADX), TrendMaster provides clear buy and sell signals, helping traders navigate both bullish and bearish market conditions. The indicator's advanced algorithm filters out noise and fals

The EntryHub system by MQ4.org is designed for Forex trading and is available as an indicator for the popular MetaTrader 4 (MT4) platform. Let’s delve into its details: Forex Entry Point System : The Forex Entry Point System is an MT4 indicator that assists traders in identifying potential entry points for their trades. It provides signals based on specific market conditions, helping traders make informed decisions. While it’s essential to note that no indicator is fo
Sei pronto a portare il tuo trading al livello successivo? Presentazione WH Divergenza Pro MT4 ,
un indicatore di divergenza avanzato che ti consente di scegliere tra una varietà di indicatori tecnici popolari.
Ora puoi personalizzare i tuoi segnali di divergenza per adattarli alla tua strategia di trading unica. Contattami dopo l'acquisto per guidarti attraverso i processi Caratteristiche principali :
Selezione dell'indicatore : scegli il tuo indicatore preferito tra le s

Step into the realm of Forex trading with confidence and precision using XQ, a cutting-edge Forex indicator designed to elevate your trading game to unprecedented heights. Whether you're a seasoned trader or just stepping into the world of currency exchange, XQ Forex Indicator empowers you with the insights and signals needed to make informed trading decisions. The signal conditions are a combination of three indicators, and XQ Forex Indicator only display medium and long-term trends . The
L'indicatore di segnale Space signals è il mio nuovo sviluppo per il trading nei mercati FOREX e delle opzioni binarie. L'algoritmo dell'indicatore è registrato in modo che rintracci la tendenza e segnali alla fine del movimento correttivo dei Prezzi.
Nelle impostazioni, puoi impostare tu stesso il periodo dei segnali. Maggiore è il valore nella variabile "periodo", più rari saranno i segnali. Ma saranno naturalmente di qualità superiore.
Puoi anche selezionare i codici delle frecce sul gr

This indicator is based on the mathematics of the great trader W.D. Ganna. With its help, you can easily find strong levels by analyzing swings to find the optimal entry point. The indicator works on all instruments and all timeframes. The indicator is fully manual and has control buttons. All you need to do is press the NEW button, a segment will appear, which you can place on any movement, swing or even 1 candle that you want to analyze. By placing the segment, press the OK button. A grid (th

Extreme Value Sniper is a detrended price indicator Indicator finds the potential reversal levels by checking value ranges and price cycles. ***Indicator does NOT repaint so it provides accurate NO REPAINT REVERSAL SIGNALS***
MT5 Version of the product : https://www.mql5.com/en/market/product/114550
It shows the overbought and oversold levels using the average range. Overbought Levels are between 4 and 10 Oversold levels are bewtween -4 and -10
Those levels can be used as a reversal l
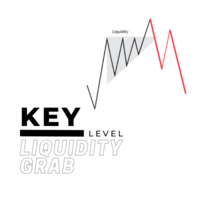
For a bullish move to occur for example, there should be alot of buying power. but you cannot buy if there is no sell on the other side, so the big players usually tend to manipulate the market in order to create available positions on the other side and be able to open their positions and one of the ways is by creating a fake breakout/ a liquidity grab. Before majority of big reversal moves and trends are formed, a liquidty grab would have occured in order to have enough orders to push for the

This indicator is, without a doubt, the best variation of the Gann Angles among others. It allows traders using Gann methods to automatically calculate the Gann angles for the traded instrument. The scale is automatically calculated when the indicator is attached to the chart. When switching timeframes, the indicator recalculates the scale for the current timeframe. Additionally, you can enter your own scales for the Gann angles. You can enter your own scales either for both vectors or for each
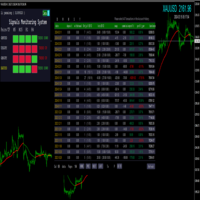
MT4 multi-variety multi-period signal monitoring system
Load to the indicators folder
Recommended loading chart: GBPUSD/XAUUSD/GBPJPY/USDJPY
Recommended loading period: M5/M15/H1/H4
Select all history by account history
- Statistics: Date, deposit, withdrawal, total number of transactions, number of transactions - long, number of transactions - short, total number of transactions, number of transactions - long, number of transactions - short, interest, commission, profit and loss, pro

The " Vertical Levels " indicator for the Forex market is a tool for displaying vertical levels on a price chart. These levels can be useful for a trader, as they help identify significant points in price movement and potential reversal or trend continuation zones.
Peculiarities:
Vertical Levels: The "Vertical Levels" indicator allows you to display vertical lines on the chart, indicating certain levels. These levels can be adjusted using input parameters. Setting options: Length : Length o

Download the free version here. Divergence Divergence refers to when the price of a currency pair moves in one direction while the trend indicator is moving in the opposite direction. With divergence, there can be positive and negative signals. Divergences in Forex trading are quite common signals of technical analysis. These are basic early Forex signals indicating the trend reversal and filter false signals. Application of this indicator It is usually not easy to detect divergences by the t
FREE

The indicator analyzes the chart as a mathematical function with X-time and Y-price axes. Time is presented in bars, price in pips. The purpose of the analysis is to give the user a signal to action at the moment when the function forms a recoilless movement in one direction over a certain period of time. The indicator parameters must be selected for each currency pair, since the price function is formed differently for each currency pair.
Shows favorable moments for entering the market with

The Avia indicator analyzes the chart as a mathematical function with X-time and Y-price axes. Time is represented in bars and price in pips. The purpose of this indicator is to give the trader a signal to act at the moment when the function forms a recoilless movement in one direction over a certain period of time. Here are the main characteristics and settings of this indicator:
Peculiarities: Non-rebound movement : The Avia indicator looks for moments when the price moves in one direction

SPREADEX e' un indicatore per MT4 e MT5 che indica la distanza dell'ASSET dal GP. il GP e' il prezzo del vero valore dell'ASSET sottostante ottenuto per stima. Il GP e' come una calamita, attira il prezzo dell'ASSET con alta probabilita' ed all'interno della stessa giornata di trading. Quindi SPREADEX indica quali sono gli asset piu distanti dal GP al momento in tempo reale. Fornendo un punto di vista al TRADER su quali asset concentrarsi e cercare eventuali segnali di inversione dei prezzi per
FREE

Download the free version here.
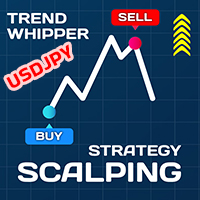
A Full Concept of BUY/SELL Scalping Strategy Trend detection is one of the basic challenges of every trader. Finding a way to tell when to enter a trade is very important, timing is a game changer, not too early and not too late. Sometimes, due to not knowing the market conditions, the trader closes his positions with a small profit or allows the losses to grow, these are the mistakes that novice traders make. Indicator Trend Whipper is a complete trading st
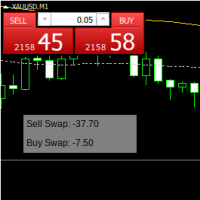
showSwap is a simple indicator. shows SWAP on the instrument chart for this instrument. You can specify the magic of the instrument, if 0, then that’s it. as well as the coordinates of the indicator panel on the chart. In forex trading, SWAPs can be either positive or negative depending on the interest rate differential between the two currencies involved in the trade. Traders may either receive or pay SWAPs depending on whether they are holding a position past a certain time (usually at the end
FREE

Download the free USDJPY version here.
MACD Indicator The Moving Average Convergence and Divergence (MACD) is a trend following momentum indicator which shows the relationship between two moving averages that we chose and configure them on the indicator. The MACD is calculated by subtracting the 26-period exponential moving average and the 12 period D.A.M. These are the default parameters when you put the MACD indicator on the charts, and the period is usually 9 which means the last 9 candle
FREE

Our support and resistance levels help to determine the reversal of the market price, fully track the trend, and also fix the profits in a timely manner. Support and resistance levels can also determine trading ranges. When you hover your mouse over the upper right corner of a level, a hint with a description of the level pops up. To avoid cluttering the chart, levels disappear after breaking through.
Input parameters: WPR_Period = WPR period UpLevel = WPR top l
Download the free version here.
A Full Concept of BUY/SELL Scalping Strategy Trend detection is one of the basic challenges of every trader. Finding a way to tell when to enter a trade is very important, timing is a game changer, not too early and not too late. Sometimes, due to not knowing the market conditions, the trader closes his positions with a small profit or allows the losses to grow, these are the mistakes that novice traders make. Indicator Trend Whipper is a complete trading st
FREE

The Inversion Fair Value Gaps (IFVG) indicator is based on the inversion FVG concept by ICT and provides support and resistance zones based on mitigated Fair Value Gaps (FVGs). Image 1
USAGE Once mitigation of an FVG occurs, we detect the zone as an "Inverted FVG". This would now be looked upon for potential support or resistance.
Mitigation occurs when the price closes above or below the FVG area in the opposite direction of its bias. (Image 2)
Inverted Bullish FVGs Turn into P
Download the free USDJPY version here.
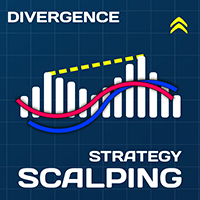
MACD Indicator The Moving Average Convergence and Divergence (MACD) is a trend following momentum indicator which shows the relationship between two moving averages that we chose and configure them on the indicator. The MACD is calculated by subtracting the 26-period exponential moving average and the 12 period D.A.M. These are the default parameters when you put the MACD indicator on the charts, and the period is usually 9 which means the last 9 candle
Download the USDJPY free version here.
Scalping Strategy
BUY SELL
Having a strategy in the market is one of the main conditions for trading. The presence of various and complicated indicators and tools sometimes makes trading difficult, and the user gets confused after trying various methods and gets stuck in a loss cycle, the result of which is usually clear. This indicator is a simple strategy based on the detection of pivots and short-term trends, which helps you to easily trade i
FREE
Sai perché MetaTrader Market è il posto migliore per vendere strategie di trading e indicatori tecnici? Non c'è bisogno di pubblicità o di protezione del software, nessun problema di pagamento. Tutto ciò è fornito da MetaTrader Market.
Ti stai perdendo delle opportunità di trading:
- App di trading gratuite
- Oltre 8.000 segnali per il copy trading
- Notizie economiche per esplorare i mercati finanziari
Registrazione
Accedi
Se non hai un account, registrati
Consenti l'uso dei cookie per accedere al sito MQL5.com.
Abilita le impostazioni necessarie nel browser, altrimenti non sarà possibile accedere.