
Reversal patterns: Testing the Double top/bottom pattern
Contents
- Introduction
- 1. Theoretical aspects of the pattern formation
- 2. Pattern trading strategy
- 3. Creating the EA
- 4. Testing the strategy
- Conclusion
Introduction
The analysis conducted in the article "How long is the trend?", shows that the price remains in trend for 60% of the time. This means opening a position at the beginning of a trend yields the best results. The search for trend reversal points has generated a large number of reversal patterns. The Double top/bottom is one of the most well-known and frequently used ones.
1. Theoretical aspects of the pattern formation
The Double top/bottom pattern can be found frequently on a price chart. Its formation is closely connected with the theory of trade levels. The pattern is formed at the end of a trend when the price meets a support or resistance level (depending on the previous movement). After a correction during a repeated testing of the level, it rolls back again instead of breaking through it.
At this point, counter-trend traders come into play trading a roll-back from the level and pushing the price towards correction. While the correction movement gains momentum, traders following the trend start exiting the market by either fixing the profit or closing loss-making positions that were aimed at breaking through the level. That strengthens the movement even further leading to the emergence of a new trend.
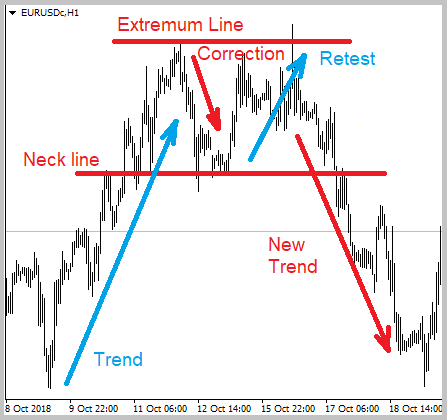
When searching for a pattern on a chart, there is no point in searching for the exact match of tops/bottoms. Deviation of top/bottom levels is considered normal. Just make sure the peaks are within the same support/resistance level. The pattern reliability depends on a strength of a level it is based on.
2. Pattern trading strategy
The pattern popularity gave rise to multiple strategies involving it. On the Internet, there are at least three different entry points for trading this pattern.
2.1. Case 1
The first entry point is based on the neckline breakthrough. A stop loss is set beyond the top/bottom line. There are different approaches to defining "the neckline breakthrough". Traders may use a bar closing under the neckline, as well as the one that breaks through the neckline for a fixed distance. Both approaches have their pros and cons. In case of a sharp movement, a candle may be closed at a sufficient distance from the neckline making the pattern inefficient.
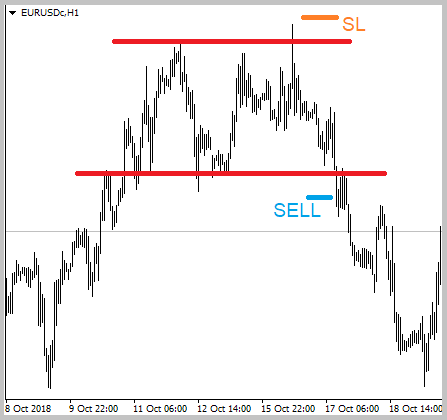
The drawback of this approach is a relatively high stop loss level, which reduces the profit/risk ratio of the strategy used.
2.2. Case 2
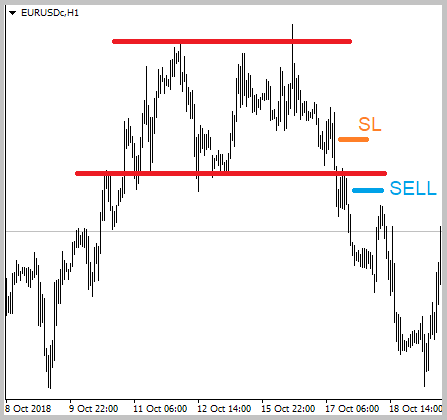
The second entry point is based on the theory of mirror levels, when the neckline turns into resistance from support and vice versa. Here the entry is made when the price rolls back to the neckline after it has been broken through. In this case, a stop loss is set beyond the extremum of the last correction significantly reducing the stop loss level. Unfortunately, the price does not always test the neckline after breaking it through, thus reducing the number of entries.
2.3. Case 3
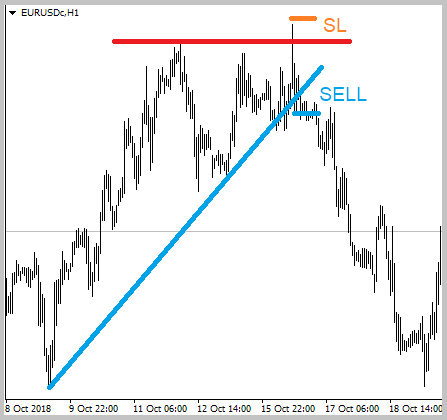
The third entry point is based on the trend theory. It is defined by a breakthrough of the trend line built from the movement start point up to the neckline extremum. As in the first case, a stop loss is set beyond the top/bottom line. An early entry provides a lower stop loss level in comparison to the first entry point. It also provides more signals compared to the second case. At the same time, such an entry point gives more false signals, since a channel may form between the extremum lines and the neck, or there may be the pennant pattern. Both cases indicate the trend continuation.
All three strategies instruct to exit at the level equal to the distance between an extremum and a neckline.
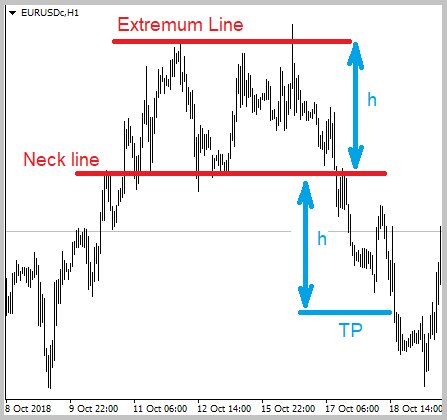
Also, when determining the pattern on the chart, you should note that the double top/bottom should clearly stand out from the price movement. When describing the pattern, a restriction is often added: there should be at least six bars between two tops/bottoms.
Moreover, since the pattern formation is based on the theory of price levels, pattern trading should not contradict it. Therefore, based on the intended purpose, the neckline should not be lower than the Fibo level 50 of the initial movement. In addition, in order to filter out false signals, we may add a minimum level of the first correction (forming the neckline) as an indicator of the price level strength.
3. Creating the EA
3.1. Searching for extremums
We will start developing the EA from the pattern search block. Let's use ZigZag indicator from the MetaTrader 5 standard delivery to search for price extremums. Move the indicator calculation part to the class as described in the article [1]. The indicator contains two indicator buffers containing price value in extremum points. The indicator buffers contain empty values between extremums. In order not to create two indicator buffers containing multiple empty values, they were replaced by an array of structures containing information about the extremum. The structure for storing information about the extremum looks as follows.
   struct s_Extremum
     {
      datetime          TimeStartBar;
      double            Price;

      s_Extremum(void)  :  TimeStartBar(0),
                           Price(0)
         {
         }
      void Clear(void)
        {
         TimeStartBar=0;
         Price=0;
        }
     };
If you used ZigZag indicator at least once, you know how many compromises you have to make when searching for optimal parameters. Too small parameter values divide a big movement into small parts, while too big parameter values skip short movements. The algorithm for searching graphical patterns is very demanding as of quality of finding extremums. While trying to find a middle ground, I decided to use the indicator with small parameter values and create an additional superstructure combining unidirectional movements with short corrections into one movement.
The CTrends class has been developed to solve this issue. Class header is provided below. During the initialization, a reference to the indicator class object and the minimum movement value considered as a trend continuation are passed to the class.
class CTrends : public CObject
  {
private:
   CZigZag          *C_ZigZag;         // Link to the ZigZag indicator object
   s_Extremum        Trends[];         // Array of extremums
   int               i_total;          // Total number of saved extremums
   double            d_MinCorrection;  // Minimum movement value for trend continuation

public:
                     CTrends();
                    ~CTrends();
//--- Class initialization method
   virtual bool      Create(CZigZag *pointer, double min_correction);
//--- Get info on the extremum
   virtual bool      IsHigh(s_Extremum &pointer) const;
   virtual bool      Extremum(s_Extremum &pointer, const int position=0);
   virtual int       ExtremumByTime(datetime time);
//--- Get general info
   virtual int       Total(void)          {  Calculate(); return i_total;   }
   virtual string    Symbol(void) const   {  if(CheckPointer(C_ZigZag)==POINTER_INVALID) return "Not Initilized"; return C_ZigZag.Symbol();  }
   virtual ENUM_TIMEFRAMES Timeframe(void) const   {  if(CheckPointer(C_ZigZag)==POINTER_INVALID) return PERIOD_CURRENT; return C_ZigZag.Timeframe();  }

protected:
   virtual bool      Calculate(void);
   virtual bool      AddTrendPoint(s_Extremum &pointer);
  };
To get data on extremums, the following methods are provided in the class:
- ExtremumByTime — get the extremum number in the database for a specified time,
- Extremum — return extremum at a specified position in the database,
- IsHigh — return true if a specified extremum is a top and false if it is a bottom.
The general information block features methods returning the total number of saved extremums, used symbol and timeframe.
The main class logic is implemented in the Calculate method. Let's take a closer look at it.
At the beginning of the method, check the relevance of the reference to the indicator class object and the presence of extremums found by the indicator.
bool CTrends::Calculate(void)
  {
   if(CheckPointer(C_ZigZag)==POINTER_INVALID)
      return false;
//---
   if(C_ZigZag.Total()==0)
      return true;
Next, define the number of unprocessed extremums. If all extremums are processed, exit the method with the true result.
   int start=(i_total<=0 ? C_ZigZag.Total() : C_ZigZag.ExtremumByTime(Trends[i_total-1].TimeStartBar));
   switch(start)
     {
      case 0:
        return true;
        break;
      case -1:
        start=(i_total<=1 ? C_ZigZag.Total() : C_ZigZag.ExtremumByTime(Trends[i_total-2].TimeStartBar));
        if(start<0 || ArrayResize(Trends,i_total-1)<=0)
          {
           ArrayFree(Trends);
           i_total=0;
           start=C_ZigZag.Total();
          }
        else
           i_total=ArraySize(Trends);
        if(start==0)
           return true;
        break;
     }
After that, request the necessary amount of extremums from the indicator class.
   s_Extremum  base[];
   if(!C_ZigZag.Extremums(base,0,start))
      return false;
   int total=ArraySize(base);
   if(total<=0)
      return true;
If there have been no extremums in the database up to this time, add the oldest extremum to the database by calling the AddTrendPoint method.
   if(i_total==0)
      if(!AddTrendPoint(base[total-1]))
         return false;
Next, arrange the loop with iteration over all downloaded extremums. Previous extremums before the last saved one are skipped.
   for(int i=total-1;i>=0;i--)
     {
      int trends_pos=i_total-1;
      if(Trends[trends_pos].TimeStartBar>=base[i].TimeStartBar)
         continue;
In the next step, check if the extreme points are unidirectional. If a new extremum re-draws the previous one, update the data.
      if(IsHigh(Trends[trends_pos]))
        {
         if(IsHigh(base[i]))
           {
            if(Trends[trends_pos].Price<base[i].Price)
              {
               Trends[trends_pos].Price=base[i].Price;
               Trends[trends_pos].TimeStartBar=base[i].TimeStartBar;
              }
            continue;
           }
For oppositely directed extreme points, check whether the new movement is a continuation of a previous trend. If yes, update data on extremums. If no, add data on the extremum by calling the AddTrendPoint method;
         else
           {
            if(trends_pos>1 && Trends[trends_pos-1].Price>base[i].Price  && Trends[trends_pos-2].Price>Trends[trends_pos].Price)
              {
               double trend=fabs(Trends[trends_pos].Price-Trends[trends_pos-1].Price);
               double correction=fabs(Trends[trends_pos].Price-base[i].Price);
               if(fabs(1-correction/trend)>d_MinCorrection)
                 {
                  Trends[trends_pos-1].Price=base[i].Price;
                  Trends[trends_pos-1].TimeStartBar=base[i].TimeStartBar;
                  i_total--;
                  ArrayResize(Trends,i_total);
                  continue;
                 }
              }
            AddTrendPoint(base[i]);
           }
        }
The full code of all classes and their methods is available in the attachment.
3.2. Pattern search
After defining the price extremums, build the block for searching market entry points. Divide this work into two sub-steps:
- Search for a potential market entry pattern.
- Market entry point.
This functionality is assigned to the CPttern class. Its header is provided below.
class CPattern : public CObject
  {
private:
   s_Extremum     s_StartTrend;        //Trend start point
   s_Extremum     s_StartCorrection;   //Correction start point
   s_Extremum     s_EndCorrection;     //Correction end point
   s_Extremum     s_EndTrend;          //Trend completion point
   double         d_MinCorrection;     //Minimum correction
   double         d_MaxCorrection;     //Maximum correction
//---
   bool           b_found;             //"Pattern detected" flag
//---
   CTrends       *C_Trends;
public:
                     CPattern();
                    ~CPattern();
//--- Class initialization
   virtual bool      Create(CTrends *trends, double min_correction, double max_correction);
//--- Methods for searching the pattern and entry points
   virtual bool      Search(datetime start_time);
   virtual bool      CheckSignal(int &signal, double &sl, double &tp1, double &tp2);
//--- Method of comparing the objects
   virtual int       Compare(const CPattern *node,const int mode=0) const;
//--- Methods of getting data on the pattern extremums
   s_Extremum        StartTrend(void)        const {  return s_StartTrend;       }
   s_Extremum        StartCorrection(void)   const {  return s_StartCorrection;  }
   s_Extremum        EndCorrection(void)     const {  return s_EndCorrection;    }
   s_Extremum        EndTrend(void)          const {  return s_EndTrend;         }
   virtual datetime  EndTrendTime(void)            {  return s_EndTrend.TimeStartBar;  }
  };
The pattern is defined using four adjacent extremums. The data on them are saved in the s_StartTrend, s_StartCorrection, s_EndCorrection and s_EndTrend strcutures. To identify the pattern, we will also need minimum and maximum correction levels that will be stored in the d_MinCorrection and d_MaxCorrection variables. We will obtain extremums from the instance of the previously created CTrends class.
During the class initialization, we pass the pointer to the CTrends class object and boundary correction levels. Inside the method, check the validity of the passed pointer, save the received information and clear the structures of the extremums.
bool CPattern::Create(CTrends *trends,double min_correction,double max_correction)
  {
   if(CheckPointer(trends)==POINTER_INVALID)
      return false;
//---
   C_Trends=trends;
   b_found=false;
   s_StartTrend.Clear();
   s_StartCorrection.Clear();
   s_EndCorrection.Clear();
   s_EndTrend.Clear();
   d_MinCorrection=min_correction;
   d_MaxCorrection=max_correction;
//---
   return true;
  }
The search for potential patterns is to be performed in the Search() method. This method in the parameters receives search start date and returns the logic value informing of search results. Let's consider the method algorithm in detail.
First, check the relevance of the pointer to the CTrends class object and the presence of saved extremums. In case of a negative result, exit the method with the false result.
bool CPattern::Search(datetime start_time)
  {
   if(CheckPointer(C_Trends)==POINTER_INVALID || C_Trends.Total()<4)
      return false;
Next, define the extreme point corresponding to the date specified in the inputs. If no extremum is found, exit the method with the false result.
   int start=C_Trends.ExtremumByTime(start_time);
   if(start<0)
      return false;
Next, arrange the loop for iterating over all extremums starting with the specified date and up to the last detected one. First, we obtain four consecutive extremums. If at least one of the extremums is not obtained, move to the next extremum.
   b_found=false;
   for(int i=start;i>=0;i--)
     {
      if((i+3)>=C_Trends.Total())
         continue;
      if(!C_Trends.Extremum(s_StartTrend,i+3) || !C_Trends.Extremum(s_StartCorrection,i+2) ||
         !C_Trends.Extremum(s_EndCorrection,i+1) || !C_Trends.Extremum(s_EndTrend,i))
         continue;
At the next stage, check if extremums correspond to the necessary pattern. If they do not, move to the next extremums. If the pattern is detected, set the flag to true and exit the method with the same result.
      double trend=s_StartCorrection.Price-s_StartTrend.Price;
      double correction=s_StartCorrection.Price-s_EndCorrection.Price;
      double re_trial=s_EndTrend.Price-s_EndCorrection.Price;
      double koef=correction/trend;
      if(koef<d_MinCorrection || koef>d_MaxCorrection || (1-fmin(correction,re_trial)/fmax(correction,re_trial))>=d_MaxCorrection)
         continue;
      b_found= true;
//---
      break;
     }
//---
   return b_found;
  }
The next step is detecting the entry point. We will use the second case for that. To reduce the risk of the price not returning to the neckline, we will search for the signal confirmation at the lower timeframe.
To implement this functionality, let's create the CheckSignal() method. Apart from the signal itself, the method returns stop loss and take profit levels. Therefore, we are going to use pointers to the variables in the method parameters.
At the beginning of the method, check the flag for the presence of a previously detected pattern. If the pattern is not found, exit the method with the 'false' result.
bool CPattern::CheckSignal(int &signal, double &sl, double &tp1, double &tp2)
  {
   if(!b_found)
      return false;
Then, determine the time of closing the pattern formation candle and load the data of the timeframe we are interested in from the beginning of the pattern formation up to the current moment.
   string symbol=C_Trends.Symbol();
   if(symbol=="Not Initilized")
      return false;
   datetime start_time=s_EndTrend.TimeStartBar+PeriodSeconds(C_Trends.Timeframe());
   int shift=iBarShift(symbol,e_ConfirmationTF,start_time);
   if(shift<0)
      return false;
   MqlRates rates[];
   int total=CopyRates(symbol,e_ConfirmationTF,0,shift+1,rates);
   if(total<=0)
      return false;
After that, arrange the loop, in which we check the neckline breakthrough, candle correction and the candle closing beyond the neckline in the expected movement direction bar by bar.
I have added some more limitations here:
- The pattern is considered invalid if the price breaks through the level of tops/bottoms.
- The pattern is considered invalid if the price reaches the expected take profit level.
- A market entry signal is ignored if more than two candles have formed before opening the position since the signal activation.
   signal=0;
   sl=tp1=tp2=-1;
   bool up_trend=C_Trends.IsHigh(s_EndTrend);
   double extremum=(up_trend ? fmax(s_StartCorrection.Price,s_EndTrend.Price) : fmin(s_StartCorrection.Price,s_EndTrend.Price));
   double exit_level=2*s_EndCorrection.Price - extremum;
   bool break_neck=false;
   for(int i=0;i<total;i++)
     {
      if(up_trend)
        {
         if(rates[i].low<=exit_level || rates[i].high>extremum)
            return false;
         if(!break_neck)
           {
            if(rates[i].close>s_EndCorrection.Price)
               continue;
            break_neck=true;
            continue;
           }
         if(rates[i].high>s_EndCorrection.Price)
           {
            if(sl==-1)
               sl=rates[i].high;
            else
               sl=fmax(sl,rates[i].high);
           }
         if(rates[i].close<s_EndCorrection.Price || sl==-1)
            continue;
         if((total-i)>2)
            return false;
After detecting the market entry signal, specify the signal type ("-1" - sell, "1" - buy) and trading levels. A stop loss is set at the maximum correction depth relative to the neckline after it has been broken through. Set two levels for a take profit:
1. At 90% from the extremum line to the neckline in the position direction.
2. At 90% from the previous trend movement.
Add the limitation: the first take profit level cannot exceed the second one.
         signal=-1;
         double top=fmax(s_StartCorrection.Price,s_EndTrend.Price);
         tp1=s_EndCorrection.Price-(top-s_EndCorrection.Price)*0.9;
         tp2=top-(top-s_StartTrend.Price)*0.9;
         tp1=fmax(tp1,tp2);
         break;
        }
The full code of all classes and methods is available in the attachment.
3.3. Developing the EA
After the preparatory work, gather all blocks into a single EA. Declare external variable and divide them into three blocks:
- ZigZag indicator parameters;
- Parameters to search for patterns and entry points;
- Parameters for performing trading operations.
sinput   string            s1             =  "---- ZigZag Settings ----";     //---
input    int               i_Depth        =  12;                              // Depth
input    int               i_Deviation    =  100;                             // Deviation
input    int               i_Backstep     =  3;                               // Backstep
input    int               i_MaxHistory   =  1000;                            // Max history, bars
input    ENUM_TIMEFRAMES   e_TimeFrame    =  PERIOD_M30;                      // Work Timeframe
sinput   string            s2             =  "---- Pattern Settings ----";    //---
input    double            d_MinCorrection=  0.118;                           // Minimal Correction
input    double            d_MaxCorrection=  0.5;                             // Maximal Correction
input    ENUM_TIMEFRAMES   e_ConfirmationTF= PERIOD_M5;                       // Timeframe for confirmation
sinput   string            s3             =  "---- Trade Settings ----";      //---
input    double            d_Lot          =  0.1;                             // Trade Lot
input    ulong             l_Slippage     =  10;                              // Slippage
input    uint              i_SL           =  350;                             // Stop Loss Backstep, points
In the global variables, declare the array for storing pointers to pattern objects, the instance of trading operations class, the instance of the patterns searching class where the pointer to the processed class instance is to be stored and the variable for storing the next pattern search start time.
CArrayObj         *ar_Objects;
CTrade            *Trade;
CPattern          *Pattern;
datetime           start_search;
To enable the ability to set two take profits simultaneously, use the technology offered in the article [2].
Initialize all necessary objects in the OnInit() function. Since we never declared the CZigZag and CTrends class instances, we simply initialize them and add pointers to these objects to our array. In case of the initialization error, exit the function with the INIT_FAILED result at any of the stages.
int OnInit()
  {
//--- Initialize object array
   ar_Objects=new CArrayObj();
   if(CheckPointer(ar_Objects)==POINTER_INVALID)
      return INIT_FAILED;
//--- Initialize ZigZag indicator class
   CZigZag *zig_zag=new CZigZag();
   if(CheckPointer(zig_zag)==POINTER_INVALID)
      return INIT_FAILED;
   if(!ar_Objects.Add(zig_zag))
     {
      delete zig_zag;
      return INIT_FAILED;
     }
   zig_zag.Create(_Symbol,i_Depth,i_Deviation,i_Backstep,e_TimeFrame);
   zig_zag.MaxHistory(i_MaxHistory);
//--- Initialize the trend movement search class
   CTrends *trends=new CTrends();
   if(CheckPointer(trends)==POINTER_INVALID)
      return INIT_FAILED;
   if(!ar_Objects.Add(trends))
     {
      delete trends;
      return INIT_FAILED;
     }
   if(!trends.Create(zig_zag,d_MinCorrection))
      return INIT_FAILED;
//--- Initialize the trading operations class
   Trade=new CTrade();
   if(CheckPointer(Trade)==POINTER_INVALID)
      return INIT_FAILED;
   Trade.SetAsyncMode(false);
   Trade.SetDeviationInPoints(l_Slippage);
   Trade.SetTypeFillingBySymbol(_Symbol);
//--- Initialize additional variables
   start_search=0;
   CLimitTakeProfit::OnlyOneSymbol(true);
//---
   return(INIT_SUCCEEDED);
  }
Clear the instances of applied objects in the OnDeinit() function.
void OnDeinit(const int reason)
  {
//---
   if(CheckPointer(ar_Objects)!=POINTER_INVALID)
     {
      for(int i=ar_Objects.Total()-1;i>=0;i--)
         delete ar_Objects.At(i);
      delete ar_Objects;
     }
   if(CheckPointer(Trade)!=POINTER_INVALID)
      delete Trade;
   if(CheckPointer(Pattern)!=POINTER_INVALID)
      delete Pattern;
  }
As usual, the main functionality is implemented in the OnTick function. It can be divided into two blocks:
1. Checking market entry signals in the previously detected patterns. It is launched each time a new candle appears on a small timeframe of the search for the signal confirmation.
2. Searching for new patterns. It is launched each time a new candle appears on a working timeframe (specified for the indicator).
At the beginning of the function, check the presence of a new bar on an entry point confirmation timeframe. If the bar is not formed, exit the function until the next tick. It should be noted that this approach works correctly only if the timeframe for confirming an entry point does not exceed the working timeframe. Otherwise, instead of exiting the function, you will need to go to the pattern search block.
void OnTick()
  {
//---
   static datetime Last_CfTF=0;
   datetime series=(datetime)SeriesInfoInteger(_Symbol,e_ConfirmationTF,SERIES_LASTBAR_DATE);
   if(Last_CfTF>=series)
      return;
   Last_CfTF=series;
If a new bar appears, arrange the loop for checking all previously saved patterns for the presence of a market entry signal. We will not check the first two array objects for signals, since we store pointers to instances of the extremum search classes in these cells. If the stored pointer is invalid or the signal check function returns false, the pointer is removed from the array. The pattern signals are checked in the CheckPattern() function. Its algorithm will be provided below.
   int total=ar_Objects.Total();
   for(int i=2;i<total;i++)
     {
      if(CheckPointer(ar_Objects.At(i))==POINTER_INVALID)
         if(ar_Objects.Delete(i))
           {
            i--;
            total--;
            continue;
           }
//---
      if(!CheckPattern(ar_Objects.At(i)))
        {
         if(ar_Objects.Delete(i))
           {
            i--;
            total--;
            continue;
           }
        }
     }
After checking the previously detected patterns, it is time to go to the second block — the search for new patterns. To do this, check the availability of a new bar on the working timeframe. If a new bar is not formed, exit the function waiting for a new tick.
   static datetime Last_WT=0;
   series=(datetime)SeriesInfoInteger(_Symbol,e_TimeFrame,SERIES_LASTBAR_DATE);
   if(Last_WT>=series)
      return;
When a new bar appears, define the initial date of searching for patterns (considering the depth of the analyzed history specified in the parameters). Next, check the relevance of the pointer to the CPattern class object. If the pointer is invalid, create a new class instance.
   start_search=iTime(_Symbol,e_TimeFrame,fmin(i_MaxHistory,Bars(_Symbol,e_TimeFrame)));
   if(CheckPointer(Pattern)==POINTER_INVALID)
     {
      Pattern=new CPattern();
      if(CheckPointer(Pattern)==POINTER_INVALID)
         return;
      if(!Pattern.Create(ar_Objects.At(1),d_MinCorrection,d_MaxCorrection))
        {
         delete Pattern;
         return;
        }
     }
   Last_WT=series;
After that, call the method of searching for potential patterns in a loop. In case of a successful search, shift the start date of the search for a new pattern and check the presence of the detected pattern in the array of the previously found ones. If the pattern is already present in the array, move to the new search.
   while(!IsStopped() && Pattern.Search(start_search))
     {
      start_search=fmax(start_search,Pattern.EndTrendTime()+PeriodSeconds(e_TimeFrame));
      bool found=false;
      for(int i=2;i<ar_Objects.Total();i++)
         if(Pattern.Compare(ar_Objects.At(i),0)==0)
           {
            found=true;
            break;
           }
      if(found)
         continue;
If a new pattern is found, check the market entry signal by calling the CheckPattern() function. After that, save the pattern to the array if necessary and initialize the new class instance for the next search. The loop continues till the Search() method returns false during one of the subsequent searches.
      if(!CheckPattern(Pattern))
         continue;
      if(!ar_Objects.Add(Pattern))
         continue;
      Pattern=new CPattern();
      if(CheckPointer(Pattern)==POINTER_INVALID)
         break;
      if(!Pattern.Create(ar_Objects.At(1),d_MinCorrection,d_MaxCorrection))
        {
         delete Pattern;
         break;
        }
     }
//---
   return;
  }
Let's have a look at the CheckPattern() function algorithm to make the picture complete. The method receives the pointer to the CPatern class instance in the parameters and returns the logical value of the operations result. If the function returns false, the analyzed pattern is deleted from the array of saved objects.
At the beginning of the function, call the market entry signal search method of the CPattern class. If the check fails, exit the function with the false result.
bool CheckPattern(CPattern *pattern)
  {
   int signal=0;
   double sl=-1, tp1=-1, tp2=-1;
   if(!pattern.CheckSignal(signal,sl,tp1,tp2))
      return false;
If the market entry signal search is successful, set trading levels and send a market entry order according to the signal.
   double price=0;
   double to_close=100;
//---
   switch(signal)
     {
      case 1:
        price=SymbolInfoDouble(_Symbol,SYMBOL_ASK);
        CLimitTakeProfit::Clear();
        if((tp1-price)>SymbolInfoInteger(_Symbol,SYMBOL_TRADE_STOPS_LEVEL)*_Point)
           if(CLimitTakeProfit::AddTakeProfit((uint)((tp1-price)/_Point),(fabs(tp1-tp2)>=_Point ? 50 : 100)))
              to_close-=(fabs(tp1-tp2)>=_Point ? 50 : 100);
        if(to_close>0 && (tp2-price)>SymbolInfoInteger(_Symbol,SYMBOL_TRADE_STOPS_LEVEL)*_Point)
           if(!CLimitTakeProfit::AddTakeProfit((uint)((tp2-price)/_Point),to_close))
              return false;
        if(Trade.Buy(d_Lot,_Symbol,price,sl-i_SL*_Point,0,NULL))
           return false;
        break;
      case -1:
        price=SymbolInfoDouble(_Symbol,SYMBOL_BID);
        CLimitTakeProfit::Clear();
        if((price-tp1)>SymbolInfoInteger(_Symbol,SYMBOL_TRADE_STOPS_LEVEL)*_Point)
           if(CLimitTakeProfit::AddTakeProfit((uint)((price-tp1)/_Point),(fabs(tp1-tp2)>=_Point ? 50 : 100)))
              to_close-=(fabs(tp1-tp2)>=_Point ? 50 : 100);
        if(to_close>0 && (price-tp2)>SymbolInfoInteger(_Symbol,SYMBOL_TRADE_STOPS_LEVEL)*_Point)
           if(!CLimitTakeProfit::AddTakeProfit((uint)((price-tp2)/_Point),to_close))
              return false;
        if(Trade.Sell(d_Lot,_Symbol,price,sl+i_SL*_Point,0,NULL))
           return false;
        break;
     }
//---
   return true;
  }
If the position is successfully opened, exit the function with the false result. This is done in order to delete the used pattern from the array. This allows us to avoid re-opening of a position on the same pattern.
The full code of all methods and functions is provided in the attachment.
4. Testing the strategy
Now that the EA has been developed, it is time to check its work on history data. The test will be performed on the period of 9 months of 2018 for EURUSD. The search for patterns is to be performed on M30, while position entry points are to be detected on М5.

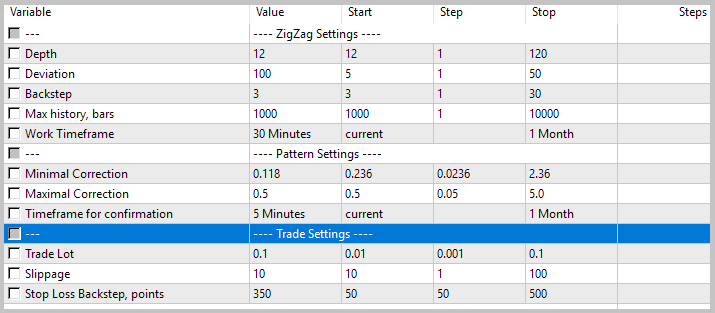
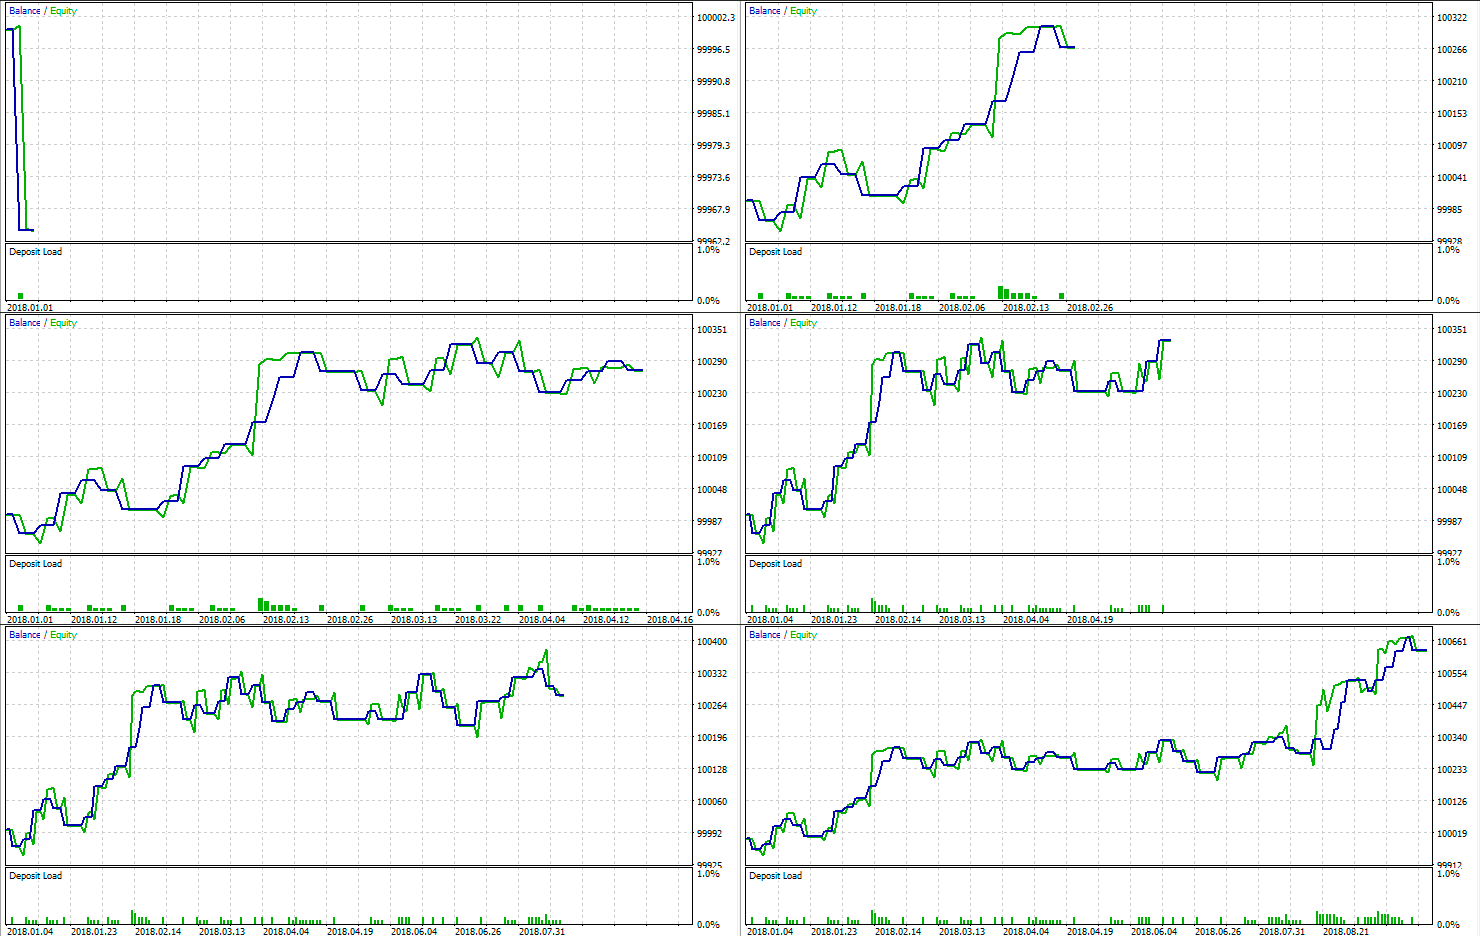
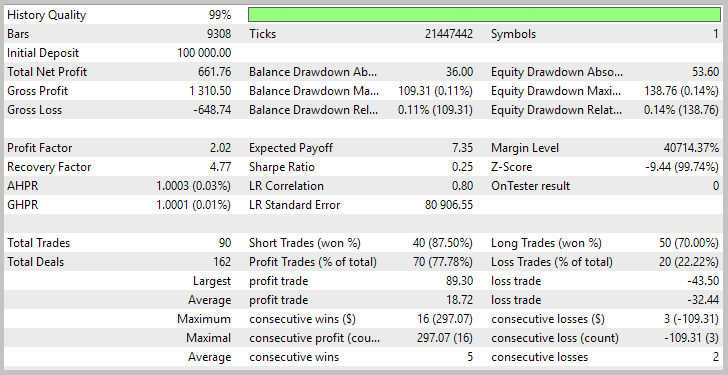
The test results showed the EA's ability to generate profit. The EA performed 90 trades (70 of which were profitable) within the test period. The profit factor is 2.02, the recovery factor is 4.77, which indicates the possibility of using the EA on real accounts. Full test results are displayed below.
Conclusion
In this article, we have developed the EA based on the Double top/bottom trend reversal pattern. Testing the EA on history data has demonstrated acceptable results and the EA's ability to generate profit confirming the possibility of applying the Double top/bottom pattern as an efficient trend reversal signal when searching for market entry points.
References
- Implementing indicator calculations into an Expert Advisor code
- Using limit orders instead of Take Profit without changing the EA's original code
Programs used in the article
| # |
Name |
Type |
Description |
|---|---|---|---|
| 1 | ZigZag.mqh | Class library | Zig Zag indicator class |
| 2 | Trends.mqh | Class library | Trend search class |
| 3 | Pattern.mqh | Class library | Class for working with patterns |
| 4 | LimitTakeProfit.mqh | Class library | Class for replacing order take profit with limit orders |
| 5 | Header.mqh | Library | EA headers file |
| 6 | DoubleTop.mq5 | Expert Advisor | EA based on the Double top/bottom strategy |
Translated from Russian by MetaQuotes Ltd.
Original article: https://www.mql5.com/ru/articles/5319
 Gap - a profitable strategy or 50/50?
 Reversing: Reducing maximum drawdown and testing other markets
 Using limit orders instead of Take Profit without changing the EA's original code
- Free trading apps
- Over 8,000 signals for copying
- Economic news for exploring financial markets
You agree to website policy and terms of use
Hi, show the journal.
The sollution is to delete the 0 in the {}
Hi, show the journal.
Dear Dimitry!
Thank you very much for your code, I have learned many things of it already!
Best regards, Todor
Hi, show the journal.
As you see, in the line 72, the void is missing in the original source. I think, that the problem is depending from the new mql5 lang version. Already have to use the void keyword in the latest version.
I manage to make the code to work and made some trade. But the real problem is the algorithm itself: it doens't detect double top/bottom properly, lot of errors and missinterpretations. Poorly thinked. Not raccomanded
Hi, show the journal.
Hi Dmitriy
I want to test your EA but I have some errors. TP doesn't set properly and see these errors: