Смотри обучающее видео по маркету на YouTube
Как купить торгового робота или индикатор
Запусти робота на
виртуальном хостинге
виртуальном хостинге
Протестируй индикатор/робота перед покупкой
Хочешь зарабатывать в Маркете?
Как подать продукт, чтобы его покупали
Технические индикаторы для MetaTrader 4 - 40

Осциллятор направленности тренда с дополнительной фильтрацией флета Помогает быстро сориентироваться при изменении направления движения цены и раскрашивается в соответствующий цвет Работает на всех таймфреймах, на любых валютных парах, металлах и криптовалюте Можно использовать при работе с бинарными опционами Отличительные особенности Не перерисовывается; Фильтрация флета - когда гистограмма находится в желтой зоне; Простые и понятные настройки; Работает на всех таймфреймах и на всех символах;
FREE

Индикатор показывает максимальное и минимальное количество лотов, а также величину спреда символа. Эта информация нужна для принятия быстрого решения по входу в рынок из расчета максимума депозита. Рассчитывается из расчета свободных средств и средств для открытия одного лота. Такие ситуации бывают часто, когда вы участвуете в различных конкурсах по Форексу или торгуете на рынке максимально возможными средствами, а также в период повышенной или пониженной волатильности. Индикатор после присоедин
FREE
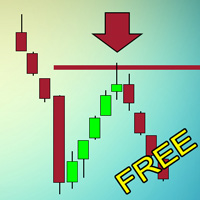
Индикатор, который ищет качественные точки входа в рынок и отображает их в виде стрелок. Действует по сложному алгоритму. Сначала ищет на графике специальные уровни, которые обязательно должны быть пробиты импульсом. Если цена возвращается к этому уровню в виде свечи с длинной тенью и маленьким телом и касается уровня только тенью - возникает точка входа. Не перерисовывается! Лучше всего выглядит и отрабатывает на Н1.
Может использоваться как: Индикатор уровней, где цена будет останавлива
FREE

Описание Цветной индикатор для раскраски настроений рынка линейного графика в окне основного финансового инструмента. Полезен для поиска линий поддержки и сопротивления. Назначение Индикатор может быть использован для ручной или автоматической торговли в составе советника. Для автоматической торговли могут быть использованы показания индикаторных буферов типа double : повышающаяся линия - буфер 0, не должен быть равным EMPTY_VALUE. понижающаяся линия - буфер 1, не должен быть равным EMPTY_
FREE

Indicator with the function of catching trees should pinbar of all time frames 1. PinBar identification indicator for multi timeframe. 2. Function backtest of PinBar candlestick patterns 3. Announcements on MT4 / MT5 and on mobile phones Please watch my movie on youtube for instructions. S ubscribe my channel for free indicator. https://youtu.be/gIONGgBMqW8
#KIDsEA #indicator #Pinbar #priceaction #mt4 #mt5
FREE
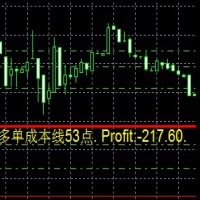
Dies ist ein Indikator
Dies ist ein Indikator, der immer die Auftragskosten und die Rentabilität in Echtzeit widerspiegelt
Besonders wenn es auf die Martin-Strategie angewendet wird, ist es bequemer 这是一个指标
这是一个时时反应订单成本 和实时 盈利值得 指标
尤其应用于 马丁策略的时候 更加方便 This is an indicator
This is an indicator that always reflects the order cost and real-time profitability
Especially when applied to the Martin strategy, it is more convenient
FREE
Your attention is invited to the indicator Price Action Indicators. It doesn't need settings. And also it is not tied to more than one indicator, which makes it not vulnerable to different accounts or brokers.
Add one setting PERIOD
Regards, Mikhail
Вашему вниманию предлагается индикатор Price Action Indicators. Ему не нужны настройки. А также он не привязан не к одному индикатору, что делает его не уязвимым перед разными счетами или брокерами.
С Уважением Михаил
FREE
Индикатор определяет точки входа в рынок, в качестве сигнала используя пересечение RSI различных периодов. Оптимальным моментом входа является преодоление ценой максимума/минимума бара, отмеченного индикатором.
Настройки: RSI_Fast_Period - период быстрого индикатора; RSI_Slow_Period - период медленного индикатора; RSI_Fast_Price - цена быстрого индикатора; RSI_Slow_Price - цена медленного индикатора;
Alerts - отображает диалоговое окно; Send_Mail - посылает электронное письмо по адресу, указ
FREE

P R I C E F O R C E A N A L Y Z E R This is a complex indicator that calculates the force of the price direction.
V E R Y I M P O R T A N T This is not a stand alone indicator. Use it together with your own strategy. This indicator only confirms your possible position. You can run it in any charts and timeframes but H1 is recommended. Make sure that the pair is volatile at the time of trading. If you don't have a solid volatility-based strategy ye
FREE
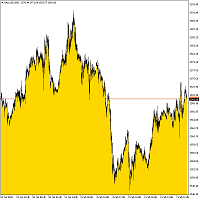
Индикатор устанавливает нижний фон определенного цвета до текущей цены в зависимости от настроек. Описание настроек индикатора: MODE - три варианта отображения индикатора: Low - отображение до минимальной цены, Open/Close - отображение до цены открытия или закрытия в зависимости что ниже, MA - отображение до скользящей средней. PeriodMA - период скользящей средней.
FREE
Индикатор RSI S-RoC отличается от стандартного индикатора RSI учетом скорости изменения цены при расчете своих данных. При движении цены по тренду дает хорошие сигналы для входа при касании своих уровней. Значения уровней можно задавать самостоятельно в настройках индикатора, а также при желании их можно изменять и настраивать непосредственно в окне индикатора. Кроме того имеется возможность установки на график цены сигнальных линий, при пересечении которых индикатор будет выдавать звуковое опов
FREE

Торговля о ожидании нужного времени. Этот индикатор был создан, чтобы знать, что происходит на наших графиках без необходимости покрывать экран индикаторами. Кроме того, он имеет несколько типов предупреждений, которые позволяют нам посвятить наше время другим вещам, пока что-то интересное не произойдет. Вы можете использовать несколько сигналов тревоги одновременно. Это не проблема. По умолчанию AlterAlert предлагает нам оповещения, когда следующие индикаторы дают нам сигнал: ◾движусь в средн
FREE

Идите по следу кометы, чтобы знать, как будет развиваться тренд. Индикатор помогает определить развитие цены в зависимости от способа отображения этих астрономических объектов на графике. Когда кажется, что комета останавливается, она значительно раскрывает свои хвосты и предупреждает о возможной смене тренда. Напротив, когда кажется, что она ускоряется (выглядит тонкой, потому что линии хвоста сгруппированы), она показывает безопасность и продолжение тренда. Голова или ядро кометы будет отображ
FREE

Индикатор в виде панели для отслеживания и сбора статистики по спредам из указаного списка пар. Достаточно открыть один график и установить индикатор для сбора статистики по всем указанным парам. Панель после завершения работы записывает значения в файл, что позволяет не перерывать сбор статистики после завершения работы.
Входные параметры:
-Интервал обновления спреда по парам (сек) Позволяет указывать с какой периодичностью проводить сбор статистики (позволяет снизить нагрузку) -Список пар
FREE
Представленный индикатор отмечает на графике цены стрелками сигналы в соответствии с данными индикатора FATL Momentum AM . Индикатор подает сигнал и отправляет уведомление на мобильный терминал и электронную почту. Индикатор FATL Momentum AM представляет собой разницу текущей цены и ценой некоторое количество периодов назад. Отличием от классического индикатора Momentum является предварительное сглаживание цен адаптивным цифровым фильтром - FATL. Подтверждением сигналов индикатора обычно служ
FREE

Average Price Plus is an essential indicator for day-to-day operations. With it, you can graphically check the average price between several open orders on your chart. The average price is the breakeven point between your orders. In addition to the average price, the indicator also shows you the number of pips and the financial value resulting from your open orders, the percentage gains, the number of lots in operation and the number of open orders. Negative values in "pips" or in financial val
FREE

Индикатор MAtrio, отображает на любом таймфрейме сразу три скользящих средних с периодом 50 -дневная ,100 -дневная , 200 -дневная . После присоединения к графику сразу отображает три скользящих средних с параметрами простой (SMA) скользящей средней SmoothingType50 , простой (SMA) скользящей средней SmoothingType100, простой (SMA) скользящей средней SmoothingType200. Соответственно с типом цены ValuePrices50, ValuePrices100, ValuePrices200 по умолчанию везде стоит цена Close price .
FREE

Introducing Momentum Jurik—an innovative indicator designed to optimize your forex trading strategy by incorporating custom moving averages based on the Momentum indicator with the MetaTrader 4 indicator, Momentum.
Jurik moving averages are renowned for their precision and reliability in analyzing price movements in the forex market. They provide traders with smoother representations of price action, reducing noise and offering clearer signals for identifying trends and potential reversals.
FREE

Индикатор вычисляет нарастающий итог от линейно взвешенных результатов виртуальных торгов. Это преобразует котировки в интегрированный, разностно-стационарный ряд с легко различимыми зонами покупок и продаж. Зоны покупок - синие, зоны продаж - красные. Параметры: period - количество баров для расчета линейно-взвешенной суммы; по-умолчанию - 96; smoothing - период EMA-сглаживания; по-умолчанию - 5; mode - целое число, определяющее режим расчетов: 0 - долгосрочная торговля; 1 - среднесрочная торго
FREE
Данный индикатор окрашивает свечи графика цены в соответствии с данными двух индикаторов CCI разных периодов. Если оба индикатора CCI выше 0, индикатор окрашивает свечу в цвет, сигнализирующий о росте цены, и наоборот. Индикатор позволяет эффективно следовать тренду, отслеживать краткосрочные откаты цены, а также своевременно идентифицировать разворот цены. Индикатор не перерисовывается.
Настройки CCI1_Period ( >1) - период быстрого CCI osc; CCI1_Price - цена быстрого CCI osc; CCI2_Period (>CC
FREE

Индикатор показывает изменения цены за те же дни в прошлые годы. Требуется таймфрейм D1. Индикатор предсказывает на основе баров D1 на тех же днях прошлых лет относительное изменение цен. Параметры: LookForward - количество дней (баров) для показа "будущих" изменений цен; по-умолчанию - 5; Offset - количество дней (баров) для сдвига назад по истории; по-умолчанию - 0; ShowAverage - переключатель режима; true - показывать среднее для всех 8 прошлых лет и границы стандартного отклонения; false - п
FREE

Description This scanner uses 3LZZ TRO ex4 and scans for Semafors at given “Shift” bar.
Scanner Detailed Settings: https://www.mql5.com/en/blogs/post/747456
Other Settings: Set Periods for Semafor 1,2,3 Set alerts on/off for Semafor 1,2,3 Shift bar (Bar on which semafor is scanned) Refresh After Ticks (Number of ticks when dash is refreshed) This scanner is pretty simplistic version. And a more detailed version with a different strategy is available here: https://www.mql5.com/en/market/produ
FREE

Данный индикатор помогает трейдеру принять окончательное решение. Когда уже определились, в какую сторону будет разворачиваться цена, остаётся как можно точнее определить сам разворот. Именно эту задачу и выполняет индикатор "Konkov". Индикатор устанавливается на графики М1 и М5. Параметры индикатора: для графика М1 time_frame1 5 time_frame2 5 time_fra
FREE
Relative Charts отображает график возврата к среднему значению с использованием скользящей средней в качестве опорного индикатора, эффективно сглаживая меняющееся значение фиатной валюты. Взгляд на рынок с точки зрения среднего значения Легко обнаруживаются зоны перекупленности/перепроданности Внимание трейдера не отвлекается на меняющуюся стоимость фиатных валют Центральная линия отображает скользящую среднюю Работа с индикатором ограничена только вашим воображением Настраиваемые период графика
FREE

SYMBOL POWER based on inputted 5 time frames and Compared to 20 Other Symbols !! Great Indicator YOU DON'T HAVE TO SHIFT ON ALL TIME FRAMES FOR EACH CURRENCY PAIR TO CONCLUDE ITS TREND AND ITS POWER YOU HAVE IT ALL IN ONE TABLE , 20 CURRENCY PAIR WITH 5 TIME FRAMES ALSO , COMPARE BETWEEN CURRENCIES STRENGTH AND ALERTS THE STRONGER /WEAKER PAIR BASED ON 5 TIMEFRAMES CALCULATIONS ALEERTS enable /disable using 5 time frames M5 M30 H1 H4 and D1 ( latest version You SELECT you own 5 timeframes fr

Индикатор PipTick Retracement показывает текущее и историческое значения максимума, минимума и среднего значения. По желанию пользователя отображаются все основные уровни коррекции. Все эти уровни в сочетании формируют ключевые уровни поддержки и сопротивления. Всем видам трейдеров непременно необходимо осознавать эти уровни.
Уровни
High - максимум Low - минимум Midpoint - средняя точка 76,4 % 61,8 % 38,2 % 23,6 %
Основные характеристики Индикатор показывает текущие уровни High, Low, Mid и
FREE

As simple to use it as any other moving averages, e.g. SMA , follows the trend and filters out the noise. Minimalist parameter set: Period: number of calculated bars; the larger, the smoother (default: 63, minimum: 4)
MA method: use LWMA or EMA (default: EMA)
Price: applied price (default: Typical)
Shift: shift right for prediction purpose (default: 0)
Although moving averages are fundamental to many technical analysis strategies, you ought to combine it
FREE
Добрый День, Всем. Решил выложить свой индикатор, предложить на просмотр. Я трейдер, Вадим Сергеевич Лепехо. Индикатор не стандартный, сделан не по канонам. Индикатор рисует маржинальные зоны на графике, пока полет нормальный. Но строит зоны по индикатору AO(Awesom) конкретней по фрактальным зонам индикатора AO. Зоны стандартные 1/4, 1/4, и НКЗ. Пример привожу по EURUSD + в картинках. На данный момент 14.10.23 - нкз=1920 пипсов(192 пункта) предлагаю преобразить до 192пипсов(19.8пунктов). Поясняю
FREE
DM Osc - Digital Momentum Oscillator. Индикатор представляет собой осциллятор основанный на адаптивных цифровых фильтрах с отображением сигналов как на самом осцилляторе так и на графике цены. Индикатор подает два типа сигналов: При смене направления линии осциллятора; При пересечении нулевого значения линией осциллятора. Сигналы подаются на полностью сформированных барах. Сигналы индикатора требуют подтверждения в виде преодоления ценой максимума/минимума бара на котором сигнал был подан. Инди
FREE

Maltese cross GBP Универсальный инструмент для определения трендов, флетов и торговли по графическим паттернам. Объединяет техники Гана, Эллиота, Мюррея.
Просто разместите его на графике и он покажет направление и скорость движения цены, выделит разворотные моменты. Maltese cross поможет точно определять узловые моменты в истории, планировать торговые действия и сопровождать открытые сделки. Эта бесплатная демонстрационная версия MalteseCross ограничена GBPUSD и кроссами GBP. Никаких прочих
FREE

Cross Trend Lines indicator trend indicator of find. This indicator, an array of works by using a series of indicator and algorithm. Uses two lines to find trends. The intersection of this line means that the start of the trend. These lines are green, tend to rise. Red lines indicate the downward trend. Use of this indicator is easy to understand. This indicator on its own or you can use other indicators that are appropriate for the strategy.
Suggestions and Features Starts a new trend at th
FREE
Binary Options Assistant (BOA) CHILL Signals Indicator provides signals based on Katie Tutorials Binary Options Strategy. Indicators: 3 Moving Averages & RSI
Use any of the BOA Signals Indicators with the Binary Options Assistant (BOA) Multi Currency Dashboard so you can:
Stop missing trade set-ups Stop jumping from chart to chart looking for trade set-ups Get all the signals on 1 chart All BOA Signal Indicator settings are adjustable to give you more strategy combinations. The signals ca
FREE

Этот индикатор был модифицирован согласно 'Пути черепахи'. Индикатор ATR можно использовать в качестве опорной точки для установки стоп-лосса или тейк-профита, а также для подтверждения дневного ценового диапазона (также применимо к другим периодам).
Расчет Значение истинного диапазона рассчитывается следующим образом: TR = MAX(H-L, H-PDC, PDC-L) Где: H = максимальная цена текущего бара L = минимальная цена текущего бара PDC = цена закрытия предыдущего бара Средний истинный диапазон в "Пути че
FREE

Check the Trend Power This indicator is designed to identify the POWER of trend. This is NOT define bullish or bearish trend. It is quite easy to look at the power when the indicator line turns Green the trend are strong when the indicator line turns Red the trend are Weak strategy for trade is : Open possition only when the power go Green Exit possition when the power change to Red
FREE

In the indicator there are EUR, USD, CAD, AUD, NZD,JPY, GBP ,CHF.
The Currency Index Project is Forex study. Many people do not know the theoretical basis that drives currency exchange rates to move on the market. With this set of tools you will be able to have a more complete view of the entire market by analyzing not only the single currency of an exchange, but all the exchange rates that make up that currency by looking at a single window! The study assumes that all forex currencies are l
FREE
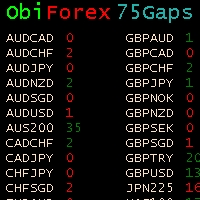
Gaps Size 75 - Market Gap Indicator The Gaps Size 75 indicator reveals the gaps between the current day and the previous day, aiding your trading decisions. It is designed for the "END OF WEEK GAPS" strategy, allowing you to identify potential opportunities. This indicator supports up to 75 currency pairs, with additional pairs available upon request. The columns are color-coded for easy interpretation. For inquiries regarding the weekend gaps strategy, kindly send a private message. Gaps Size 7
FREE
Целью этой новой версии стандартного MT4 индикатора, входящего в поставку платформы, является отображение в подокне нескольких таймфреймах одного и того же индикатора. См. пример, приведенный на рисунке ниже. Однако индикатор отражается не как простой индикатор MTF. Это реальное отображение индикатора на его таймфрейме. Доступные настройки в индикаторе FFx: Выбор таймфрейма для отображения (от M1 до MN) Установка ширины (количество баров) для каждого окна таймфрейма Всплывающее оповещение/звуков
FREE
pappye indicator uses bolinger band to trigger it's signal ,it contain's pappye animation for alerting trading signals this alert is not continuous for the same arrow it will played 2 times only it could be used for any pair any time frame personally i prefer to inter a trade when there is to consecutive arrow in horizontal level after a breakout drift in a price but you could choose your way after trying the demo copy on your terminal
parameters fast : fast bolinger period slow : slow boli
FREE

Индикатор рассчитывает угол наклона между ближайшими максимумами, минимумами и закрытиями (по high/low/close соседних баров). Измерение угла возможно в градусах или в радианах. В подокне рисуется линейный график или гистограмма. Можно указать масштаб для расчета — плавающий или фиксированный. Для использования в советниках или других индикаторах обязательно указывать фиксированный масштаб.
Параметры Angular measure — измерение угла в градусах или радианах. Scale mode for calculation — режим ма
FREE

ContiStat restricted - Free DEMO version of the ContiStat indicator
Free version of the indicator is ment as DEMO of full paid version. Full functionality is available, however The indicator work only on M30 chart period . Find the ContiStat indicator for full functionality
Brief description The ContiStat indicator calculate statistic frequency of green (up) and red (down) movement in the chart and determine movement dynamics (silver curve). There are two key parameters to understand the Cont
FREE
Данный индикатор рисует линии по стандартному индикатору Fractals и при пробитии фрактала вверх или вниз выдает алерт, оповещение на электронную почту, оповещение на мобильный телефон.
Входные параметры History - Количество баров для расчета в истории. Color Up Fractal - Цвет линии верхнего фрактала. Color Down Fractal - Цвет линии нижнего фрактала. Width - Ширина линии. Alerts - Алерт. EmailAlerts - Оповещение на электронную почту. NotificationAlert - Оповещение на мобильный телефон.
FREE

Индикатор RS 24 Titanium- э то мультивалютный и мультитаймфреймовый сигнальный индикатор, созданный по авторскому алгоритму. П редназначен для быстрой оценки тренда (настроения участников рынка) на всех таймфреймах одновременно, по конкретному финансовому инструменту. RS 24 Titanium сканирует показания со всех таймфреймов по одному финансовому активу и выводить данные в виде наглядной таблицы. Индикатор может использоваться с любым брокером (с 4/5-значными котировками). Полученные торговы
FREE

Yuri Congia Market Info Indicator
Description: The Yuri Congia Market Info Indicator is a tool for traders, providing a wide range of key data directly on the chart. Developed by Yuri Congia, this indicator offers detailed information on the current price, spread, daily highs and lows, remaining time before candle close, and more. It's an essential tool for traders who want immediate access to crucial information during their trading operations. Join me in the exciting world of financial trad
FREE

Индикатор вычисляет наиболее вероятные уровни возврата цены. Может быть использован для установки уровня тейк профит. Рекомендуемый таймфрейм - любой, при соответствующей настройке. Настройки.
Period - количество свечей для анализа. Accuracy - точность расчёта уровня в пунктах. Width - размер ценовой метки. Отработка уровней как правило не занимает много времени, уровни достаточно точны при касании и процент возврата цены к ним достаточно высок. Но следует учитывать риск продаж на локальных ми
FREE

Для текущего инструмента индикатор строит аффинный график, вычитая из цены трендовую составляющую. При запуске создает трендовую линию в главном окне. Расположите эту линию в нужном направлении. Индикатор перестроит аффинный график в соответствии с указанным трендом.
Входные параметры Maximum number of pictured bars - максимальное количество отображаемых баров; Trend line name - имя линии тренда; Trend line color - цвет линии тренда; Black candle color - цвет черной свечи; White candle color -
FREE

This indicator helps you to comfirm SMAs' crossovers by draw a signal line that determines SMA movement direction. when Short SMA cross above Long SMA and Close price is above the signal several bars later, then uptrend is expected. when Short SMA cross below Long SMA and Close price is below the signal several bars later, then downtrend is expected.
Input Description :
MA_Period_short: Short-term SMA's period. Used for short-term PriceX. Must be higher than 1. MA_Period_long: Long-term SMA'
FREE
An indicator for analyzing different currency pairs simultaneously Forex is a complex market that requires several currency pairs to be analyzed simultaneously Determine the number of currency pairs yourself Determine the currency pair you want to analyze to analyze 4 of the most important and similar currency pairs at the same time. For direct and simple analysis, some currency pairs have changed (EURUSD>>>USDEUR) Do not doubt that to succeed in this market, you must analyze several currency pa
FREE

Highly configurable Demarker indicator.
Features: Highly customizable alert functions (at levels, crosses, direction changes via email, push, sound, popup) Multi timeframe ability Color customization (at levels, crosses, direction changes) Linear interpolation and histogram mode options Works on strategy tester in multi timeframe mode (at weekend without ticks also) Adjustable Levels Parameters:
Demarker Timeframe: You can set the lower/higher timeframes for Demarker. Demarker Bar Shift: Y
FREE

Индикатор отображает на графике сигналы согласно стратегии Билла Вильямса. Демо версия индикатора имеет такие же функции, как и платная, за исключением того, что может работать только на демо-счете. Сигнал "Первый мудрец" формируется, когда появляется разворотный бар с ангуляцией. Бычий разворотный бар - у которого более низкий минимум и цена закрытия в верхней его половине. Медвежий разворотный бар - более высокий максимум и цена закрытия в нижней его половине. Ангуляция образуется, когда все
FREE

Трендовый индикатор Trend Esay MTF индикатор который рисует стрелки прямо на графике цены. Как каждый трендовый индикатор хорошо работает при хорошем движении цены и хуже во флете. Особенностю даного индикатора есть возможность отсылать алерты как в терминале так и на смартфон В меню индикатора имеется количество баров в истории индикатора и
значение периода для определения тренда. В меню индикатора добавлена функция "тренд" которая фильтрует сигналы индикатора.
FREE
Данный индикатор отображает в виде осциллятора разность максимальной/минимальной цен за текущий период времени и максимальной/минимальной цены за больший период. Рост значений индикатора выше нуля говорит о том, что максимальная цена за текущий период больше значения максимальной цены за период, выбранный в качестве параметра индикатора. Такая ситуация в большинстве случаев говорит о росте стоимости актива. Падение значений индикатора ниже нуля говорит о том, что минимальная цена за текущий пер
FREE

Indicator overview Trend indicator usage Moving averages. Highest quality alerts that need no introduction. It is completely loyal to the original algorithm and uses other useful features.
Easy to trade Carry out all kinds of notifications It's not a new paint and it's not a back paint. Setting Indicator SMA50 in Time frame H1 for any pair currency and Gold Spot. EMA200 in Time frame H1 for any pair currency and more than EMA250 for Gold spot. Using it for maximum benefit Set up notificatio
FREE

Pipsurfer Tide Meter is a Momentum Indicator that is designed to help trades know which way the "Tide" is turning. This indicator is a great supporting indicator to the pipsurfer main indicator that is listed in MQL5 under "Pipsurfer Indicator"
The Strategy Behind the Tide Meter is that youll see the blue bars and the red bars. Blue bars are for bullish momentum Red bars are for bearish momentum Use price action to find a trading zone then wait for the tide meter to change color then you en
FREE

The risk-to-reward ratio is used for assessing the potential profit (reward) against the potential loss (risk) of a trade. Stock traders and investors use the R/R ratio to fix the price at which they'll exit the trade, irrespective of whether it generates profit or loss. A stop-loss order is generally used to exit the position in case it starts moving in an opposite direction to what a trader anticipated.
The relationship between the risk and reward helps determine whether the potent
FREE

Supporting file (1 of 2) for T3 Cloud MA
Trend indicator derived from T3 moving averages. The cloud is bounded by a fast T3 and slow T3 lines. Buying/Selling opportunities above/below cloud. The fast and slow T3 MA lines can also be used as dynamic support/resistance for more aggressive entries. Use default values for best settings. The number of look back bars is user defined. This indicator can be used in combination with other strategies such as price action. Suitable for all time frames. P
FREE
This indicator is a tool to measure the relative strength of different currency pairs. It used a user selected base currency as a comparing standard, and evaluate all other major currencies base on their relative strength/weakness. the stronger one currency compare to the base currency, the higher its value. Base currency has a fix strength value of 50.
Indicator parameters Strength Period - Change the strength period in the settings affects the number of bars used for calculation. The higher
FREE
Индикатор определяет зоны перекупленности и перепроданности на разных временных интервалах. Стрелки обозначают тенденцию рынка на разных тайм сессиях. Если рынок вышел из зоны перепроданности, то стрелка будет сигнализировать о восходящем тренде (стрелка вверх), если рынок вышел из зоны перекупленности, то стрелка будет сигнализировать о нисходящем тренде (стрелка вниз). В правом нижнем окне отображается ситуация на том тайм-фрейме, на котором установлен индикатор. В нем представлена информация
FREE

Индикатор сглаженного DeMarker Oscillator (xDeM)
Входные параметры: Period - период усреднения Принцип работы
Индикатор перерассчитывает стандартный технический индикатор DeMarker Oscillato r (дважды усредняет получаемые значения). Период усреднения индикатора соответствует двойному периоду стандартного DeMarker Oscillato r . Например : xDeM с периодом усреднения 7 соответствует DeM c периодом 14. Индикаторный буфер не перерисовывается.
FREE

Indicator support for only: Entry Point to Trend Pro Link indicator support : https://www.mql5.com/en/market/product/70867
Supports all currency pairs declared in the definition. Help investors do not need to open many charts. Notice the DEAL: multiple time frames confluence M15, H1, H4.
Entry Point to Trend Pro The indicator helps investors to identify the earliest and perfect reversal point. Easy to make decision to trade with the trend Price action trading. support resistance
FREE

Это демонстрационная версия PipsFactoryDaily Этот индикатор зависит от цен High и Low валюты за последний день, использует секретные уравнения для рисования 10 линий.
Особенности Вы будете знать по какой именно цене вам лучше войти на рынок. Вы будете знать, когда выходить из рынка. Вы будете знать, что вам следует делать в рынке: Покупка Продажа Тэйк Профит, имеются три уровня для фиксации прибыли Поддержка Сопротивление Риск при покупке Риск при продаже
Типы сигналов и используемые таймфре
FREE

The current Rise and Fall is judged from the Commodity Channel Index (CCI) of the three cycles and displayed in a panel by color coding.
The second and third of the three cycles are changed according to the correction factor multiplied by the first cycle (minimum cycle).
In addition, each CCI is displayed with ATR (Average True Range) corrected for variation.
When two of the three CCI are complete, Trend_1 is displayed. When all three are complete, Trend_2 is displayed.
// ---
Sq
红黄绿简明指示趋势与震荡指标升级版。 使用红黄绿三色来标示上升趋势 、震荡、下跌趋势。 红色表示空头趋势(下跌)。 绿色表示多头趋势(上涨)。 黄色表示震荡区域。 从黄色转变为红色时,行情可能从震荡转变为下跌趋势。一段连续的红色,说明下跌趋势很强。 从黄色转变为绿色时,行情可能从震荡转变为上升趋势。一段连续的绿色,说明上升趋势很强。 指标的上半部分区域和下半部分区域若同步为红色,表明下跌趋势已经形成共振,接下来大概率走出一段空头趋势。 同时,红绿黄分为上下两部分:
若上下部分同时为绿色,表明上涨趋势已经形成共振,接下来大概率走出一段多头趋势。 若上下部分同时为红色,表明下跌趋势已经形成共振,接下来大概率走出一段空头趋势。
若上下同时为黄色,表明当前行情为震荡。 升级版2.0: 新增两条快慢线。 当慢线(Blue/Red线)为蓝色时,视为多头行情。当慢线为红色时,视为空头行情。 当快线(DarkGray线)从下方向上穿过慢线时,作为参考做多信号,激进交易者可进场做多。反之亦然。
参数可调。 //+------------------------------------------
FREE

***IMPORTANT: This free indicator works with the paid for Strong Weak Forex Expert Advisor. The EA also depends on the following custom indicators: Strong Weak Heiken Ashi Strong Weak Symbols Strong Weak Values Strong Weak Indicator Download them for free in the Market. The EA will not work without it. These are all custom indicators which the Strong Weak Forex Expert Advisor relies on to generate trading signals. If you have any problems with installation send me a message.
FREE

Trend easy простой трендовый индикатор в виде гистограмы. окно индикатора разделено на две части верхняя гистограма движение в бай, нижняя гистограма движениие в сел. Кроме гистограмы, сигнал индикатора дублируется на графике стрелками. В меню индикатора имеется количество баров в истории индикатора
значения периода для определения тренда разрешение рисования стрелок на графике код и цвета стрелок алерты и отступ стрелок
FREE

Индикатор SkyNet EMA подскажет вам когда следует открывать длинную или короткую сделку на основе ценового действия и пересечений экспоненциальных скользящих средних, например, с периодами 14 и 50. Просто установите его на график, и он будет отслеживать возникновение возможностей для продажи на графике инструмента, а при их появлении нарисует красную стрелку на графике. Также он будет искать возможности для покупки, а при обнаружении их нарисует зеленую стрелку на графике. Индикатор можно использ
FREE

Introduction
This indicator alerts you when certain price levels are reached. The alert can be on an intrabar basis or on a closing price basis. It will also send alerts when one forms, including via e-mail or push notification to your phone . It's ideal for when you want to be notified of a price level being reached but don't want to have to sit in front of your chart all day.
Input Parameters
DoAlert: if set to true a desktop pop-up alert will appear from your MetaTrader terminal whe

This indicator provides trading signals based on the polarity of the dynamical parameters of two digital signals. The dynamical parameters (momentum-acceleration) are derived by applying a high quality momentum oscillator, MTEMA LPD ( see Top Gun Oscillators ) to two digital signals. The MTEMA momentum oscillator is first applied to the price itself. Then, a rectification procedure is applied to the price based on the signals from the momentum oscillator yielding a rectified price signal. This s
FREE

Трендовый индикатор с оцилятором. Отображает ценовые зоны между двух мувингов и осцилятор. Восходящий тренд индицируется красным цветом, нисходящий - синим. Настройки: Slow MA Period - Период медленной MA Fast MA Period - Период быстрой MA Smoothed Data - Сглаживание данных Show Area MA - Отображение ценовых зон MA Show Oscillation - Отображение осцилирования MA Move Oscillation to Slow MA - Отображение осцилятора на медленной MA Color Up - Цвет восходящего тренда Color Down - Цвет нисходящего
FREE

The most effective signals generated by Ichimoku strategies. Ichimoku Trade Alarm is a supplement for Ichimoku Trade Panel and it shows the signals that Expert Advisor reacts to.
Visualization of signals: Price / Kijun sen cross - the candle body must be between Min_Candlestick_Body and Max_Candlestick_Body. The candle must close above / below Kijun sen, minimum in 1/3 of its body. Open candle must be located above / below Kijun sen. Chinkou span must be under the price of 26 periods in advan

Как минимум, этот индикатор способен вас развлечь. Он строит скользящую линию на базе интерполяции полиномом 1-4 степеней и/или функцией, составленной из суммы 1-5 синусоид. Возможны комбинации, например, сумма трех синусоид около параболы второй степени. Построенную линию можно экстраполировать любой из указанных функций и на различное расстояние как в виде одной точки на каждом шаге индикатора (не изменяемая линия), так и в виде участка заданной функции (перерисовывается) для визуализации пост
MetaTrader Маркет предлагает каждому разработчику торговых программ простую и удобную площадку для их продажи.
Мы поможем вам с оформлением и подскажем, как подготовить описание продукта для Маркета. Все продаваемые через Маркет программы защищаются дополнительным шифрованием и могут запускаться только на компьютере покупателя. Незаконное копирование исключено.
Вы упускаете торговые возможности:
- Бесплатные приложения для трейдинга
- 8 000+ сигналов для копирования
- Экономические новости для анализа финансовых рынков
Регистрация
Вход
Если у вас нет учетной записи, зарегистрируйтесь
Для авторизации и пользования сайтом MQL5.com необходимо разрешить использование файлов Сookie.
Пожалуйста, включите в вашем браузере данную настройку, иначе вы не сможете авторизоваться.