Смотри обучающее видео по маркету на YouTube
Как купить торгового робота или индикатор
Запусти робота на
виртуальном хостинге
виртуальном хостинге
Протестируй индикатор/робота перед покупкой
Хочешь зарабатывать в Маркете?
Как подать продукт, чтобы его покупали
Технические индикаторы для MetaTrader 4 - 35

TPSpro Screenshot это и ндикатор который скринит рабочее пространство графика и сохраняет его в заданную вами папку на компьютере с заданным разрешением и с заданным интервалом времени. Имеются следующие настраиваемые параметры: Screenshot Width - Ширина скриншота Screenshot Height -Высота скриншота The name of the folder for screenshots (by pressing "]") - Имя папки для скриншотов Rewritable File Name - Имя перезаписываемого файла Step in seconds for a photo - Шаг в секундах для фото Creat
FREE

Набирается блок баров при условии конвергенции . Если условия конвергенции не соблюдаются, блок удаляется. Более точнее, условием является переход блока баров из состояния конвергенции в состояние дивергенции . Блоки формируются выборочно с пропусками. Пропуски характеризуются состоянием дивергенции баров. Перед тем как блок удалится, находятся экстремальные значения баров внутри блока ( min , max ). Линия соединяет экстремальные бары. Линия прорисовывается только перед тем как блок уд
FREE

Индикатор вертикальных уровней работающий на таймфреймах М5 и М1. Разлиновывает период текущего дня и дня прошедшего. Данный индикатор наглядно покажет трейдеру, начало и конец часа текущего, также прошедших часовых периодов, тридцати минут и пятиминутных интервалов графика. Преимущество работы с данным индикатором в том, что трейдер, добавив индикатор на график валютной пары с включенным младшим таймфреймом, всегда будет в курсе того, где начнётся новый час.
О понятии времени и таймфрейм
Вс
FREE
Highly configurable OBV indicator.
Features: Highly customizable alert functions (at levels, crosses, direction changes via email, push, sound, popup) Multi timeframe ability Color customization (at levels, crosses, direction changes) Linear interpolation and histogram mode options Works on strategy tester in multi timeframe mode (at weekend without ticks also) Adjustable Levels Parameters:
OBV Timeframe: You can set the lower/higher timeframes for OBV. OBV Bar Shift: Y ou can set the offs
FREE

'Circle Rising Point' is an indicator based on the cycle theory. No matter whether your trading cycle is short or long, you can use this indicator to find the rise and fall points of different cycles and different bands. Therefore, the signals displayed to you on charts of different cycles are different, and applicable to left side transactions. This indicator is recommended to be used together with the multi cycle window for analysis. Indicator introduction Applicable products This indicato
FREE

Индикатор Channel Builder ( CB ) или Ivanov Bands является таким обобщением индикатора Bollinger Bands , в котором, во первых, средняя линия < X > вычисляется по различным алгоритмам усреднения, а, во вторых, по обе стороны от средней линии < X > откладываются не среднеквадратичные отклонения std , а средние отклонения рассчитанные по различным реализациям гораздо более общего алгоритма , опирающегося на усреднение Колмогорова . Средняя линия < X > , кроме ст
FREE

Indicator overview Trend indicator usage Moving averages. Highest quality alerts that need no introduction. It is completely loyal to the original algorithm and uses other useful features.
Easy to trade Carry out all kinds of notifications It's not a new paint and it's not a back paint. Setting Indicator WMA50 in Time frame H1 for any pair currency and Gold Spot. EMA200 in Time frame H1 for any pair currency and more than EMA250 for Gold spot. Using it for maximum benefit Set up notificatio
FREE

X-axis lines prevail in grid manner, ruled by Average True Range. There’s an inevitable change in specific periods of time of this matter! The Average True Range (ATR) indicator is not directly based on volume. Instead, it measures volatility in price movements. It’ll stretch, expand, shrink, and evolve with 4 timely choices of grid states! MATR means “multiplying average true range” in which grandeurs the grid pip-distant levels, seeming to grasp a wave of perfectly synched parameters in ac
FREE

Harami is a two candle pattern with recent candle formed inside the previous candle's high and low . It represents indecision in the market and is used for breakout price action trading strategy. This indi fires all signals to a dashboard on the chart including pop_up alert, push to phone notification and email. Harami has two types, bullish and bearish pattern. Enter long for bullish Harami and enter short for bearish Harami. Inputs : Currency Symbols: EURUSD,GBPJPY,USDJPY,USDCAD (default) , u
FREE

Этот индикатор эффективно разделяет тиковый объем на рынке Форекс на «бычий» и «медвежий».
Кроме того, он позволяет рассчитать и отобразить сумму бычьих и медвежьих тиковых объемов за любой выбранный вами период.
Вы можете легко настроить период, перемещая две синие линии на графике, что позволяет настраивать точный анализ объемов в соответствии с вашими торговыми потребностями.
Если вы найдете его полезным, ваши отзывы будут оценены по достоинству!
Счастливой торговли!
FREE

Индикатор отображает на ценовом графике сигналы осциллятора RSX. (Для отображения этих сигналов в отдельном окне, вместе с осциллятором, используется другой индикатор - RSX Osc 4 AM ). Сигналы индикатора оптимально использовать как сигналы для открытия сделки при преодолении ценой максимума или минимума бара на котором сигнал был подан. Противоположный сигнал отменяет сигнал предыдущий.
Настройки: Data period for indicator calculation - период данных для расчета индикатора; Data period to di
FREE

This indicator draws on the chart high and low prices of different periods . And If you want, Indicator can alert you when the current price arrive these levels. Alert Options: Send Mobil Message, Send E-mail, Show Message, Sound Alert Time Periods: M1, M5, M15, M30, H1, H4, D1, W1, MN Inputs: TimeShift: You can set start hour for calculating. And that way you can see levels independently from broker server's time-zone. PipDeviation: You can set price sensibility for alert (Default: 3) Lines
FREE

A flexible 2-Line MACD indicator The default MACD indicator inside MT4, limits you to using the MACD with a fast-EMA, slow-EMA, and signal-SMA. This MACD indicator allows you to set your own MA-Method choices for these 3 components, separately! You can select from SMA-EMA-SMMA-LWMA, and can even use a separate method for each 3 fast-slow-signal periods. A more featured version is available with colored candles+conditions, full alerts+conditions, line coloring, DEMA and TEMA options; MACD MAX
FREE

Alert TIME LINE индикатор предупреждает, о том что цена достигла заданного временного уровня.
Перетащите индикатор на график, нажмите кнопку SET TIME LINE, передвиньте появившуюся линию на нужное время, при достижении графиком заданного времени, сработает алерт.
Данный индикатор применяется, как вспомогательный инструмент, при торговле временных зон, по бесплатной системе TIME LINE Foreх System , результаты и скриншоты, смотри ниже. Получить систему бесплатно можно в чате техподдержки https
FREE

The product Divergence Cci Force Stddev Ac Atr is designed to find the differences between indicators and price. It allows you to open orders or set trends using these differences. The indicator has 4 different divergence features.
Divergence types Class A Divergence Class B Divergence Class C Divergence Hidden Divergence
Product Features and Rec ommendations There are 5 indicators on the indicator Indicators = CCI, Force, Stdandard Deviation, Acelereator, Atr 4 different divergence ty
FREE

A. Этот сводный индикатор показывает дневную сводную цену.
B. Он также показывает сопротивление R0,5, R1, R1,5, R2, R2,5 и R3
C. Это также показывает поддержку S0.5, S1, S1.5, S2, S2.5 и S3
ВХОД:
Под входом вы увидите 3 переменных
1.ExtFomula. Здесь вы можете установить предпочтительный выход для сопротивления или поддержки в окне графика на значение не более 1, 2 или 3. 1 представляет выход на сопротивление или поддержку 1. 2 представляет выход на сопротивление или поддержку 2. 3 пред
FREE

The Sentiment Ratio indicator gauges current Market Sentiment between -100% and 100%, where lower than -40% is considered Bearish and higher than 40% is Bullish. The channel between the two is considered Neutral. The indicator has been a very useful filter tool for signals within a trading system.
Example call function: int SentimentIndicator(double triggerLevel)//Return sentiment if trigger level is activated { double sentimentRatio=iCustom(NULL,0,"Sentiment Ratio",0,0,0); if(sentimentRa
FREE

The Cossover MA Histogram indicator is a simple tool showing the trend based on crossover of moving averages. Simply specify two mobving averages and addicional parameters like MA method and Applied price. When fast MA is above slow MA the histogram is green, indicating an uptrend. When MA fast is below MA slow the histogram is red, indicating an downtrend.
FREE

Индикатор для синхронизации и позиционировании графиков на одном и более терминалах одновременно. Выполняет ряд часто необходимых при анализе графиков функций: 1. Синхронизация графиков локально - в пределах одного терминала при прокрутке, изменении масштаба, переключении периодов графиков, все графики делают это одновременно. 2. Синхронизация графиков глобально - тоже самое, но на двух и более терминалах, как МТ4, так и МТ5. 3. Позиционирование графика на заданном месте при переключении периодо
FREE

The YK-LOT-SIZE is an indicator that displays the total Lot Size and profit/loss of all trade orders for the current symbol on the price chart. It has the following features: Shows the total Lot Size of buy orders (BUY) and sell orders (SELL) on separate lines. Displays the profit/loss of buy orders (BUY) and sell orders (SELL) by calculating the sum of profit, commission, and swap. Users can customize the color of the displayed text through the input parameter. The information is displayed at t
FREE
Mars 12 is a Pullback indicator is a powerful indicator of Pullback trade for any par and any timeframe. It doesn't requires any additional indicators for the trading setup.The indicator gives clear signals about opening and closing trades.This Indicator is a unique, high quality and affordable trading tool. Can be used in combination with other indicators Perfect For New Traders And Expert Traders Low risk entries. Never repaints signal. Never backpaints signal. Never recalculates signal.

This indicator offers a comprehensive and efficient solution for traders seeking optimal entries in scalping strategies. Leveraging moving averages and stochastic indicators, it employs a systematic approach to identify favorable trade opportunities. The indicator goes beyond mere analysis, actively drawing clear and actionable entry points on your chart, denoted by arrows. Moreover, it provides the convenience of alerts to ensure you never miss these potential setups. Key Features and Benefits:
FREE

The ' Average OHLC ZigZag ' indicator was designed for entry confirmations as well as scalping with a larger trend. A custom formula to average the last two bars to generate arrows following market trends with bar 1 confirmation.
Key Features An extreme scalper calculating the averages between the last two market periods to generate a buy or sell arrow. No settings are available due to it's simplicity of custom price action pattern and using repainting four OHLC prices.
Input Parameters Zig
FREE

The Icarus Reversals(TM) FREE Indicator is a powerful tool to identify high-probability reversal points, across all instruments. The Reversals Indicator provides traders and investors with a simple-to-use and highly dynamic insight into points of likely price-action reversals. Generated by a unique proprietary code-set, the Reversals Indicator (FREE version) generates long and short trade signals, which can be customised for key inputs and colourisation. Settings of the Icarus Reversals FREE h
FREE

CoralDash is a simple symbol shortcut dashboard. The Symbol List has many presets to choose from: Market Watch Open Orders Current Chart Majors A custom list Clicking the symbol has two available actions Set the current chart symbol Filter the list of symbols shown in the dashboard based on one currency (e.g., see all EUR pairs) Click the "PAIR" cell in the header to toggle between the two available actions Click the symbol cell to apply the action For the filter, click the left side to selec
FREE
Download the USDJPY free version here.
Scalping Strategy
BUY SELL
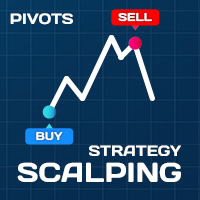
Having a strategy in the market is one of the main conditions for trading. The presence of various and complicated indicators and tools sometimes makes trading difficult, and the user gets confused after trying various methods and gets stuck in a loss cycle, the result of which is usually clear. This indicator is a simple strategy based on the detection of pivots and short-term trends, which helps you to easily trade i
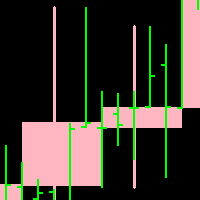
Candleline: candleline indicator. According to the specified period, draw the candle line of the specified period on the current chart. In addition, the new candlelight line is superimposed with the candlelight line of the current chart.
Note: the period of the current chart must be less than the period of the candle line to be drawn.
For the specific effect of self drawing candle line, please see the attached picture below. Parameter: 1.TimeFrame; 2. NumberOfBar; 3.Up candle
FREE

This indicator is a histogram showing the trend based on 3 different moving averages. When all averages are set in ascending order, the indicator is green, and when in descending order, it is red. If the averages do not show a trend, the color is yellow. Additionally, each average can have different settings, such as Mode MA and Price MA. You can also set an alert and receive notifications on your phone.
To enable the alert and push notification, you need to activate them first in the MT4 setti
FREE
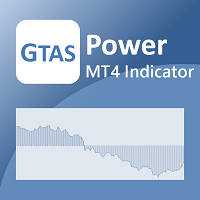
GTAS Power — это индикатор импульса, помогающий определить тренд на основе комбинации скользящих средних. Этот индикатор был создан Бернардом Пратсом Деско (Bernard Prats Desclaux), трейдером и бывшим менеджером хедж-фонда, основателем E-Winvest.
Описание Индикатор представляет собой зеленую или красную гистограмму с линией равновесия 0.
Инструкция по применению Когда GTAS Power зеленый, тренд бычий. Когда он красный, тренд медвежий. Индикатор можно использовать в качестве фильтра в дополнен
FREE

Instant Trend Line this indicator has been designed for multi time frame
Buy Call: When the Blue Moving average (MA) line crossed above the Red Moving average (MA) . Sell Call: When the Blue Moving average (MA) line crossed below the Red Moving average (MA) .
Happy and profitable trade for ever!!! this indicator is suitable for all time frame, but our recommended time frame is above 15 min chart. Suitable to all the forex chart
FREE
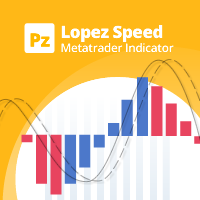
Осциллятор рассчитывает различные векторы цены/времени для отображения итогового направления рынка на основе суммы всех векторов цены/времени и двух скользящих средних, чтобы рассчитать, ускоряется рынок или замедляется. Прост в освоении и использовании
Эффективный фильтр сделок Уникальный алгоритм вычисления скорости Не перерисовывается
Снабжен различными алертами
Может использоваться в качестве эффективного фильтра сделок по тренду. Основные принципы использования: если синяя скользящая сре
FREE

Download directly the indicator file here. (if you can't open on MT4) MACD Indicator is one of the most popular momentum indicators among users. Searching and detecting MACD signals by the eye may not be easy. Scan Full Charts Dashboard Indicator with simple user interface and search customization panel saves time and scans all charts for MACD signals search and notifies the user with high accuracy. After finding the signal, the user was aware of the result by alerts and notifications. This ind
FREE

A ratio between 0 and 1 with the higher values representing a more efficient or trending market, It is used in the calculation of Perry J. Kaufman Adaptive Moving Average (KAMA), dividing the price change over a period by the absolute sum of the price movements that occurred to achieve that change. The Fractal Efficiency or also known as Efficiency Ratio was first published by Perry J. Kaufman in his book ‘Smarter Trading‘. This is mostly considered a filter for volatile markets none the less
FREE

You've probably heard about the Dow trend Theory, where higher highs and lows indicate an uptrend, and lower highs and lows indicate a downtrend. This indicator determines this trend based on the Dow Theory. You just need to enter a number representing the number of candles between extremes. The optimal solution is the number 3, unless you want to have the trend from M5 but you're on M1, then you need to multiply this number by 5. Check various combinations to trade with the trend. In the scree
FREE
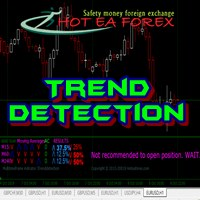
Recognizing trends is one of the most important analytical skills in trading. Not only technical traders, those who are fundamentally leaning to make the forex trend as the basis of analysis to determine entry trading. However, learning how to look at forex trends is not as simple as it seems. If you want signal accuracy to estimate the direction of the next price, then there are advanced methods in learning how to look at forex trends that you need to know. Strategy SIMPLE HOw to read trend mar
FREE

Данный индикатор отображает на графике цены сигналы высокоэффективного осциллятора - Laguerre Osc 2 AM . Представленный индикатор использует фильтр Laguerre для построения осцилятора. Индикатор имеет возможность двойного дополнительного сглаживания, что может быть полезно при малых значениях параметра Gamma. Индикатор подает три типа сигналов: Выход осциллятора из зоны перекупленности/перепроданности; Пересечение осциллятором середины значения между зонами перекупленности/перепроданности; Вход
FREE
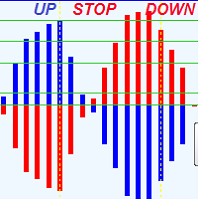
This indicator that shows precise price direction ,and force of this direction, reversals ,added it to any chart and you supress any confusion .
It calculs force of current direction and Predicts price reversals with high degree of accuracy withs its key levels and it is great for scalping , Or swing trading . For any time frame the following behavor is the same : Blue Histogram above 0.0 means that a buyers dominates price movement In other side , Red Histogram Above 0.0 means sellers

Introduction and Description
Colored candlesticks showing the trend based on two moving averages and the slope of the slow moving average. A trend is the overall direction of a market or an asset's price. In technical analysis, trends are identified by trendlines or price action that highlight when the price is making higher swing highs and higher swing lows for an uptrend, or lower swing lows and lower swing highs for a downtrend. Many traders opt to trade in the same direction as a trend, whi
FREE

Данный индикатор отображает момент пересечения осциллятором RSI нулевого значения, и момент пересечения осциллятором RSI своего сглаженного значения. Пересечение осциллятором RSI нулевого значения - сигнал на покупку/продажу. Пересечение осциллятором RSI своего сглаженного значения - сигнал о смене тенденции.
Сигнал подается после окончания формирования свечи. Подтверждением сигнала является пересечение ценой максимума/минимума бара на котором сигнал был подан. Индикатор не перерисовывается
FREE

Этот индикатор позволяет манипулировать видимостью графика в режиме реального времени. Правая сторона скрывается от пользователя. Виртуальная таймлайн может быть передвинута в любое место на графике. Также индикатор работает на закрытом рынке. Если вы используете визуальный анализ для торговли, то этот индикатор отличный инструмент для тестирования вашей стратегии. Он позволит не подглядывать в историю и быть честным перед собой в анализе.
Успехов!
FREE

Основываясь на сочетании показателей, E13 Acid Fulx является отличным показателем для зная, когда покупать или продавать на любой актив и временность. Индикатор сам я использовал его в качестве инструмента для моего анализа при торговле Forex. Это полезный и простой для понимания индикатор тренда. Если вы объедините его с вашим собственным анализом вы, безусловно, получите хороший результат в вашей операции.
FREE

После 7 лет я решил выпустить некоторые свои индикаторы и советники бесплатно.
Если вы находите их полезными, пожалуйста, поддержите меня пятизвёздочным рейтингом! Ваш отзыв помогает продолжать выпуск бесплатных инструментов! Также смотрите мои другие бесплатные инструменты здесь
_________________________________ Индикатор %B для Улучшенного Анализа Форекс Индикатор %B, мастерски созданный на MQL4, является динамичным инструментом, предназначенным для революционизации анализ
FREE

TLM Map AM (Trend Line Momentum Map) - индикатор разработанный на основе комплекса цифровых индикаторов технического анализа описанных в статье Владимира Кравчука: "Цифровые индикаторы в техническом анализе финансовых рынков" . Индикатор отображает в отдельном окне комплекс таких цифровых индикаторов технического анализа как FTLM и STLM. Рекомендуется использовать совместно с индикатором RTL Map AM (Reference Trend Line Map) . Индикатор не имеет настраиваемых параметров.
FREE
Индикатор является комплексом из MACD и OsMA, построенным по данным комплекса из нескольких стандартных осцилляторов. Такая комбинация позволяет получить лучшее от обоих типов индикаторов. С одной стороны - быстрое реагирование на изменения рыночной обстановки, с другой - эффективное следование рынку и фильтрация шума. Значения индикатора на полностью сформированной свече не перерисовываются.
FREE

С помощью данного инструмента теперь нет необходимости проверять волатильность интересующих вас валютных пар на сторонних вебсайтах с целью определения среднего диапазона движения цены. Индикатор Truly Volatility предназначен для определения волатильности и расчета среднего движения цены в часовой, либо дневной период. Данные отображаются в отдельном окне в виде гистограммы и текстовых значений. Использовать индикатор можно как альтернативу тому же ATR, но возможностью более детального анализа.
FREE

The indicator allows you to trade binary options. The recommended time frame is М1 and the expiration time is 1 minute. The indicator suitable for auto and manual trading. A possible signal is specified as a arrows above/under a candle. You should wait until the candle closes! Arrows are not re-painted Trade sessions: LONDON and NEWYORK section Currency pairs: GRB/USD Working time frame: M1 Expiration time: 1 minute. The indicator also shows good results when using the martingale strategy - "Mar
FREE
Simple Trading System Update !!! Follow this link to see our 2024 Strategy !!! ( Download the EAs scanner)
Deal trading trend indicator is a useful indicator tool predicting the market movement, easy-to-use due to obviously showing trend line, arrow and target point. You can consider the direction of the market for going up or going down by using this indicator. For free version, some function is restricted such as trend line and arrow.
Parameters In this section, we are explaining the ma
FREE

RaysFX Stochastic L'indicatore RaysFX Stochastic è un indicatore personalizzato per la piattaforma MetaTrader 4.
Caratteristiche principali:
-Indicatori separati: L'indicatore viene visualizzato in una finestra separata sotto il grafico principale. -Livelli dell'indicatore: L'indicatore ha due livelli predefiniti, 20 e 80, che possono essere utilizzati come livelli di ipervenduto e ipercomprato. -Buffer dell'indicatore: L'indicatore utilizza quattro buffer per calcolare e memorizzare i suo
FREE
Indicador Gratuito desarrollado por Mr Beast Inversiones Mr Beast : Gestión de riesgo profesional. Brindo a la comunidad la entrada a productos de M Beast. Echar un vistazo a mis señales y expert advisors. Descuentos de hasta 70% Diclaimer: La negociación en Forex, CFD y Opciones conlleva un riesgo de pérdida sustancial y no es adecuada para todos los inversores. El alto grado de apalancamiento puede actuar en su contra y también en su favor, Antes de decidirse a operar en productos tan apalanca
FREE

This Dashboard is free to download but is dependent on you owning the Advanced Trend Breaker . Get the indicator here: https://www.mql5.com/en/market/product/66335
The Dashboard will show you on a single chart all the timeframes (M1 to Monthly) with their own status for the indicator: Advanced Trend Breaker
all time frame and all symbol: smart algorithm detects the trend,Support and resistance, filters out market noise and find breaker of entry signals!!!
!!!
How to unders
FREE

Этот индикатор рассчитывается непосредственно значение индекса доллара по формуле ICE и строит диаграмму, что может помочь вам в качестве справочной информации. Нет необходимости искать брокера, предоставляющего ICE DX дл\ его использования - индикатор сам рассчитывает необходимые значения. Могут быть мелкие расхождения между точными значениями свечи или времени из-за времени закрытия на торговой площадке и разницы знаков после запятой, но в целом индикатор дает хорошую информацию. Необходимо,
FREE

This indicator shows the realistic and precise trend. The plotted line as a trend indicator is the best secure place to set the stop-loss.
In case that trend is bullish you will see the plotted line under the candles and in the case of the bearish market, the plotted line is on the upper side of candles. Buy paid version of this indicator which it is Statistical Support Resistance .
FREE

Данный индикатор окрашивает свечи в соответствии с прогнозируемым ценовым движением. Анализ производится на основании данных классического ADX. Если линия DMI+ выше линии DMI- свеча окрашивается цветом, сигнализирующем о росте цены; Если линия DMI+ ниже линии DMI- свеча окрашивается цветом, сигнализирующем о падении цены. Индикатор на полностью сформированных свечах не перерисовывается. Свеча которая формируется может менять цвет, в зависимости от текущих данных. Таким образом для принятия решен
FREE

Индикатор Record Session High Trader использует концепцию торговли внутри свечи для оценки истощения тренда, когда тренд близок к развороту или паузе. При прошествии 8 или более свечей с более высокими ценами закрытия, фиксируется максимум сессии. При прошествии 8 или более свечей с более низкими ценами закрытия, фиксируется минимум сессии. Мы не полагаемся на обычные индикаторы типа осцилляторов для поиска зон перекупленности или перепроданности. Мы больше рассчитываем на анализ фактической цен
FREE
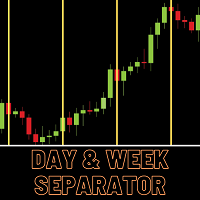
Day and Week separator is a very simple tool to show day and week separator lines from a specific time mentioned in the input. This is specially helpful for the trades who has time zone differences in their broker terminal. Let us take an example If user know that at 7:00 in the chart his local time 00:00 then he will simply put 7:00 in the input . Separator lines will starts drawing from current day's 7:00 There is also a bold line for weekly separator
FREE

Moving Average Rainbow Stack: Free: Single Currency & Single Timeframe MA Stack Very useful for finding current and higher timeframe trends. Best suited for long term trend based trading. Use fewer MAs for quick scalping. And not suitable during low volatility. Only use during high volatility and steady trending markets. Use this to enhance your existing Trend based strategies to find best trends.
Read detailed description https://abiroid.com/product/abiroid-ma-stack Available MTF and Scanner
FREE
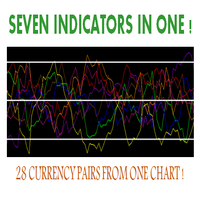
Hello, This indicator is a unique high reliability 7-in-1 multicurrency indicator comprising these sub-indicator’s: A Trend Power Crossover Indicator. A Percent Change Crossover Indicator. A Currency Overbought/Oversold Indicator. A Currency Deviation Indicator. A Currency Impulse Signal Indicator. A Trend Power Indicator. A Currency Volatility Indicator. The main advantage of this indicator is that it's reasoning by currency and not by currency pair. The values of each sub-indicator are calcul
FREE
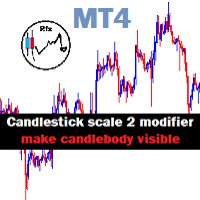
Candlestick Mod rapat.
Chart Candlesticks will stick together. make it look neat and tidy Switch between Candlestick and Line chart fixed. Instruction.
If you don't like the candles colors, you can do so by changing color. read below:
-Colors must be changed in the indicator setting.
-It won't change through the Chart properties to modify.
-After changing the color, save it as template so it wont change the colors to default value.
FREE

Triple Exponential Moving Average ( TEMA ) is a moving average (MA) that gives the most weight to recent price data. TEMA is more reactive to all price fluctuations than a Simple Moving Average (SMA) or an Exponential Moving Average (EMA) or even a Double Moving Average (DEMA) and surely can help traders to spot reversals sooner because it responds very fast to any changes in market activity. TEMA was developed by Patrick Mulloy in an attempt to reduce the amount of lag time found in trad
FREE

The different server times for each broker can be a heavy load when trading in short period.
This indicator displays the minimum trade information required to win at a glance.
The sub window displays the local time, and the main chart displays not only the local time,
-Symbol
-Period
-BarEndTime
-Spred
-TokyoTime
-LondonTime
-NewYorkTime
-ServerTime
and so on...
The information display on the main chart can be selected from four places: upper right, lower ri

The MACD (Moving Average Convergence Divergence) indicator is one of the most widely used technical analysis tools by traders worldwide. Created by Gerald Appel in the 1970s, the MACD is an indicator that helps investors identify the trend direction, trend strength, and possible trend reversal points. The MACD indicator is composed of a histogram that shows the difference between the 12-period exponential moving average and the 26-period exponential moving average. The top part of the histogram
FREE
Простой, но полезный индикатор для контроля волатильности при внутридневной торговле. Индикатор наносит на текущий график уровни средней волатильности (ATR) за указанное количество дней. На текущем торговом дне уровни динамические и перемещаются в зависимости от минимума и максимума цены текущего дня в режиме "реального времени". Во входных параметрах мы задаем: - количество дней для расчета и отрисовки уровней среднего АТР - цвет линий уровней среднего АТР - толщину линий уровней среднего АТР
FREE

Supertrend Moving Average A combination of Supertrend and Moving Average to create a converging trade setup Input parameters: signal mode: set it to true if you want to plug it into STAT (Signal Tester and Trader) arrow shift: distance between fast EMA line to arrow on chart turn on moving average signal for converging setup supertrend period ATR multiplier Moving average period Averaging method Pricing You can find the best setting for 4 hour EURUSD on this video
FREE

Данный индикатор отображает значения доходности за выбранный период. Они отображаются как логарифм доходности, нежели значения цены или необработанные данные о доходности. Для малых значений доходности, показатели арифметической и геометрической доходности будут схожими. Преимущество использования значений доходности вместо цен заключается в нормализации. Это делает возможным сравнение всех переменных в сопоставимой метрике, несмотря на происхождение из ценовых рядов с разными значениями.
Вход
FREE
Индикатор информирует о том, когда закроется текущий бар и откроется новый бар. ВРЕМЯ является важным элементом торговых стратегий. Индикатор BarTimerPro поможет вам КОНТРОЛИРОВАТЬ ВРЕМЯ . Простой в использовании: поместите на график и если нужно задайте “будильники”. В тестере индикатор не работает
Основные Возможности
4 режима работы: Показывает время прошедшее с момента открытия текущего бара (11) Показывает время оставшееся до закрытия текущего бара (11) Обновление индикатора каждый
FREE

3 стратегии с RSI! Алерты! Проверка на свежесть сигнала! Индикатор основан на классическом RSI. Рекомендую посмотреть моего советника - Night Zen EA
Подпишись на мой telegram канал, ссылка в контактах моего профиля . В него включены 3 стратегии: Вход индикатора RSI в зону перекупленности (для сделок на покупку) / перепроданности (для сделок на продажу) Выход индикатора RSI из зоны перекупленности (для сделок на продажу) / перепроданности (для сделок на покупку) Касание предельного уровня пе
FREE

Chart Time — очень простой индикатор, но он может быть очень важным помощником для контроля времени перед открытием сделки вручную. В индикаторе есть три варианта отображения времени на графике.
Входные параметры Show Time : выбор вариантов отображения времени. Local Time (локальное время компьютера), Server Time (время сервера брокера) или GMT. Рекомендации: Индикатор надо запускать на каждом необходимом графике.
FREE

Индикатор My Big Bars (мои большие бары) показывает бары (свечи) более старшего таймфрейма. То есть, если открыт график с таймфреймом H1 (один час), индикатор "подкладывает" снизу график с таймфреймом H4, D1 и так далее. Используются следующие старшие таймфреймы: M3, M5, M10, M15, M30, H1, H3, H4, H6, H8, H12, D1, W1 и MN1. Индикатор автоматически подбирает только те старшие таймфреймы, которые больше текущего и кратны ему. Если открыт график с таймрфеймом M30 (30 минут), то среди старших таймфр
FREE

Supreme Stoploss is an indicator for metatrader 4 that is based on the ATR indicator , it gives stoploss/takeprofit as lines drawn above and below the price , this indicator does not repaint/back paint and is not delayed. can be used to determine the stop loss or take profit of a trade using ATR value multiplied by the number set by user. ====================================================================================================== Parameters : ATR SL period : ATR period identity : leave
FREE
Целью этой новой версии стандартного MT4 индикатора, входящего в поставку платформы, является отображение в подокне нескольких таймфреймах одного и того же индикатора. См. пример, приведенный на рисунке ниже. Однако индикатор отражается не как простой индикатор MTF. Это реальное отображение индикатора на его таймфрейме. Доступные настройки в индикаторе FFx: Выбор таймфрейма для отображения (от M1 до MN) Установка ширины (количество баров) для каждого окна таймфрейма Всплывающее оповещение/звуков
FREE
MetaTrader Маркет - единственный магазин, где можно скачать демоверсию торгового робота и подвергнуть его проверке и даже оптимизации на исторических данных.
Прочитайте описание и отзывы других покупателей на заинтересовавший вас продукт, скачайте его прямо в терминал и узнайте, как протестировать торгового робота перед покупкой. Только у нас вы можете получить представление о программе, не заплатив за неё.
Вы упускаете торговые возможности:
- Бесплатные приложения для трейдинга
- 8 000+ сигналов для копирования
- Экономические новости для анализа финансовых рынков
Регистрация
Вход
Если у вас нет учетной записи, зарегистрируйтесь
Для авторизации и пользования сайтом MQL5.com необходимо разрешить использование файлов Сookie.
Пожалуйста, включите в вашем браузере данную настройку, иначе вы не сможете авторизоваться.